
Earnings Growth Consistency: Results Across 17 Global Exchanges
We ran a 3-year net income growth streak screen on 17 exchanges over 25 years, benchmarked vs local indices. Result: UK +11.12% vs FTSE, Canada +7.38% vs TSX, US +3.70% vs SPY. India underperforms Sensex (-2.02%). Japan beats Nikkei (+3.38%). Full data for all 17 exchanges.

We ran a single screen on 17 exchanges: buy companies that grew net income every year for three consecutive years. Quality filters: ROE above 8%, debt-to-equity below 2.0. Rank by ROE, hold the top 30, rebalance annually in July. Same signal, same rules, 17 markets, 25 years.
Contents
- Method
- The Geographic Split
- The strong outperformers: UK, Canada, Switzerland
- The solid outperformers: US, Germany, Japan
- The underperformers: India, Asia (ex-Japan), Southern Europe
- Why the Signal Works in Anglo-Saxon Markets
- Down Capture: The Protection Comparison
- Data Notes
- What We Tested
- Backtest Methodology
- Limitations
- Takeaway
- Dedicated Exchange Analyses
Execution updated: next-day close (MOC) for all exchanges. Each exchange now benchmarked against its local index (not SPY) where available: Sensex for India, FTSE 100 for UK, DAX for Germany, TSX Composite for Canada, and local indices for most other markets. SPY used for markets without local benchmarks in the dataset.
The results split along geography. Anglo-Saxon markets (US, Canada, UK) beat their local benchmarks clearly. Germany beats the DAX. India underperforms the Sensex despite strong absolute returns. Asia and Southern Europe show mixed to negative results vs local markets.
| Exchange | CAGR | Benchmark | Excess | Sharpe | Max DD | Down Capture | Cash% | Avg Stocks |
|---|---|---|---|---|---|---|---|---|
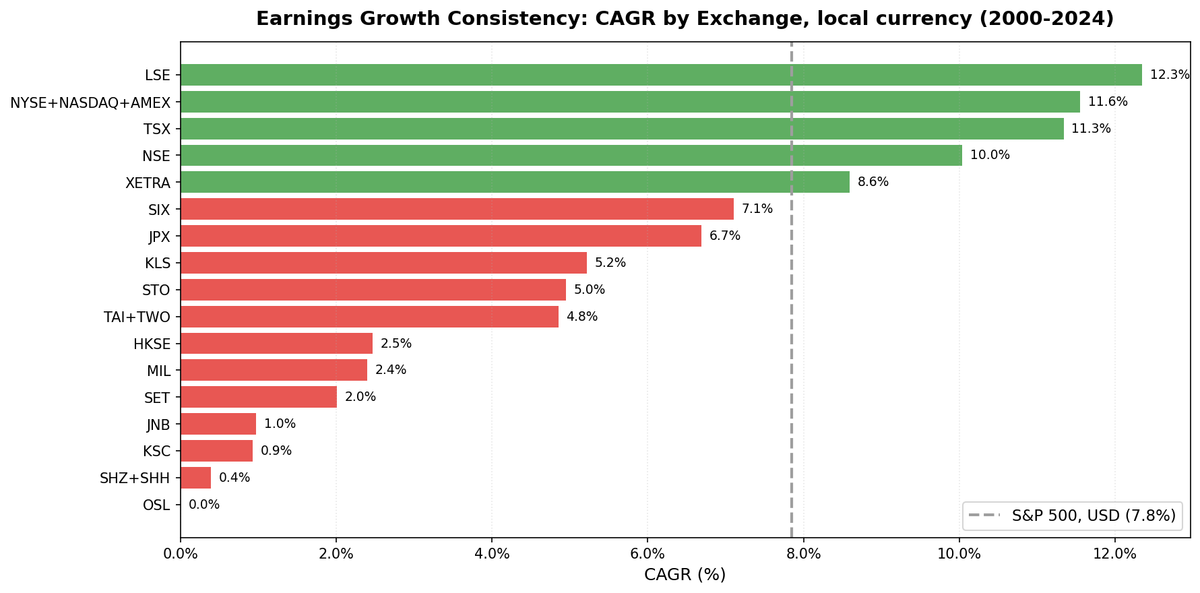
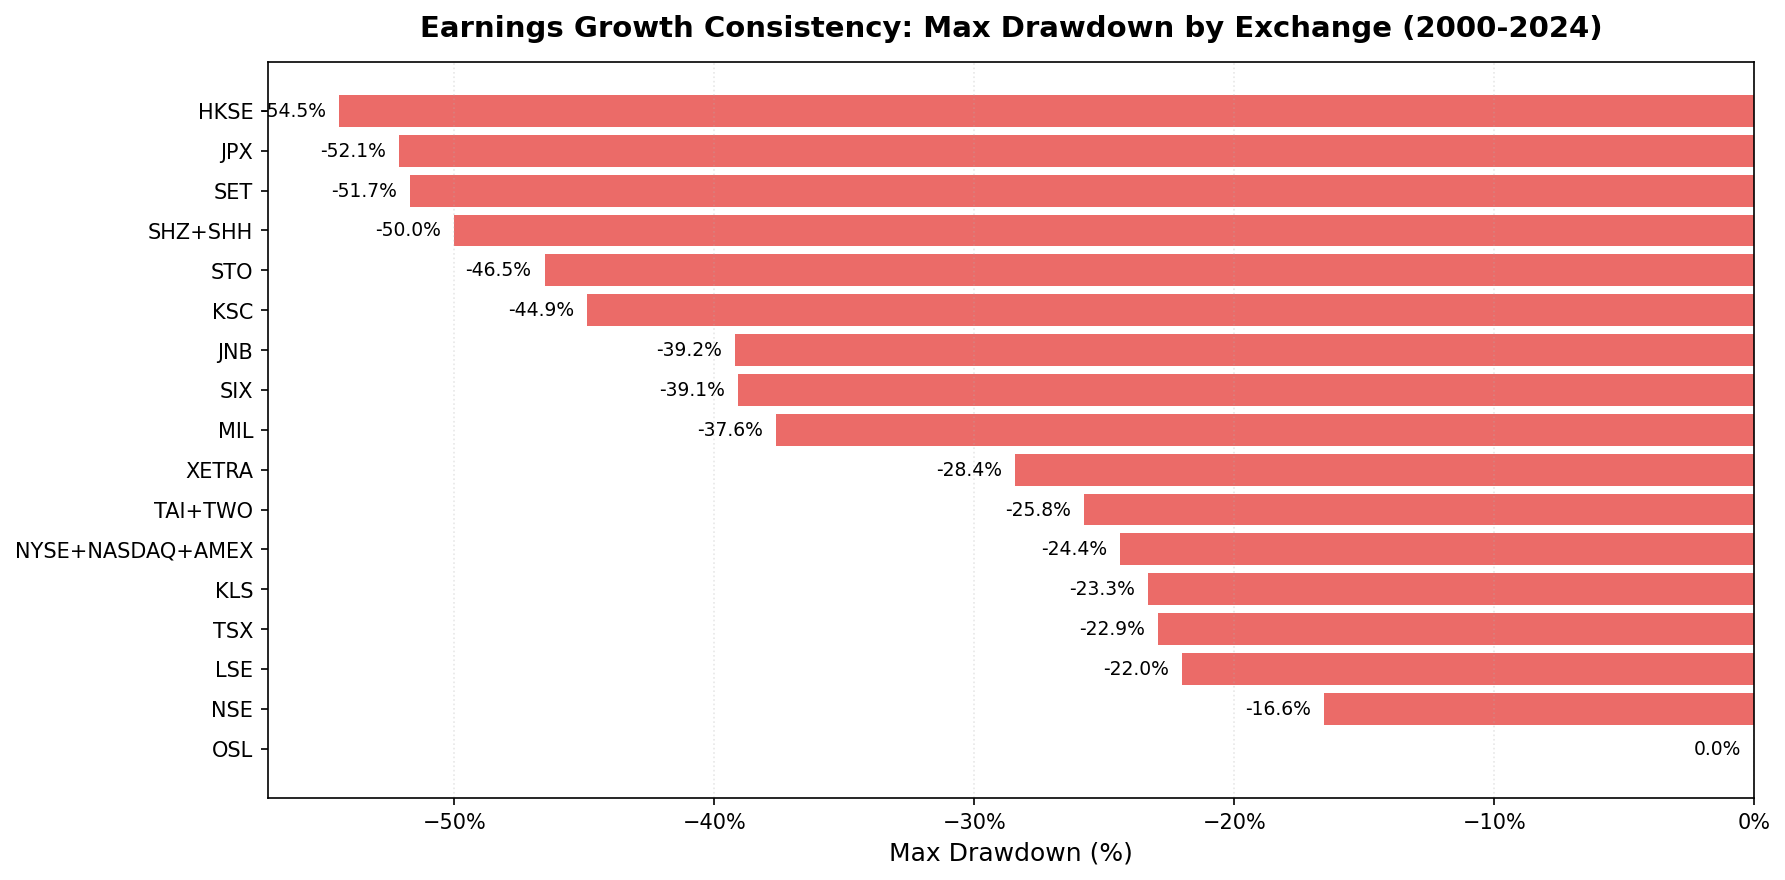
| UK (LSE) | 12.35% | FTSE 100 (1.23%) | +11.12% | 0.528 | -22.0% | -16.3% | 0% | 13.4 |
| US | 11.55% | SPY (7.85%) | +3.70% | 0.574 | -24.4% | +60.8% | 0% | 27.0 |
| Canada (TSX) | 11.34% | TSX Comp (3.95%) | +7.38% | 0.611 | -22.9% | -31.7% | 0% | 21.6 |
| India (NSE) | 10.04% | Sensex (12.06%) | -2.02% | 0.162 | -16.6% | +13.6% | 28% | 23.4 |
| Germany (XETRA) | 8.59% | DAX (5.04%) | +3.55% | 0.423 | -28.4% | +23.7% | 0% | 17.3 |
| Switzerland (SIX) | 7.10% | SMI (1.74%) | +5.36% | 0.306 | -39.1% | +67.0% | 4% | 11.5 |
| Japan (JPX) | 6.69% | Nikkei (3.31%) | +3.38% | 0.316 | -52.1% | +49.9% | 16% | 25.5 |
| Malaysia (KLS) | 5.22% | SPY (7.85%) | -2.63% | 0.229 | -23.3% | +25.9% | 36% | 15.7 |
| Sweden (STO) | 4.95% | OMX30 (2.55%) | +2.40% | 0.148 | -46.5% | +31.0% | 44% | 21.0 |
| Taiwan | 4.85% | TAIEX (4.09%) | +0.77% | 0.256 | -25.8% | +36.5% | 36% | 26.1 |
| Hong Kong (HKSE) | 2.47% | Hang Seng (1.64%) | +0.82% | -0.024 | -54.5% | +70.2% | 0% | 17.8 |
| Italy (MIL) | 2.40% | SPY (7.85%) | -5.45% | -0.043 | -37.6% | +46.5% | 60% | 16.8 |
| Thailand (SET) | 2.01% | SET Index (5.13%) | -3.12% | -0.024 | -51.7% | +130.6% | 32% | 22.4 |
| South Africa (JNB) | 0.97% | SPY (7.85%) | -6.88% | -0.609 | -39.2% | +18.0% | 52% | 10.5 |
| Korea (KSC) | 0.93% | KOSPI (5.35%) | -4.43% | -0.194 | -44.9% | +40.7% | 44% | 22.4 |
| China (SHH) | 0.39% | SSE Comp (2.43%) | -2.04% | -0.063 | -50.0% | +107.6% | 0% | 20.8 |
| Norway (OSL) | 0.00% | — | — | — | — | — | 100% | 0 |
Note: Each exchange benchmarked against its local index where available (Sensex, FTSE 100, DAX, TSX Composite, Nikkei, etc.). For exchanges without local benchmarks in the dataset (Italy, Malaysia, South Africa), SPY used as fallback. Benchmark CAGR shown in parentheses. Cross-currency effects embedded in non-USD comparisons.

Data: FMP financial data warehouse, 2000–2025. Updated June 2026.
Method
Signal: Net income grew year-over-year in each of the last three fiscal years. Four data points required. All positive.
Quality filters: ROE > 8%, D/E < 2.0.
Portfolio: Top 30 by ROE descending, equal weight. Hold cash if fewer than 10 qualify.
Rebalancing: Annual, July. Matches fiscal year filing cadence with 45-day lag from December/March FY-end.
Point-in-time: Filing date used, not fiscal year end, with 45-day lag. FY filings older than 5 years are ignored.
Each exchange uses a locally adjusted market cap threshold. The Japan threshold is ¥10B, Canada is CAD 700M, India is ₹5B. Not a flat $1B USD globally.
The Geographic Split
Six exchanges show positive alpha vs their local benchmarks: UK (+11.12% vs FTSE 100), Canada (+7.38% vs TSX), Switzerland (+5.36% vs SMI), US (+3.70% vs SPY), Germany (+3.55% vs DAX), and Japan (+3.38% vs Nikkei). India underperforms the Sensex (-2.02%) despite strong absolute returns.
The strong outperformers: UK, Canada, Switzerland
UK leads on excess vs local benchmark: +11.12% per year vs FTSE 100 (1.23% CAGR). Win rate of 92%, the highest of all 17 exchanges. Caveat: FTSE 100 is a price index (no dividends); vs total-return FTSE, the excess would be 6-7%. Still strong. Max drawdown of -22.0% is the lowest of any fully-invested exchange.
Canada delivers +7.38% excess vs TSX Composite (3.95% CAGR). Sharpe of 0.611, the highest of all 17 exchanges. Down capture of -31.7% is negative: when the TSX fell, Canadian consistent earners gained on average. Win rate: 76%. The TSX is commodity-heavy; the filter selects defensive financials and utilities that move against the commodity cycle.
Switzerland shows +5.36% vs SMI (1.74% CAGR). A concentrated 11.5 stocks on average, 4% cash, and clean outperformance. The SMI's weak performance over the period makes the alpha look stronger, but the signal clearly works.
The solid outperformers: US, Germany, Japan
US: 11.55% CAGR, +3.70% excess vs SPY (7.85%). 68% win rate, 27.0 average stocks, 0 cash periods. The broadest market in the study delivers consistent, diversified outperformance.
Germany: +3.55% excess vs DAX (5.04%). Win rate 64%. The signal works clearly in Germany when benchmarked against the local market (vs old +0.77% vs SPY). 2024 showed the risk: -33.5% miss when the DAX surged.
Japan: +3.38% excess vs Nikkei (3.31%). This is notable, vs SPY, Japan underperformed. Vs the local Nikkei, it works. 16% cash but positive alpha when invested.
The underperformers: India, Asia (ex-Japan), Southern Europe
India is the surprise: 10.04% CAGR vs Sensex 12.06% (-2.02% underperformance). Strong absolute returns but doesn't beat the local market. India's secular bull over 2007-2024 (the invested period) outpaced a quality filter. The 2014 (+48.3% excess) and 2009 (+37.9%) years show the filter can work in India, but overall it trails the Sensex.
Korea: -4.43% vs KOSPI (5.35% CAGR). 44% cash. The chaebol structure means large Korean companies carry leverage by design. The earnings consistency filter eliminates most of them, leaving a thin and inconsistent investable universe. Even vs the local KOSPI, the filter underperforms.
Thailand: -3.12% vs SET Index (5.13% CAGR). The portfolio returned just 2.01% CAGR in absolute terms, well behind a local market that compounded at 5.13%. Tourism-cyclical Thailand doesn't have a deep pool of consistent earners.
Malaysia: -2.63% vs SPY (no local benchmark available). 36% cash. Commodity-linked Malaysia produces thin qualifying universes.
China: -2.04% vs SSE Composite (2.43% CAGR). State-owned enterprise dominance, opaque reporting. The 2006 return of +116.6% reflects the genuine A-share bubble. Overall, consistent earners don't outperform in China.
Hong Kong: +0.82% vs Hang Seng (1.64% CAGR). 0% cash, -54.5% max drawdown, the worst drawdown in the study. The screen edged out the local market by a thin margin, but with the deepest peak-to-trough loss of any exchange.
Taiwan, Sweden, Italy, South Africa: Mixed results. Taiwan edges out TAIEX slightly (+0.77%). Sweden beats OMX30 (+2.40%). Italy and South Africa have high cash periods and negative results.
Why the Signal Works in Anglo-Saxon Markets
The pattern has a structural explanation.
Earnings consistency as a signal requires three things to generate alpha:
- Transparent reporting. Financial statements must accurately reflect earnings. In markets with weak audit or enforcement, "consistent earnings" may not be real.
- Market pricing of fundamentals. Markets must price durable earnings power. Momentum-dominated markets can misprice quality.
- Defensive company composition. The signal needs a pool of defensive, quality businesses. Markets dominated by state enterprises, commodity exporters, or cyclicals have fewer companies whose earnings compound steadily.
Anglo-Saxon markets (US, UK, Canada) score high on all three. Germany and Switzerland also show the signal working. Japan works vs the Nikkei. India's failure vs the Sensex reflects a different issue: India's broad market was so strong (Sensex 12.06% CAGR) that even a quality filter producing 10.04% underperformed.
Asian markets (China, Korea, Hong Kong) face challenges: audit quality in China, chaebol leverage in Korea, state enterprise exposure in Hong Kong.
Down Capture: The Protection Comparison
| Exchange | Down Capture (vs local) | Signal |
|---|---|---|
| Canada | -31.7% | Rises when TSX falls |
| UK | -16.3% | Rises when FTSE 100 falls |
| India | +13.6% | Strong protection vs Sensex |
| South Africa | +18.0% | Strong protection (thin universe, vs SPY) |
| Germany | +23.7% | Strong protection vs DAX |
| Malaysia | +25.9% | Strong protection (vs SPY) |
| Sweden | +31.0% | Moderate protection vs OMX30 |
| Taiwan | +36.5% | Moderate protection vs TAIEX |
| Korea | +40.7% | Moderate protection vs KOSPI |
| Italy | +46.5% | Moderate protection (vs SPY) |
| Japan | +49.9% | Some protection vs Nikkei |
| US | +60.8% | Some protection vs SPY |
| Switzerland | +67.0% | Limited protection vs SMI |
| Hong Kong | +70.2% | Minimal protection vs Hang Seng |
| China | +107.6% | Negative (worse drawdowns than SSE Composite) |
| Thailand | +130.6% | Negative (worse than SET Index) |
Markets with negative or very low down capture (Canada, UK) show the filter creating genuinely defensive portfolios. Markets with high down capture (China, Thailand) show the filter failing to provide crisis protection even when it finds companies with historical earnings growth.
Data Notes
Norway (OSL): 100% cash across all 25 periods. Norway's exchange is dominated by oil and gas companies (Equinor, Aker BP, and similar) whose earnings move with commodity prices, not consistent growth trajectories. The earnings consistency filter eliminates almost the entire investable universe. Norway is included in the exchange count but excluded from all content recommendations.
China 2006: Annual return of +116.6% reflects the genuine Shanghai A-share bubble (the Shanghai Composite gained over 130% in 2006). This is a real market event, not a data artifact. It contributes meaningfully to China's CAGR but also to its volatility and max drawdown.
Italy (MIL) and South Africa (JNB): 60% and 52% cash respectively. Too few invested periods for reliable signal analysis. Both are excluded from dedicated blog coverage but included here for completeness.
India 2000-2006: Seven consecutive cash periods due to insufficient NSE coverage in the data provider. Results from 2007-2024 are clean. Note: This backtest uses NSE only (not BSE+NSE) to avoid dual-listing bias.
What We Tested
17 exchanges included: NYSE/NASDAQ/AMEX (US), NSE (India), LSE (UK), XETRA (Germany), TSX (Canada), SIX (Switzerland), STO (Sweden), JPX (Japan), SHH (China), KSC (Korea), HKSE (Hong Kong), TAI/TWO (Taiwan), SET (Thailand), JNB (South Africa), MIL (Italy), KLS (Malaysia), OSL (Norway).
Excluded exchanges: ASX (Australia) and SAO (Brazil) are excluded from all backtests due to adjusted price artifacts in the underlying data. They are not included in this comparison.
Backtest Methodology
| Parameter | Value |
|---|---|
| Signal | 3-year net income growth streak (y1>y2>y3>y4>0), ROE > 8%, D/E < 2.0 |
| Portfolio | Top 30 by ROE, equal weight |
| Cash rule | 100% cash if fewer than 10 qualify |
| Rebalance | Annual, July |
| MCap | Per-exchange local currency threshold |
| Benchmark | Local index where available (Sensex, FTSE 100, DAX, TSX Composite, Nikkei, etc.); SPY for markets without local benchmarks |
| Execution | Next-day close (MOC) |
| Data | FMP financial statements + EOD price data |
| Period | 2000-2025 |
| Data lag | Point-in-time, 45-day lag on financial statements |
Limitations
Survivorship bias. Exchange membership uses current company profiles. Companies that delisted during the backtest period may not be fully captured, which likely causes some upward bias in reported returns.
Currency effects. Returns are computed in local currency and benchmarked against local indices where available. This eliminates cross-currency comparison issues for most exchanges. Italy, Malaysia, and South Africa still use SPY as fallback benchmarks and embed currency effects.
Data coverage variance. Early years (2000-2005) have thinner coverage for many non-US exchanges. Results from 2006 onward are more reliable for all exchanges in this study.
Equal weight: The strategy doesn't adjust position size for liquidity. In markets with thin trading (HKSE, some KLS stocks), equal weight creates implicit concentration risk. Transaction costs and market impact aren't modeled.
Takeaway
The earnings consistency screen works across Anglo-Saxon markets (US, Canada, UK) plus Germany, Switzerland, and Japan (vs local benchmarks). It shows modest positive alpha in Taiwan, Sweden, and Hong Kong. It fails in India (vs Sensex), Korea, Thailand, Malaysia, China, Italy, and South Africa.
When you benchmark each market against its local index, the pattern is clear: defensive-sector markets (US, Canada, UK) and quality-focused European markets (Germany, Switzerland) reward earnings consistency. High-growth emerging markets (India, China) and chaebol/state-enterprise markets (Korea, Hong Kong) don't.
The signal isn't universal. It's market-dependent. Use it where market microstructure prices fundamental quality.
Dedicated Exchange Analyses
- US Results: 11.55% CAGR, 68% win rate, 0% cash
- Canada Results: 11.34% CAGR, -31.7% down capture, best Sharpe
- UK Results: 12.35% CAGR, -22.0% max drawdown, highest win rate (92%)
- India Results: 10.04% CAGR, -2.02% vs Sensex (underperforms local market)
- Germany Results: 8.59% CAGR, +3.55% vs DAX
Backtest code: github.com/ceta-research/backtests
Data: Ceta Research, FMP financial data warehouse. Annual rebalance (July), equal weight (top 30 by ROE), 2000-2025. Execution: next-day close (MOC). Benchmarks: local indices where available.
Past performance does not guarantee future results. This is educational content, not investment advice.


