
Earnings Growth Consistency on US Stocks: 25-Year Backtest
Screened NYSE/NASDAQ/AMEX for 3-year net income growth streaks, ROE > 8%, D/E < 2.0. Result: 11.55% CAGR vs 7.85% SPY (+3.70%), Sharpe 0.574, max drawdown -24.4%, down capture 60.8%. 25 years, 0 cash periods, 27 avg stocks. Full backtest data.

We screened every US stock (NYSE, NASDAQ, AMEX) for one thing: net income that grew every year for three consecutive years. That's the signal. Pair it with ROE above 8% and debt-to-equity below 2.0, and you get a portfolio that holds companies whose earnings power compounds year after year.
Contents
- Method
- The Signal
- The Screen (SQL)
- What We Found
- 25 years. Consistent alpha. Meaningful downside protection.
- Annual returns (July-to-July)
- 2000-2009: Where the strategy built its edge
- 2003: The standout recovery year
- 2021: The clear failure mode
- 2022-2024: Recovery
- The regime pattern
- Backtest Methodology
- Limitations
- Takeaway
- Part of a Series
- Run This Screen Yourself
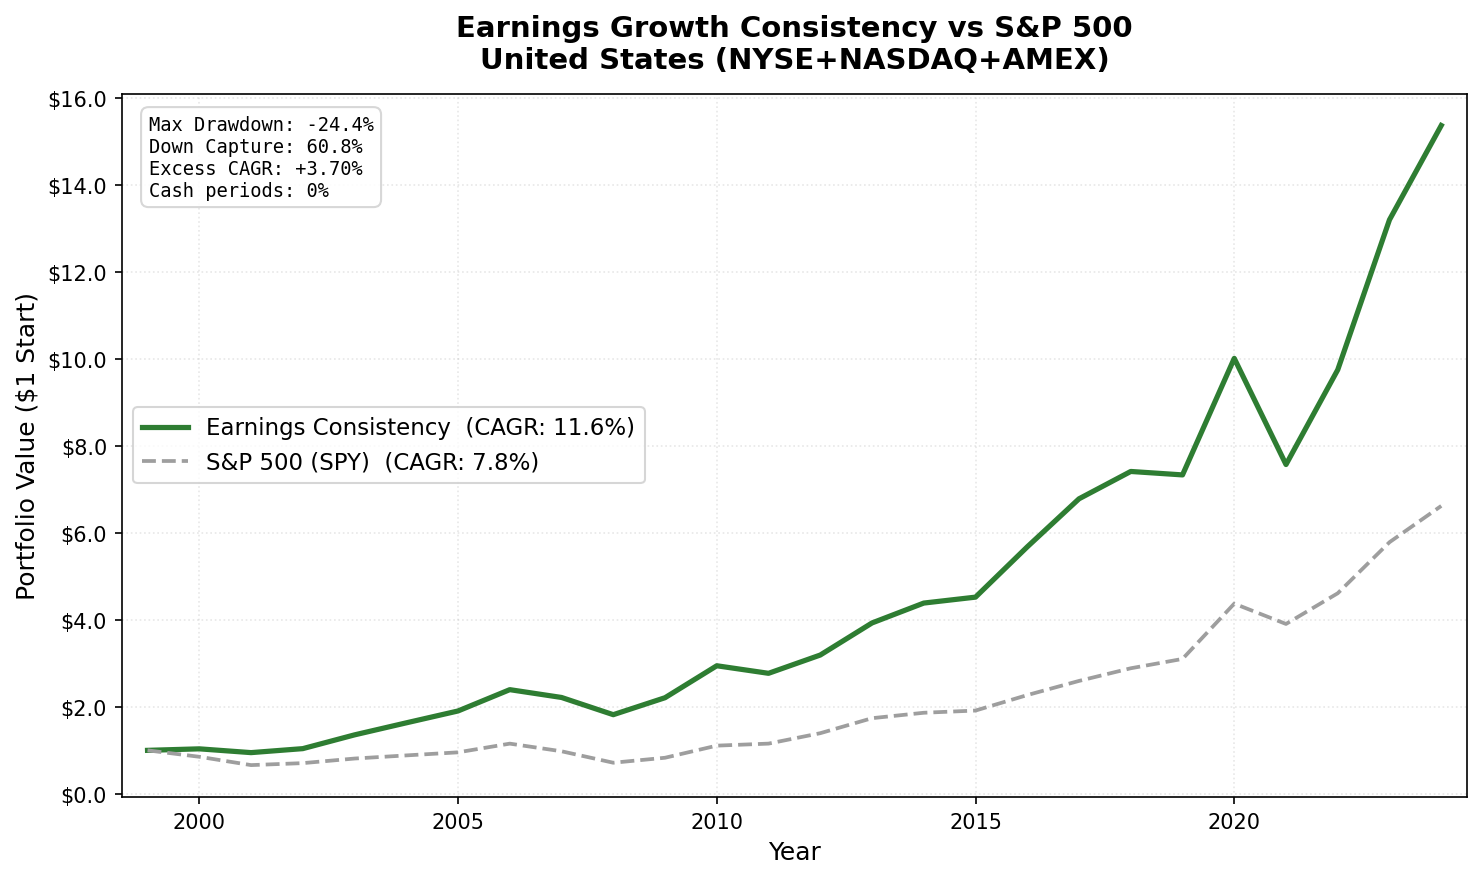
The result over 25 years: 11.55% CAGR vs 7.85% for SPY. Down capture of 60.8%, meaning the portfolio absorbed about 61 cents of loss for every dollar SPY dropped. Max drawdown of -24.4% vs SPY's -38.0%.
Data: FMP financial data warehouse, 2000–2025. Updated June 2026.
Method
Data source: Ceta Research (FMP financial data warehouse) Universe: NYSE, NASDAQ, AMEX, market cap > $1B USD Period: 2000-2025 (25 years, 25 annual periods) Rebalancing: Annual (July), equal weight, top 30 by ROE Benchmark: S&P 500 Total Return (SPY) Execution: Next-day close (MOC), with entry price being the first available close after the rebalance signal date Cash rule: Hold cash if fewer than 10 stocks qualify Data lag: 45-day point-in-time lag on financial statements (prevents look-ahead bias)
Annual returns are measured July-to-July. The year label marks the start of each 12-month holding period.
The Signal
One core condition: net income must have grown year-over-year in each of the last three fiscal years. Four data points required. All four must show positive net income.
y1 (most recent) > y2 > y3 > y4, and y4 > 0
Two quality filters layered on top:
- ROE > 8%: Screens for capital efficiency. Companies that grow earnings but generate poor returns on equity are excluded.
- D/E < 2.0: A liberal leverage cap. The earnings consistency filter does most of the quality work. The debt filter removes financial distress cases.
Portfolio construction: top 30 by ROE descending, equal weight. The ROE ranking selects the highest-quality subset of the passing universe.
The Screen (SQL)
Run this on current data to see today's qualifying US stocks:
WITH
fy_income AS (
    SELECT symbol, netIncome, dateEpoch,
        ROW_NUMBER() OVER (PARTITION BY symbol ORDER BY dateEpoch DESC) AS rn
    FROM income_statement
    WHERE period = 'FY'
      AND netIncome IS NOT NULL
      AND symbol IN (SELECT DISTINCT symbol FROM profile WHERE exchange IN ('NYSE', 'NASDAQ', 'AMEX'))
),
streak AS (
    SELECT y1.symbol
    FROM fy_income y1
    JOIN fy_income y2 ON y1.symbol = y2.symbol AND y2.rn = 2
    JOIN fy_income y3 ON y1.symbol = y3.symbol AND y3.rn = 3
    JOIN fy_income y4 ON y1.symbol = y4.symbol AND y4.rn = 4
    WHERE y1.rn = 1
      AND y1.netIncome > y2.netIncome
      AND y2.netIncome > y3.netIncome
      AND y3.netIncome > y4.netIncome
      AND y4.netIncome > 0
)
SELECT
    s.symbol,
    p.companyName,
    p.exchange,
    ROUND(k.returnOnEquityTTM * 100, 1) AS roe_pct,
    ROUND(f.debtToEquityRatioTTM, 2)    AS debt_to_equity,
    ROUND(k.marketCap / 1e9, 2)         AS market_cap_b
FROM streak s
JOIN key_metrics_ttm k ON s.symbol = k.symbol
JOIN financial_ratios_ttm f ON s.symbol = f.symbol
JOIN profile p ON s.symbol = p.symbol
WHERE k.returnOnEquityTTM > 0.08
  AND f.debtToEquityRatioTTM >= 0
  AND f.debtToEquityRatioTTM < 2.0
  AND k.marketCap > 1000000000
  AND p.exchange IN ('NYSE', 'NASDAQ', 'AMEX')
QUALIFY ROW_NUMBER() OVER (PARTITION BY s.symbol ORDER BY k.returnOnEquityTTM DESC) = 1
ORDER BY k.returnOnEquityTTM DESC
LIMIT 30
Run this query on Ceta Research
What We Found

25 years. Consistent alpha. Meaningful downside protection.
| Metric | Earnings Consistency | S&P 500 (SPY) |
|---|---|---|
| CAGR | 11.55% | 7.85% |
| Sharpe Ratio | 0.574 | 0.352 |
| Max Drawdown | -24.4% | -38.0% |
| Down Capture | 60.8% | 100% |
| Up Capture | 117.5% | 100% |
| Win Rate (annual vs SPY) | 68% | - |
| Avg Stocks per Period | 27.0 | - |
| Cash Periods | 0 of 25 | - |
The strategy was fully invested every single year. 27.0 stocks on average. Win rate of 68% means it outperformed SPY in 17 of 25 annual periods, and when it underperformed, the misses were generally smaller than the wins.
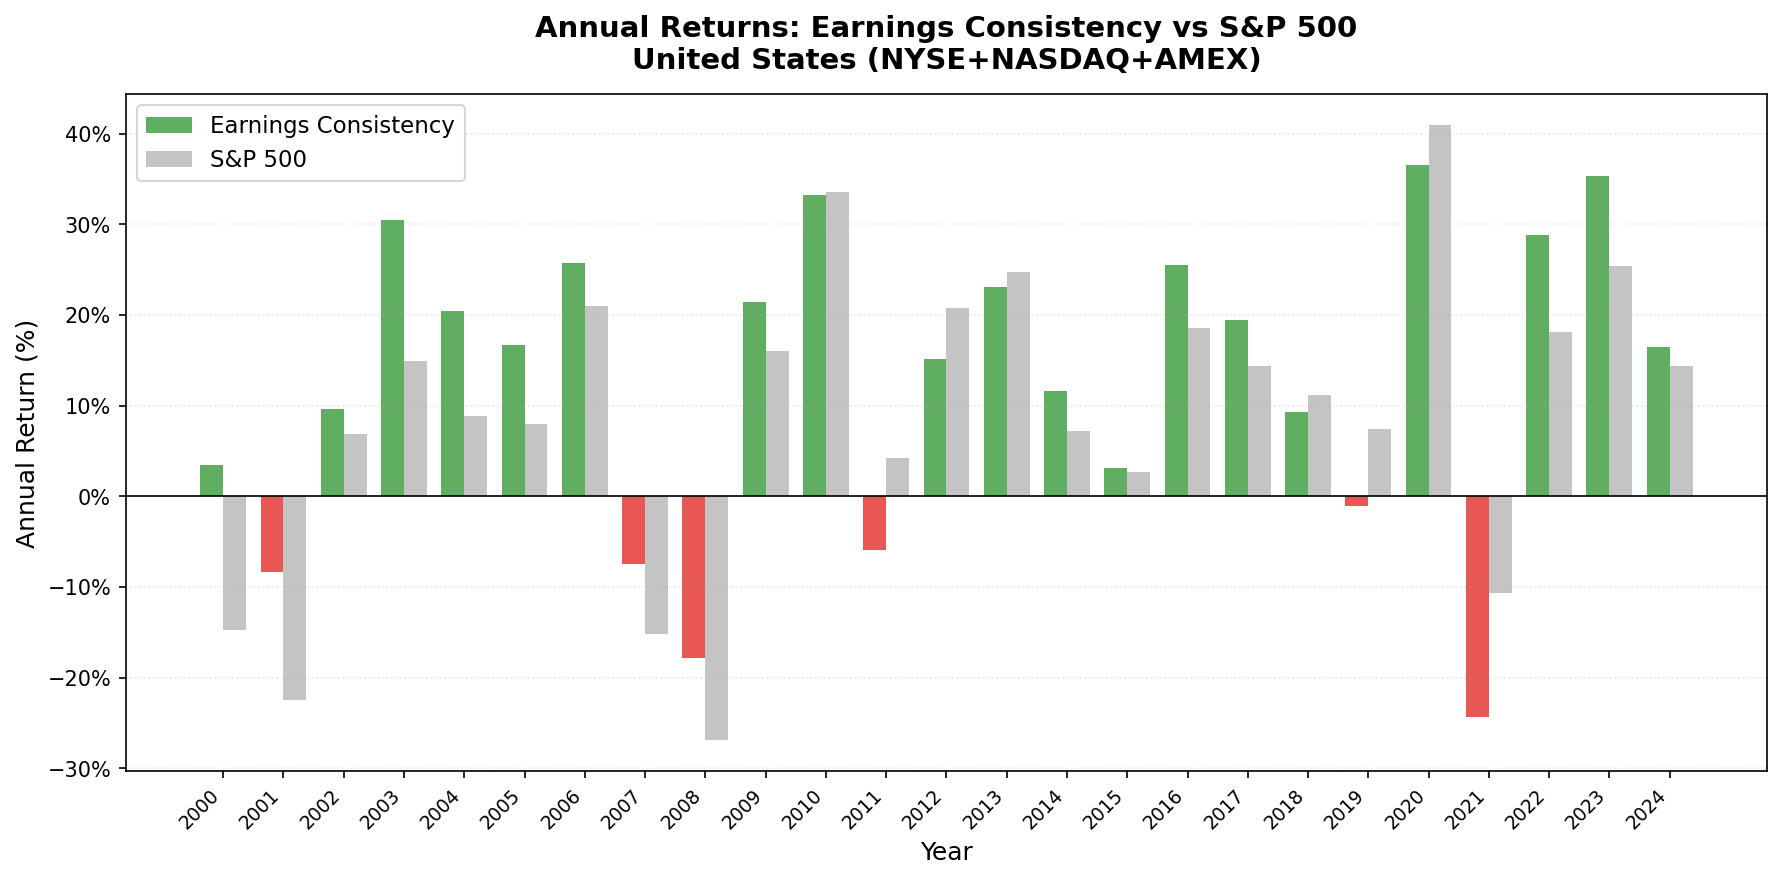
Annual returns (July-to-July)
| Year | Portfolio | SPY | Excess |
|---|---|---|---|
| 2000 | +3.5% | -14.8% | +18.2% |
| 2001 | -8.4% | -22.4% | +14.1% |
| 2002 | +9.7% | +6.9% | +2.8% |
| 2003 | +30.4% | +14.9% | +15.5% |
| 2004 | +20.4% | +8.9% | +11.5% |
| 2005 | +16.7% | +8.0% | +8.7% |
| 2006 | +25.7% | +20.9% | +4.8% |
| 2007 | -7.5% | -15.2% | +7.7% |
| 2008 | -17.9% | -26.9% | +9.0% |
| 2009 | +21.4% | +16.0% | +5.5% |
| 2010 | +33.2% | +33.5% | -0.3% |
| 2011 | -5.9% | +4.2% | -10.1% |
| 2012 | +15.2% | +20.7% | -5.6% |
| 2013 | +23.1% | +24.7% | -1.6% |
| 2014 | +11.6% | +7.2% | +4.5% |
| 2015 | +3.1% | +2.7% | +0.4% |
| 2016 | +25.6% | +18.6% | +7.0% |
| 2017 | +19.4% | +14.3% | +5.1% |
| 2018 | +9.3% | +11.2% | -1.9% |
| 2019 | -1.1% | +7.4% | -8.5% |
| 2020 | +36.5% | +41.0% | -4.4% |
| 2021 | -24.4% | -10.7% | -13.7% |
| 2022 | +28.8% | +18.1% | +10.7% |
| 2023 | +35.4% | +25.4% | +9.9% |
| 2024 | +16.4% | +14.4% | +2.0% |
2000-2009: Where the strategy built its edge
The first decade set the character. The S&P 500 went through the dot-com bust (2000-2002) and the financial crisis (2008-2009). The earnings consistency portfolio outperformed in all 10 years from 2000 to 2009. Ten consecutive years of positive excess returns.
The mechanism is straightforward. Companies that grew net income three years in a row going into 2000 were profitable, cash-generating businesses with proven earning power. The dot-com companies with escalating losses and the telecom companies with debt-financed growth didn't pass the screen. What remained was a portfolio of businesses that had already demonstrated they could grow earnings through normal economic cycles.
2000: +3.5% vs -14.8%. 2001: -8.4% vs -22.4%. 2008: -17.9% vs -26.9%. The protection wasn't perfect, but it was consistent.
2003: The standout recovery year
The portfolio returned +30.4% in 2003, vs SPY +14.9%, a 15.5-point excess. After the dot-com crash compressed earnings across the market, companies that had maintained consistent earnings trajectories were best positioned to recover quickly. Those companies entered 2003 with intact balance sheets and operational habits. They didn't need restructuring. They just needed the market to normalize.
That's the embedded logic of an earnings consistency screen. You're selecting for companies with structural earnings power, not cyclical momentum. When normalcy returns after a crisis, structural earners recover faster.
2021: The clear failure mode
The worst relative year was 2021 (July 2021 to July 2022): portfolio -24.4% vs SPY -10.7%. A 14-point gap going the wrong way.
The rate hike cycle hit this portfolio in the same way it hits most quality-growth strategies. The equal-weight portfolio of 27 stocks doesn't hold Nvidia, Apple, and Microsoft at index weight. When those companies drove most of SPY's reported outperformance in early 2022 (before their own corrections), the equal-weight earnings-quality portfolio couldn't track them.
2022-2024: Recovery
The three years following the worst relative performance were all positive. 2022 returned +28.8% vs SPY +18.1%. 2023 returned +35.4% vs SPY +25.4%. 2024 returned +16.4% vs SPY +14.4%. When mega-cap momentum faded, the earnings-quality portfolio recovered. Consistent earners don't depend on rate-sensitive multiple expansion. They earn their returns through actual profit growth.
The regime pattern
The strategy works best in value-favorable regimes and struggles when growth stocks dominate. Outperformed in: 2000-2009, 2014-2017, 2022-2024. Underperformed in: 2010-2013, 2018-2021.
The growth-dominated period of 2018-2021 produced the most persistent stretch of underperformance. That's a structural trade-off. The earnings consistency filter selects profitable, quality businesses, not hypergrowth companies still burning cash to build market share. Those two categories perform very differently across cycles.
Backtest Methodology
| Parameter | Choice |
|---|---|
| Universe | NYSE + NASDAQ + AMEX, Market Cap > $1B USD |
| Signal | 3-year net income growth streak, ROE > 8%, D/E < 2.0 |
| Portfolio | Top 30 by ROE, equal weight |
| Rebalancing | Annual (July) |
| Execution | Next-day close (MOC) |
| Cash rule | Hold cash if < 10 qualify |
| Benchmark | S&P 500 Total Return (SPY) |
| Period | 2000-2025 (25 years, 25 annual periods) |
| Data lag | Point-in-time, 45-day lag for financial statements |
Limitations
Concentrated portfolio. 27.0 stocks on average is a concentrated equal-weight portfolio. Individual position moves matter. A single company reporting unexpected earnings decline doesn't just fail the next screen. It can contribute meaningfully to the annual return in the current period.
Regime sensitivity. The strategy underperforms during growth-dominated markets, particularly when a small number of high-multiple companies drive index returns. This is a structural feature of a quality-earnings screen, not a bug in the methodology.
Look-back window. Requiring three consecutive years of growth creates selection bias toward mature businesses. Companies in the early phase of rapid earnings growth, where earnings might be lumpy or volatile, are excluded even if their fundamental trajectory is strong.
Equal weighting. The portfolio doesn't hold SPY's mega-cap weight in Apple, Microsoft, or Nvidia. Equal weighting is a deliberate choice for capturing the factor signal, but it creates structural divergence from the index in years when a handful of mega-caps dominate returns.
Survivorship. Exchange membership uses current company profiles, not historical. Companies that were delisted during the backtest period may not be captured, causing some upward bias in reported returns.
Takeaway
This strategy does one thing: it finds companies whose earnings have grown every year for three years and holds the most profitable subset. Over 25 years, that produced 11.55% CAGR vs 7.85% for SPY, with a max drawdown of -24.4% vs -38.0% and down capture of 60.8%.
The alpha is real, and the downside protection is real. The cost is regime sensitivity: in years when the market rewards momentum and growth-at-any-price, this portfolio lags. In years when earnings quality and balance sheet discipline matter, it leads by a wide margin.
The 68% win rate means you outperformed in roughly two out of every three years. For an annual-rebalance strategy running 27 equal-weight stocks, that's a strong systematic signal.
Part of a Series
This post is part of our Earnings Growth Consistency global exchange comparison. We ran the same strategy across 17 exchanges worldwide:
- Earnings Growth Consistency on Canadian Stocks (TSX): 11.34% CAGR, -31.7% down capture, best Sharpe of all 17 exchanges (0.611)
- Earnings Growth Consistency on UK Stocks (LSE): 12.35% CAGR, -22.0% max drawdown, +11.12% vs FTSE 100
- Earnings Growth Consistency on Indian Stocks (NSE): 10.04% CAGR, -2.02% vs Sensex (underperforms local market)
- Earnings Growth Consistency on German Stocks (XETRA): 8.59% CAGR, +3.55% vs DAX
- Earnings Growth Consistency: Global Comparison (17 Exchanges): the geographic split story
Run This Screen Yourself
The SQL above is runnable directly on Ceta Research. The full backtest code (Python + DuckDB) is on GitHub.
Data: Ceta Research, FMP financial data warehouse. Universe: NYSE + NASDAQ + AMEX. Annual rebalance (July), equal weight (top 30 by ROE), 2000-2025.
Past performance does not guarantee future results. This is educational content, not investment advice.


