
Earnings Surprise Drift in the UK: A Modest Beat-Side Signal
UK earnings drift is a beat-side signal vs the FTSE 100. Biggest beats produce +1.18% CAR at T+63, or +1.38% net of baseline. The miss side does almost nothing. Q5-Q1 spread: +1.59%.

UK earnings drift is a beat-side story once you enter at a realistic price and measure against the local index. Biggest beats on the LSE produce +1.18% cumulative abnormal return at T+63 versus the FTSE 100. The miss side does almost nothing: worst misses land at -0.41%, barely different from the near-consensus baseline. The Q5-Q1 spread is +1.59%, and after stripping the baseline, +1.38% of that comes from the beat side and only -0.21% from the miss side. This flips the picture an earlier same-day study using a US-listed proxy suggested, where the misses appeared to lead.
Contents
- Method
- The Strategy
- What We Found
- Positive vs Negative Surprise Drift
- Quintile Analysis at T+63
- UK vs US
- When It Works and When It Struggles
- Run It Yourself
- Limitations
- Part of a Series
- References
Data: FMP financial data warehouse, 2000–2025. Updated July 2026.
Method
| Parameter | Details |
|---|---|
| Data source | FMP earnings_surprises + stock_eod (Ceta Research warehouse) |
| Universe | LSE, market cap threshold applied per exchange |
| Period | 2000–2025 (26 years) |
| Events | 12,246 total (deduplicated per symbol/date) |
| Benchmark | FTSE 100 (^FTSE, local currency) |
| Execution | Enter at the next day's close (T+1), skipping the announcement day |
| Data quality | Oscillation rows removed, entry price > $1, single-window return capped at 200% |
| Surprise metric | (epsActual − epsEstimated) / ABS(epsEstimated) |
| Windows | T+1, T+5, T+21, T+63 trading days, measured from entry |
The Strategy
Post-Earnings Announcement Drift (PEAD) is one of the most replicated anomalies in finance. Ball and Brown (1968) first documented it, and Bernard and Thomas (1989) confirmed the drift persists for up to 60 trading days. The mechanism is behavioral: markets underreact to earnings news, then price it in over weeks.
We tested the LSE with a next-day entry and the local FTSE 100 benchmark. Both choices matter for the UK, because they change which side of the surprise carries the signal.
What We Found
Positive vs Negative Surprise Drift
| Direction | Events | T+1 | T+5 | T+21 | T+63 |
|---|---|---|---|---|---|
| Positive surprises | 5,432 | +0.12% | +0.20% | +1.17% | +0.73% |
| Negative surprises | 6,814 | -0.01% | -0.02% | +0.55% | -0.48% |
The UK beat rate is 44.4%, so more companies miss than beat. Positive surprises drift up, peaking around T+21 (+1.17%) before settling at +0.73% by T+63. The miss side is weak and late: negative surprises are flat or slightly positive through T+21, then drift to -0.48% by T+63.
Quintile Analysis at T+63
| Quintile | Description | Events | CAR at T+63 | t-stat |
|---|---|---|---|---|
| Q5 | Biggest beats | 2,424 | +1.18% | +3.2 |
| Q4 | Moderate beats | 2,413 | +0.65% | +2.1 |
| Q3 | Near-consensus | 2,481 | -0.20% | -0.7 |
| Q2 | Moderate misses | 2,444 | -0.80% | -2.5 |
| Q1 | Worst misses | 2,484 | -0.41% | -1.0 |
The near-consensus baseline (Q3) is close to zero at -0.20%, so the UK's raw levels are reasonably clean. The beat side carries the spread: Q5 minus Q3 is +1.38%, while Q1 minus Q3 is only -0.21%. The biggest beats produce a real, significant +1.18% drift. The worst misses are statistically indistinguishable from near-consensus.
There's a non-monotonic wrinkle in the miss tail: Q2 (-0.80%) is more negative than Q1 (-0.41%). With roughly 2,450 events per quintile, some of that is noise, but it reinforces that the miss side is not a clean signal here. The tradeable edge is the top quintile.
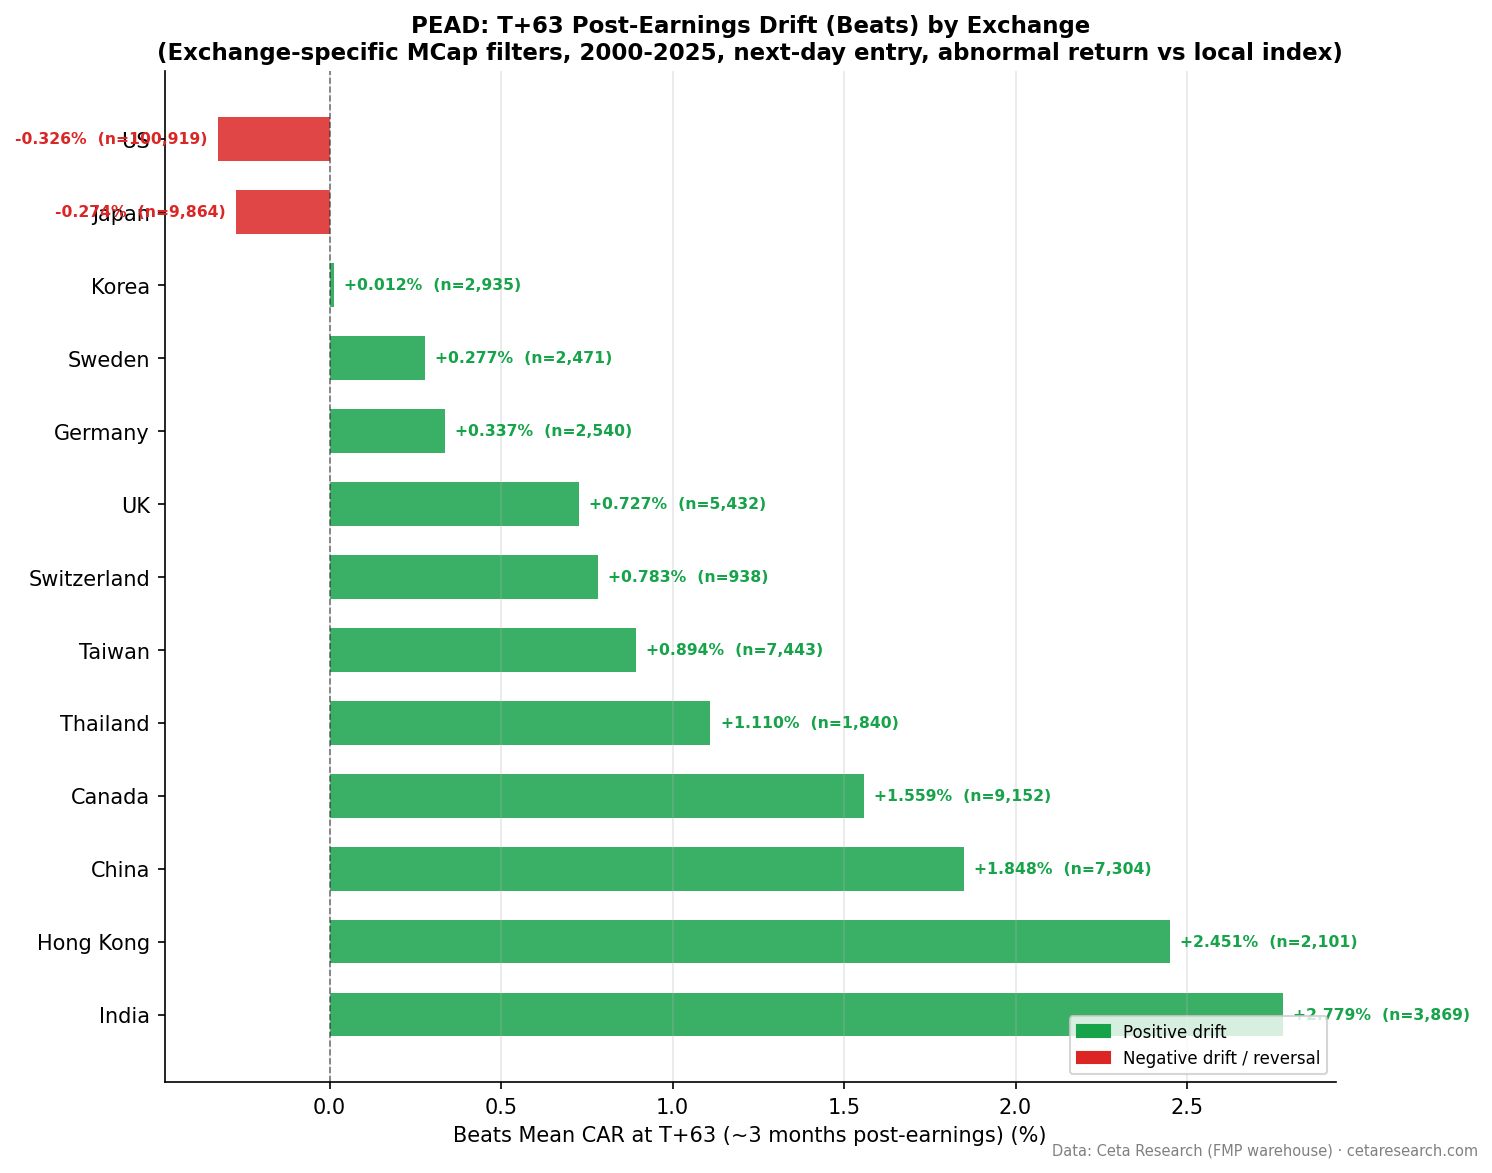
UK vs US
The UK and US have different beat rates (44.4% vs 62.6%), and they land on opposite sides of the surprise. In the US, the beat side is gone after a realistic entry and only the miss side survives. In the UK, it's the reverse: the beats carry the drift and the misses do little. A 44% beat rate means each UK beat is less expected and more informative, which is consistent with a real beat-side effect.
When It Works and When It Struggles
The UK signal is a long-side trade on the biggest beats. Q5 produces +1.18% over 63 days with a t-statistic of +3.2. Q4 adds +0.65%. Below that, the drift fades into the baseline.
The miss side is not worth shorting on this data. Q1 is not significant, and the pattern across Q1 and Q2 is noisy. UK reporting is part of the reason: many LSE companies report semi-annually, so the T+63 window can overlap with the next release for some names, which blurs the miss-side drift.
Borrow cost and availability would apply to any short implementation, and the miss-side numbers are too weak to clear them here anyway.
Run It Yourself
-- Recent earnings surprises on LSE
WITH deduped AS (
  SELECT
    es.symbol,
    es.date,
    es.epsActual,
    es.epsEstimated,
    (es.epsActual - es.epsEstimated) / NULLIF(ABS(es.epsEstimated), 0) AS std_surprise,
    ROW_NUMBER() OVER (PARTITION BY es.symbol, es.date ORDER BY es.lastUpdated DESC) AS rn
  FROM earnings_surprises es
  JOIN profile p ON es.symbol = p.symbol
  WHERE p.exchange = 'LSE'
    AND p.isActivelyTrading = true
    AND CAST(es.date AS DATE) >= CURRENT_DATE - INTERVAL '90 days'
    AND ABS(es.epsEstimated) > 0.01
)
SELECT
  symbol,
  date,
  epsActual,
  epsEstimated,
  ROUND(std_surprise * 100, 1) AS surprise_pct
FROM deduped
WHERE rn = 1
  AND ABS(std_surprise) > 0.10
ORDER BY date DESC, std_surprise DESC
LIMIT 50
Run this query on Ceta Research →
Limitations
12,246 events is a solid sample, with roughly 2,450 events per quintile. That's adequate but smaller than the US or Japan, so the individual quintile figures carry wider confidence intervals, which shows up in the noisy miss tail.
UK reporting calendars are less standardized than US quarterly reporting. A portion of LSE companies report on a six-month cycle, so the T+63 window can overlap with subsequent earnings for some names, amplifying or dampening the measured drift.
Raw CAR includes a universe-versus-index baseline. Here Q3 is close to zero, so the effect is small, but we still report the Q5 minus Q3 and Q1 minus Q3 decomposition to keep the attribution honest.
Part of a Series
- PEAD Across 13 Global Exchanges: The Drift Shrinks Everywhere
- Earnings Surprise Drift on US Stocks: Most of It Vanishes If You Wait One Day
References
- Ball, R. & Brown, P. (1968). An empirical evaluation of accounting income numbers. Journal of Accounting Research.
- Bernard, V. & Thomas, J. (1989). Post-earnings-announcement drift: Delayed price response or risk premium? Journal of Accounting Research.
- Foster, G., Olsen, C. & Shevlin, T. (1984). Earnings releases, anomalies, and the behavior of security returns. The Accounting Review.
Data: Ceta Research, FMP financial data warehouse. Not investment advice.


