
ETF Anti-Crowding on 18 Exchanges: Signal Strength Matters More Than the Signal
We ran the same anti-crowding screen on 18 stock exchanges. Only 2 showed positive excess returns, both with diluted signals. Among exchanges where the portfolio genuinely held under-owned stocks, all 7 underperformed.

We ran the same anti-crowding screen on 18 stock exchanges worldwide. Buy the 30 least ETF-owned quality stocks, hold for a year, repeat. Same filters everywhere: ROE > 10%, P/E between 0 and 40, market cap above a local threshold.
Contents
- Method
- The Full Results
- What Separates the Winners from the Losers
- The Signal Strength Paradox
- Market Structure Differences
- Risk Characteristics
- The Screen
- Excluded Exchanges
- Part of a Series
- Takeaway
- References
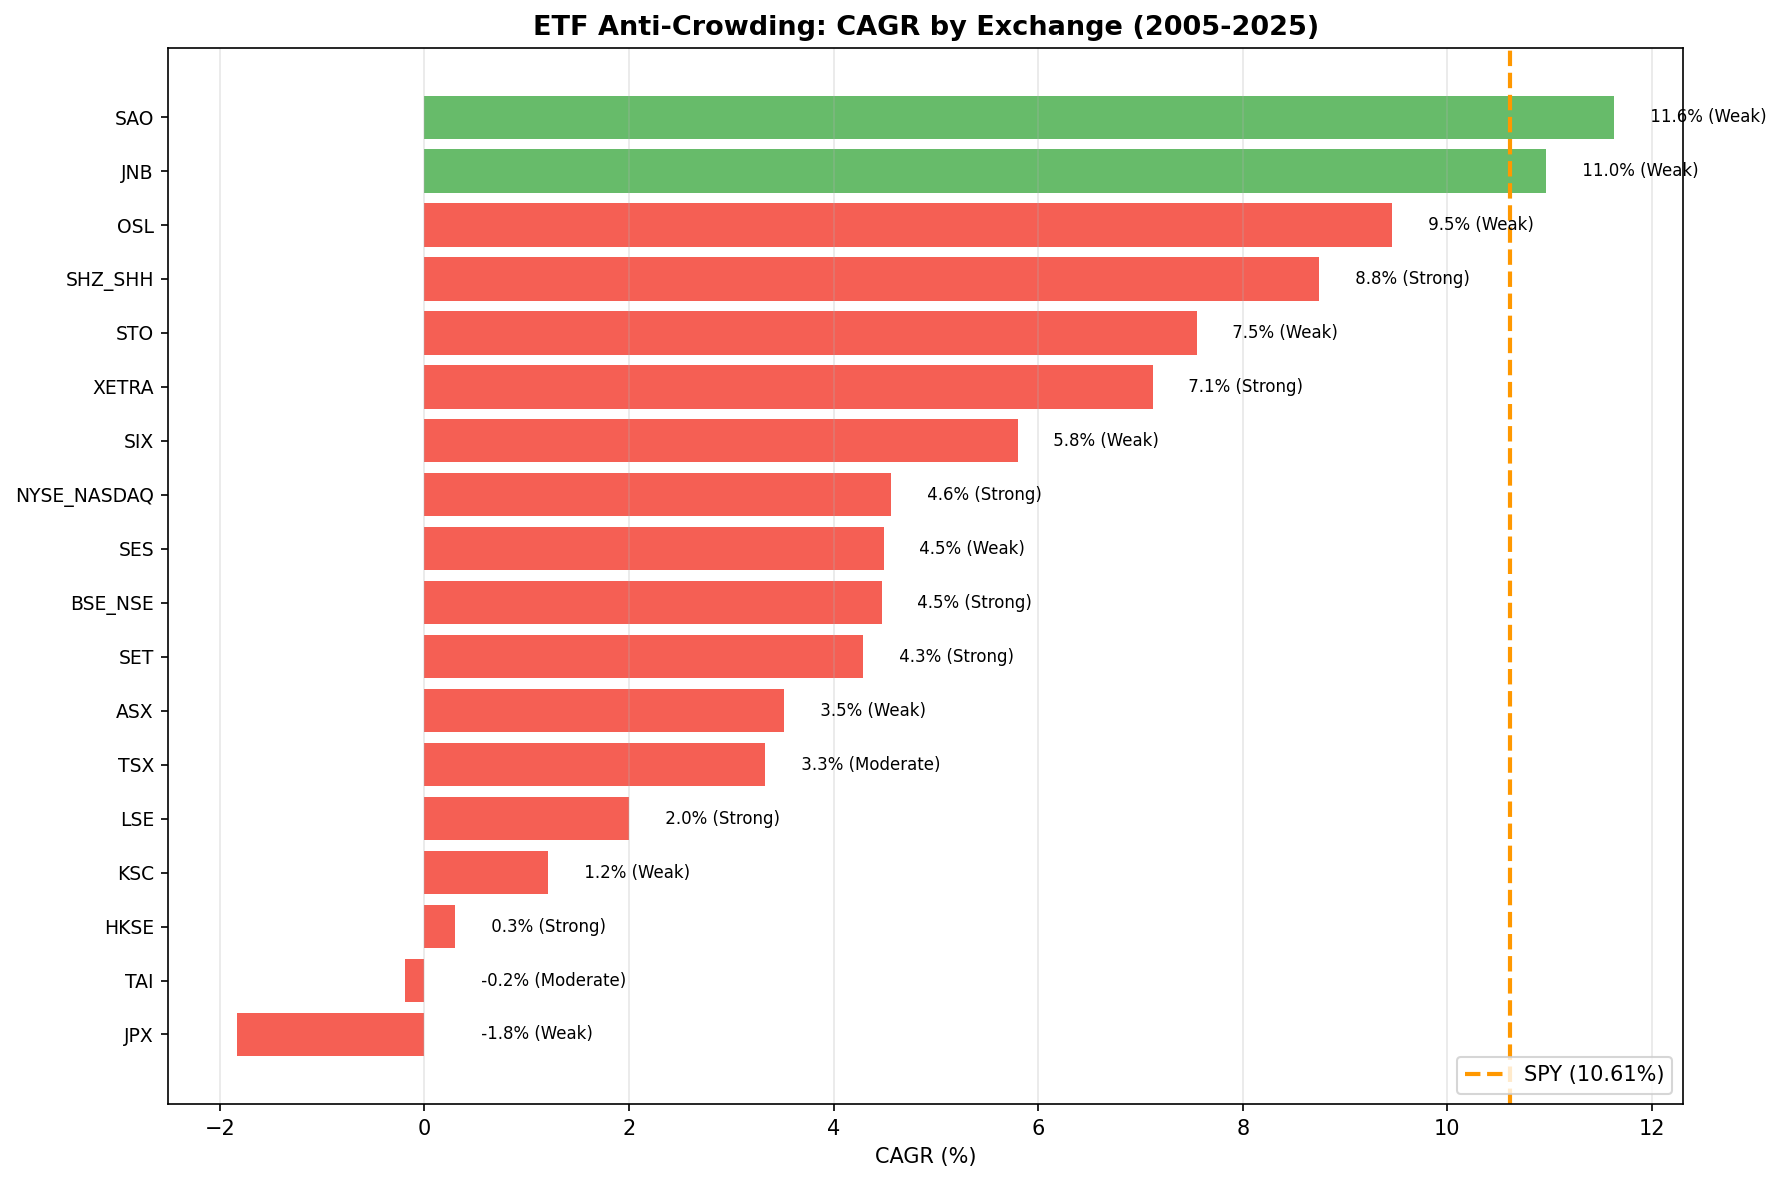
8 of 18 exchanges showed positive excess returns when benchmarked against their local stock index. The top performers (Norway +3.74%, China +2.68%, Thailand +2.49%) are a mix of strong and weak signal exchanges. But the strongest-signal markets with deep ETF ecosystems (US, India, Hong Kong) still underperform their benchmarks by 5-7%. The signal strength paradox holds where it matters most.
Data: FMP financial data warehouse, 2000-2025. Updated April 2026.
Method
Data source: Ceta Research (FMP financial data warehouse) Period: July 2005 to July 2025 (20 annual periods) Rebalancing: Annual (July, 45-day lag for FY filings) Execution: Next-day close (market-on-close) Benchmark: Each exchange benchmarked against its local stock index rather than SPY, eliminating currency effects from the comparison Transaction costs: Size-tiered (0.1-0.5% one-way based on market cap)
Signal: Among stocks held by at least 5 ETFs, apply quality filters, select the 30 with lowest ETF count. Equal weight. Cash if fewer than 10 qualify.
Market cap thresholds: Exchange-specific in local currency. US: $1B, India: Rs 20B (~$240M), Japan: JPY 100B (~$667M), Germany: EUR 500M (~$545M). Full mapping in cli_utils.py.
Data caveat: ETF holdings are a current snapshot. Crowding classifications are static across all periods (look-ahead bias). Quality filters use point-in-time FY data.
The Full Results
| Exchange | CAGR | Excess vs Local | Sharpe | Benchmark | AvgETF | Signal |
|---|---|---|---|---|---|---|
| Norway | 14.94% | +3.74% | 0.989 | Oslo All Share | 426.1 | Weak |
| China | 8.83% | +2.68% | 0.163 | SSE Composite | 9.2 | Strong |
| Thailand | 5.08% | +2.49% | 0.148 | SET Index | 17.4 | Strong |
| Switzerland | 4.75% | +1.47% | 0.223 | SMI | 85.6 | Weak |
| Brazil | 10.46% | +1.43% | -0.002 | Bovespa | 70.1 | Weak |
| Sweden | 6.91% | +1.21% | 0.231 | OMX Stockholm 30 | 139.6 | Weak |
| Singapore | 4.10% | +1.10% | 0.079 | STI | 172.3 | Weak |
| Australia | 4.58% | +1.03% | 0.072 | ASX 200 | 115.5 | Weak |
| Canada | 4.35% | -0.75% | 0.094 | TSX Composite | 32.9 | Moderate |
| UK | 1.90% | -0.77% | -0.082 | FTSE 100 | 8.7 | Strong |
| S. Africa | 9.50% | -1.10% | 0.026 | SPY* | 245.0 | Weak |
| Germany | 7.10% | -1.43% | 0.281 | DAX | 24.0 | Strong |
| Hong Kong | 0.65% | -2.07% | -0.111 | Hang Seng | 19.7 | Strong |
| Korea | 1.57% | -4.09% | -0.072 | KOSPI | 113.9 | Weak |
| US | 5.48% | -5.11% | 0.181 | SPY | 6.8 | Strong |
| India | 6.39% | -6.58% | -0.004 | Sensex | 38.8 | Strong |
| Taiwan | -0.63% | -7.25% | -0.115 | TAIEX | 69.7 | Moderate |
| Japan | -1.35% | -7.68% | -0.073 | Nikkei 225 | 163.6 | Weak |
*S. Africa uses SPY as benchmark (no local index data available in FMP).
Signal strength = average ETF count in the anti-crowding portfolio. Strong (< 30) means the portfolio genuinely holds under-owned stocks. Weak (> 80) means the quality + market cap filters eliminate most low-count stocks, leaving only moderately-crowded names.
What Separates the Winners from the Losers
Most of the positive-excess exchanges have weak signals. Norway (+3.74%, avg 426 ETFs), Switzerland (+1.47%, avg 86 ETFs), Brazil (+1.43%, avg 70 ETFs), Sweden (+1.21%, avg 140 ETFs), Singapore (+1.10%, avg 172 ETFs), and Australia (+1.03%, avg 116 ETFs) aren't testing whether under-owned stocks outperform. They're selecting the marginally less crowded among broadly ETF-owned names on smaller exchanges.
The positive excess on these exchanges likely reflects other characteristics correlated with being "slightly less crowded," such as domestic-focused business models or sectors less represented in global ETFs. It doesn't validate the anti-crowding hypothesis.
The two exceptions are China and Thailand. Both have strong signals (avg 9.2 and 17.4 ETFs respectively) and positive excess returns (+2.68% and +2.49%). These portfolios genuinely hold under-owned stocks, and they outperform. Both have developing domestic ETF ecosystems, which may limit the passive distortion mechanism that works against under-owned stocks in mature markets.
Among the remaining strong-signal exchanges, underperformance dominates:
| Strong Signal | CAGR | Excess vs Local | AvgETF |
|---|---|---|---|
| China | 8.83% | +2.68% | 9.2 |
| Thailand | 5.08% | +2.49% | 17.4 |
| UK | 1.90% | -0.77% | 8.7 |
| Germany | 7.10% | -1.43% | 24.0 |
| Hong Kong | 0.65% | -2.07% | 19.7 |
| US | 5.48% | -5.11% | 6.8 |
| India | 6.39% | -6.58% | 38.8 |
Five of seven strong-signal exchanges underperform their local benchmark. The three deepest ETF markets (US at -5.11%, India at -6.58%, Hong Kong at -2.07%) show the worst results. The pattern is clear: where passive investing is most entrenched, avoiding ETF-held stocks costs the most.
The Signal Strength Paradox
The relationship between signal strength and performance still skews the wrong way. Among weak-signal exchanges (diluted portfolios with 80+ ETFs), 6 of 8 show positive excess returns. Among strong-signal exchanges (genuinely under-owned portfolios), only 2 of 7 outperform.
China and Thailand break the pattern, but both are developing ETF markets where the passive ownership effect is weaker. In mature markets with deep ETF penetration (US, UK, Hong Kong), the anti-crowding signal has negative predictive power. Stocks that the passive industry ignores tend to be ignored for reasons that the quality filters (ROE > 10%, P/E 0-40, market cap threshold) don't fully offset: less analyst coverage, lower liquidity, weaker institutional sponsorship.
The paradox is weaker than it first appeared when all exchanges were benchmarked against SPY. Local benchmarks strip out the currency drag that inflated underperformance for non-US markets. But the core finding holds: where the signal works as intended (deep markets, genuinely under-owned stocks), the strategy's performance is worst.
Market Structure Differences
Developed vs developing ETF markets. China (AvgETF 9.2) and Thailand (17.4) have developing domestic ETF ecosystems and are the only strong-signal winners. India (38.8) is also developing but has deeper passive penetration, and it underperforms by -6.58%. The US (6.8) has the most mature ETF market and underperforms by -5.11%. The threshold where passive ownership shifts from neutral to harmful for under-owned stocks sits somewhere between China's level and India's.
Exchange universe depth. Norway has a shallow pool of ETF-held stocks. After quality + market cap filters, the 30 "least crowded" still average 426 ETFs each. Brazil's portfolio averages 70 ETFs. Deeper exchanges (US, Japan, UK) allow the signal to work as intended, but results at the bottom of the table cluster there.
Local benchmarks and currency. Using local stock indices instead of SPY eliminates the currency effect that previously distorted non-US results. Under the old SPY benchmark, only 2 of 18 exchanges showed positive excess. With local benchmarks, 8 of 18 are positive. Much of the prior "underperformance" on exchanges like Norway and Switzerland was the US dollar strengthening, not the strategy failing. The local benchmark comparison isolates pure stock selection alpha from currency movements.
Risk Characteristics
The anti-crowding portfolio doesn't compensate for its lower returns with lower risk across strong-signal exchanges.
| Metric | Avg (Strong Signal) | Typical Local Index |
|---|---|---|
| Sharpe Ratio | -0.01 | ~0.4-0.6 |
Five of seven strong-signal exchanges have negative Sharpe ratios. China (0.163) and Thailand (0.148) are positive but still trail what a passive index fund delivers. The strategy takes on more volatility from concentrated portfolios of under-owned names without generating enough return to justify it.
The Screen
Adapt for any exchange by changing the exchange filter:
WITH crowding AS (
  SELECT
    eh.asset AS symbol,
    COUNT(DISTINCT eh.symbol) AS etf_count
  FROM etf_holder eh
  JOIN profile p ON eh.asset = p.symbol
  WHERE p.exchange IN ('NYSE', 'NASDAQ')  -- Change this
  GROUP BY eh.asset
  HAVING COUNT(DISTINCT eh.symbol) >= 5
)
SELECT
  c.symbol,
  c.etf_count,
  ROUND(k.returnOnEquityTTM * 100, 1) AS roe_pct,
  ROUND(r.priceToEarningsRatioTTM, 1) AS pe_ratio,
  ROUND(k.marketCap / 1e9, 1) AS market_cap_bn
FROM crowding c
JOIN key_metrics_ttm k ON c.symbol = k.symbol
JOIN financial_ratios_ttm r ON c.symbol = r.symbol
WHERE k.returnOnEquityTTM > 0.10
  AND r.priceToEarningsRatioTTM > 0
  AND r.priceToEarningsRatioTTM < 40
  AND k.marketCap > 1000000000  -- Adjust per exchange
ORDER BY c.etf_count ASC
LIMIT 30
Run this screen on Ceta Research
Excluded Exchanges
| Exchange | Reason |
|---|---|
| AMEX | Only 2.8% of ETF-held stocks have FY financial data |
| SAU (Saudi Arabia) | No local index data available. CAGR 2.33%, -8.26% vs SPY |
All other exchanges with ETF holder data are included regardless of performance. Underperformance isn't a reason to exclude. Only data quality issues warrant exclusion.
Part of a Series
This is the global comparison post for the ETF Anti-Crowding strategy: - US: Does Buying Under-Owned Stocks Beat the Market? (flagship analysis) - India: Anti-Crowding on BSE and NSE - Germany: Anti-Crowding on XETRA - China: Anti-Crowding on A-Shares
Takeaway
The anti-crowding hypothesis is weaker than the raw numbers suggest, but not dead everywhere. With local benchmarks, 8 of 18 exchanges show positive excess returns. Most of those have diluted signals (weak signal exchanges where the "anti-crowding" portfolio is still heavily ETF-owned). The two genuine exceptions are China (+2.68%) and Thailand (+2.49%), both developing ETF markets.
Where it matters most, the strategy fails. The US (-5.11% vs SPY), India (-6.58% vs Sensex), and Hong Kong (-2.07% vs Hang Seng) are deep markets with mature ETF ecosystems and strong anti-crowding signals. All three underperform. The pattern holds across developed markets too: UK (-0.77%), Germany (-1.43%).
ETF flows create a persistent bid for the stocks they hold. Being excluded from that flow is a disadvantage in any market where passive investing is entrenched. The opportunity, if it exists, is limited to emerging ETF markets where passive distortion hasn't fully taken hold.
Data: Ceta Research (FMP financial data warehouse), July 2005 to July 2025. 18 exchanges tested. Each exchange benchmarked against its local stock index (except S. Africa, which uses SPY). ETF holdings are current snapshot data (look-ahead bias in crowding signal, point-in-time quality filters). Full methodology: backtests/METHODOLOGY.md. Code: backtests/etf-crowding.
References
- Ben-David, I., Franzoni, F. & Moussawi, R. (2018). "Do ETFs Increase Volatility?" Journal of Finance, 73(6).
- Israeli, D., Lee, C. & Sridharan, S. (2017). "Is There a Dark Side to Exchange Traded Funds?" Review of Accounting Studies, 22(3).
- Da, Z. & Shive, S. (2018). "Exchange Traded Funds and Asset Return Correlations." European Financial Review, 22(6).
Past performance does not guarantee future results. This is educational content, not investment advice.


