
Your 500-Stock ETF Is Really a 50-Stock Bet: Measuring Hidden ETF Concentration With SQL
The S&P 500 holds 500 stocks. The top 10 account for 39%+ of the portfolio. We measured the effective number of stocks in 2,000+ ETFs using the Herfindahl-Hirschman Index. SPY behaves like a 50-stock portfolio, not 500.

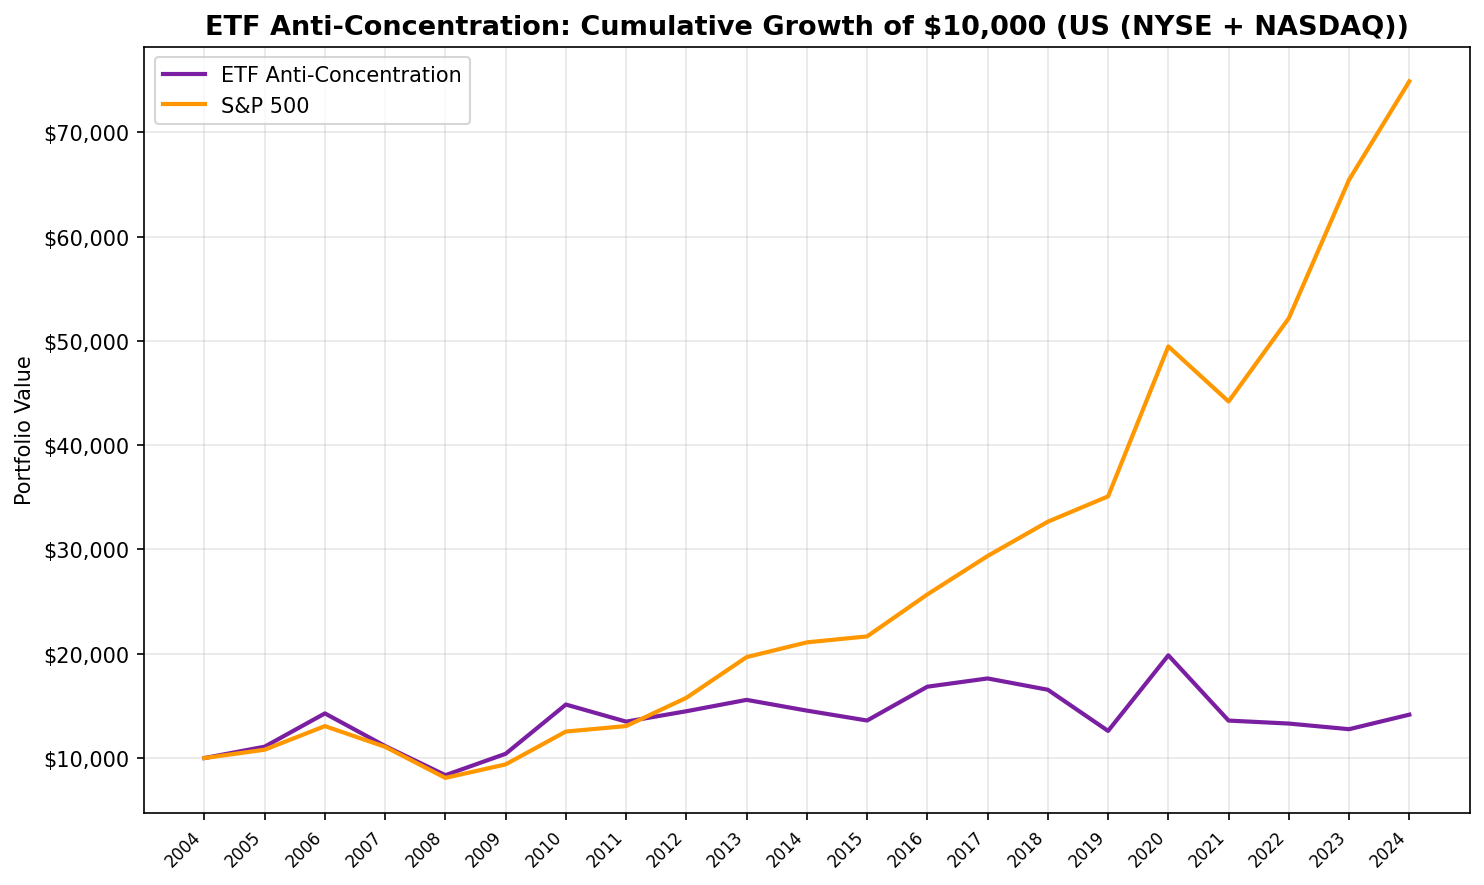
Stocks that ETFs barely weight should, in theory, be less distorted by passive money flows. Less index-driven buying pressure, fewer rebalancing artifacts, more room for fundamental value to surface. We tested this on US equities from 2005 to 2025 using next-day close execution. The strategy returned 1.75% annually vs 10.59% for the S&P 500. That's not a small miss. That's 20 years of underperformance with a negative Sharpe ratio and a 35% win rate against the benchmark.
Contents
- Method
- What We Found
- Summary Statistics
- Year-by-Year Performance
- Why the Signal Fails
- The Wurgler Feedback Loop Works in Reverse
- Low Weight Correlates With Low Quality (Despite Filters)
- The Academic Evidence Points the Other Way
- The SQL Screen
- Limitations
- Takeaway
- References
The hypothesis fails. Here's why, and what it tells us about how passive investing actually works.
Data: FMP financial data warehouse, 2000–2025. Updated March 2026.
Method
| Parameter | Value |
|---|---|
| Universe | NYSE, NASDAQ |
| Period | 2005-2025 (20 annual periods) |
| Rebalancing | Annual (July) |
| Signal | Bottom 30 stocks by average ETF weight percentage |
| Quality filters | ROE > 10%, P/E between 0 and 40, market cap > $1B |
| ETF minimum | Stock must appear in at least 5 ETFs |
| Positions | Up to 30, equal weight |
| Benchmark | S&P 500 (SPY) total return |
| Data source | Ceta Research (FMP financial data warehouse) |
What the signal measures: For every stock held by at least 5 ETFs, we compute its average weight across all those ETFs. Stocks ranked at the bottom have the lightest average weighting. The idea: these are institutionally recognized (they're in ETFs) but not heavily concentrated (low weight). Maybe the market prices them more efficiently because passive flows don't distort their prices as much.
Important distinction from ETF crowding: Our related etf-crowding strategy counts how many ETFs hold a stock. Concentration measures how heavily each ETF weights it. A stock could be in 200 ETFs (high crowding) but at 0.01% average weight (low concentration). These are different signals. Both fail.
What We Found
The strategy destroyed value in almost every environment.
1.75% CAGR over 20 years. An initial $100 grew to roughly $141. The same $100 in SPY grew to about $749. That's not a rounding error. It's a 5x gap in terminal wealth.
Negative Sharpe ratio (-0.011). The risk-free rate exceeded the strategy's return. You'd have been better off in Treasury bills for two decades.
35% win rate. The portfolio beat SPY in only 7 of 20 years. And most of those winning years share a pattern we'll get to shortly.
Higher drawdowns with worse recovery. Maximum drawdown was -41.48% vs SPY's -36.41%. Worse on the way down, and the recovery was far slower because the portfolio lacked the large-cap names that led post-crisis rallies.
Beta of 1.195, alpha of -10.51%. The portfolio carried more market risk than SPY while delivering substantially less return. The worst possible combination.
Summary Statistics
| Metric | Strategy | SPY | Difference |
|---|---|---|---|
| CAGR | 1.75% | 10.59% | -8.84% |
| Max Drawdown | -41.48% | -36.41% | -5.07% |
| Sharpe Ratio | -0.011 | 0.557 | -0.568 |
| Win Rate vs SPY | 35.0% | ||
| Beta | 1.195 | 1.000 | +0.195 |
| Alpha | -10.51% | ||
| Avg Stocks Held | 22.1 | ||
| Avg Weight in ETFs | 0.017% | ||
| Cash Periods | 0/20 |
Year-by-Year Performance
| Year | Strategy | SPY | Excess |
|---|---|---|---|
| 2005 | +10.9% | +8.0% | +2.9% |
| 2006 | +28.8% | +20.9% | +7.8% |
| 2007 | -21.9% | -15.2% | -6.7% |
| 2008 | -25.0% | -26.9% | +1.9% |
| 2009 | +24.5% | +16.0% | +8.6% |
| 2010 | +45.4% | +33.5% | +11.8% |
| 2011 | -10.8% | +4.2% | -15.0% |
| 2012 | +7.4% | +20.7% | -13.4% |
| 2013 | +7.5% | +24.7% | -17.2% |
| 2014 | -6.6% | +7.2% | -13.8% |
| 2015 | -6.5% | +2.7% | -9.2% |
| 2016 | +23.8% | +18.6% | +5.3% |
| 2017 | +4.7% | +14.3% | -9.6% |
| 2018 | -6.2% | +11.2% | -17.3% |
| 2019 | -23.9% | +7.4% | -31.3% |
| 2020 | +57.6% | +41.0% | +16.6% |
| 2021 | -31.5% | -10.7% | -20.8% |
| 2022 | -2.1% | +18.1% | -20.2% |
| 2023 | -4.1% | +25.4% | -29.5% |
| 2024 | +10.9% | +14.4% | -3.5% |
The pattern in the bolded years is hard to miss. The strategy's winning periods cluster around recovery years following sharp market dislocations. 2005-2006 captured a broad mid-cycle expansion. 2008-2010 was the financial crisis and recovery. 2016 had a post-election value rotation. 2020 was the post-COVID snap-back.
During sharp recoveries, smaller and cheaper stocks rally hardest. The lightly-weighted ETF stocks tend to be smaller-cap names within the quality filter. They benefit from the risk-on rotation. But in every other market regime, they underperform. Steadily, persistently, by large margins.
The five worst excess return years: 2019 (-31.3%), 2023 (-29.5%), 2021 (-20.8%), 2022 (-20.2%), and 2018 (-17.3%). These span both up and down markets. The strategy doesn't just lag in bull markets. It lags almost everywhere.
Why the Signal Fails
The Wurgler Feedback Loop Works in Reverse
Wurgler (2011) documented that cap-weighted indices create a self-reinforcing cycle. As a stock's price rises, its index weight increases, triggering more passive buying, which pushes the price higher. This is the mechanism that concentrates cap-weighted ETFs in their largest holdings.
The flip side is what our signal selects for. Stocks with the lowest average ETF weight are, by construction, stocks that passive flows have passed over. They didn't get the Wurgler tailwind. They're the companies where the feedback loop runs in the wrong direction, or never started at all.
Selecting for low ETF weight is, unintentionally, selecting for stocks that the largest pool of systematic capital in history has chosen not to concentrate in. That's not a value signal. It's a neglect signal. And neglect, it turns out, has a cost.
Low Weight Correlates With Low Quality (Despite Filters)
Our screen applies quality filters: ROE > 10%, P/E between 0 and 40, market cap above $1B. These should eliminate the obvious junk. They don't eliminate all of it.
The average ETF weight of our selected stocks is 0.017%. For context, even mid-cap names in the S&P 500 carry 0.1-0.3% weight. Stocks at 0.017% average weight are at the extreme tail of institutional positioning. They pass basic quality screens but still tend to be:
- Companies in structural decline (the quality metrics reflect the past, not the trajectory)
- Stocks with poor liquidity and wide spreads
- Names in out-of-favor sectors with limited analyst coverage
- Companies that quality screens approve but the market is actively repricing downward
The quality filters prevent the worst outcomes (we never went to cash in 20 years, and the max drawdown wasn't catastrophic). But they can't turn a structurally weak signal into a strong one.
The Academic Evidence Points the Other Way
Plyakha, Uppal, and Vilkov (2021) found that equal-weighted portfolios earned roughly 2% more annually than cap-weighted versions from 1964 to 2016. DeMiguel, Garlappi, and Uppal (2009) showed that naive 1/N equal weighting beat most optimization approaches out of sample.
These findings suggest that moving away from cap weighting can add value. But they don't support the specific signal of targeting low-concentration stocks. Equal weighting works because it systematically rebalances from winners to losers (a contrarian mechanism). Our concentration signal doesn't do that. It simply picks stocks that are lightly weighted and holds them for a year. There's no rebalancing bonus, no contrarian mechanism, no systematic way to capture the equal-weight premium.
The SQL Screen
Current screen for low-concentration quality stocks on US exchanges:
WITH concentration AS (
    SELECT
        eh.asset AS symbol,
        COUNT(DISTINCT eh.symbol) AS etf_count,
        ROUND(AVG(eh.weightPercentage), 4) AS avg_weight
    FROM etf_holder eh
    JOIN profile p ON eh.asset = p.symbol
    WHERE p.exchange IN ('NYSE', 'NASDAQ')
      AND eh.weightPercentage BETWEEN 0 AND 100
    GROUP BY eh.asset
    HAVING COUNT(DISTINCT eh.symbol) >= 5
),
quality AS (
    SELECT
        k.symbol,
        k.returnOnEquityTTM AS roe,
        f.priceToEarningsRatioTTM AS pe,
        k.marketCap AS market_cap,
        p.companyName,
        p.sector
    FROM key_metrics_ttm k
    JOIN financial_ratios_ttm f ON k.symbol = f.symbol
    JOIN profile p ON k.symbol = p.symbol
    WHERE p.exchange IN ('NYSE', 'NASDAQ')
      AND k.returnOnEquityTTM > 0.10
      AND f.priceToEarningsRatioTTM > 0
      AND f.priceToEarningsRatioTTM < 40
      AND k.marketCap > 1000000000
)
SELECT
    q.symbol,
    q.companyName,
    q.sector,
    ROUND(q.roe * 100, 1) AS roe_pct,
    ROUND(q.pe, 1) AS pe,
    ROUND(q.market_cap / 1e9, 2) AS mcap_b,
    c.etf_count,
    c.avg_weight AS avg_wt_pct
FROM quality q
JOIN concentration c ON q.symbol = c.symbol
ORDER BY c.avg_weight ASC
LIMIT 30
This query returns the 30 quality stocks with the lowest average ETF weight. The backtest shows this ranking doesn't predict outperformance. The screen is useful for understanding ETF positioning, not as a buy list.
Limitations
ETF holdings data is a current snapshot. The etf_holder table reflects today's ETF positions, not historical ones. We applied this snapshot backward across 20 years of price data. This introduces look-ahead bias: we're using current ETF weights to select stocks historically. A stock that's lightly weighted today may have been heavily weighted in 2010. The backtest overstates the signal's availability and likely understates its real-world performance drag.
Quality filters use point-in-time fundamental data. ROE, P/E, and market cap are sourced from the most recent annual filing available at each rebalance date, with a 45-day lag. This is the correct approach for fundamentals. But combined with the look-ahead bias in ETF weights, the overall signal has mixed temporal integrity.
Next-day close execution. Trades execute at the closing price one day after the signal date, reflecting a realistic market-on-close order flow.
Transaction costs not modeled. Annual rebalancing with 22 stocks is moderate turnover, but the stocks selected tend to be less liquid. Real-world spreads and market impact would further reduce the already poor returns.
Survivorship bias. Stocks that were delisted during the period are underrepresented in FMP's historical data. Since the concentration signal selects for marginal, lightly-held companies, this bias likely overstates results. The actual strategy performance may be even worse than reported.
Takeaway
Avoiding ETF-concentrated stocks doesn't generate alpha. It generates the opposite. The stocks that ETFs weight most lightly are lightly weighted for a reason: they're smaller, less liquid, and in weaker competitive positions than their heavily-weighted counterparts. Quality filters soften the blow but can't overcome the structural headwind.
The academic case for equal weighting is real. But it works through a rebalancing mechanism (sell winners, buy losers) that this signal doesn't capture. Picking lightly-weighted stocks and holding them for a year isn't equal weighting. It's just buying what the market's largest buyers don't want.
If you're interested in reducing concentration risk, the evidence points toward equal-weight index funds, not toward stock picking based on ETF weight signals.
Data: Ceta Research (FMP financial data warehouse). ETF holdings from etf_holder table (current snapshot, not historical). Price data from stock_eod (adjusted closes). Fundamental data from key_metrics_ttm and financial_ratios_ttm. 20 annual periods, July rebalance. Past performance does not guarantee future results. This is educational content, not investment advice.
References
- Wurgler, J. (2011). "On the Economic Consequences of Index-Linked Investing." NBER Working Paper No. 16376.
- Plyakha, Y., Uppal, R. & Vilkov, G. (2021). "Equal or Value Weighting? Implications for Asset Pricing Tests." Review of Finance, 25(5), 1477-1530.
- DeMiguel, V., Garlappi, L. & Uppal, R. (2009). "Optimal Versus Naive Diversification: How Inefficient is the 1/N Portfolio Strategy?" Review of Financial Studies, 22(5), 1915-1953.
- Cremers, M. & Petajisto, A. (2009). "How Active Is Your Fund Manager? A New Measure That Predicts Performance." Review of Financial Studies, 22(9), 3329-3365.


