
ETF Rebalancing Drag Across 18 Markets: Local Benchmarks Tell a Different Story
We tested whether low ETF ownership stocks outperform on 15 exchanges worldwide. Only 2 showed slim positive excess. The passive premium is real and it's global.

We ran the same Low Rebalancing Exposure strategy on 18 exchanges worldwide. Same rules everywhere: ROE > 10%, P/E between 0 and 40, bottom 30 stocks by ETF ownership ratio, annual rebalancing in July, equal weight, 2005 to 2025.
Contents
- Full Results: All 18 Exchanges
- The Standout: UK (LSE)
- The Positive Cases: Brazil, Sweden, Norway
- The Worst Performers: Asia Pacific and India
- The Global Benchmark Question
- Why Most Markets Fail
- The Drawdown Picture
- Conclusion
The key methodological change: each exchange is now compared to its local currency benchmark (FTSE 100 for UK, Sensex for India, DAX for Germany, etc.) rather than SPY across the board. This gives a more accurate picture of how the strategy performs in each market.
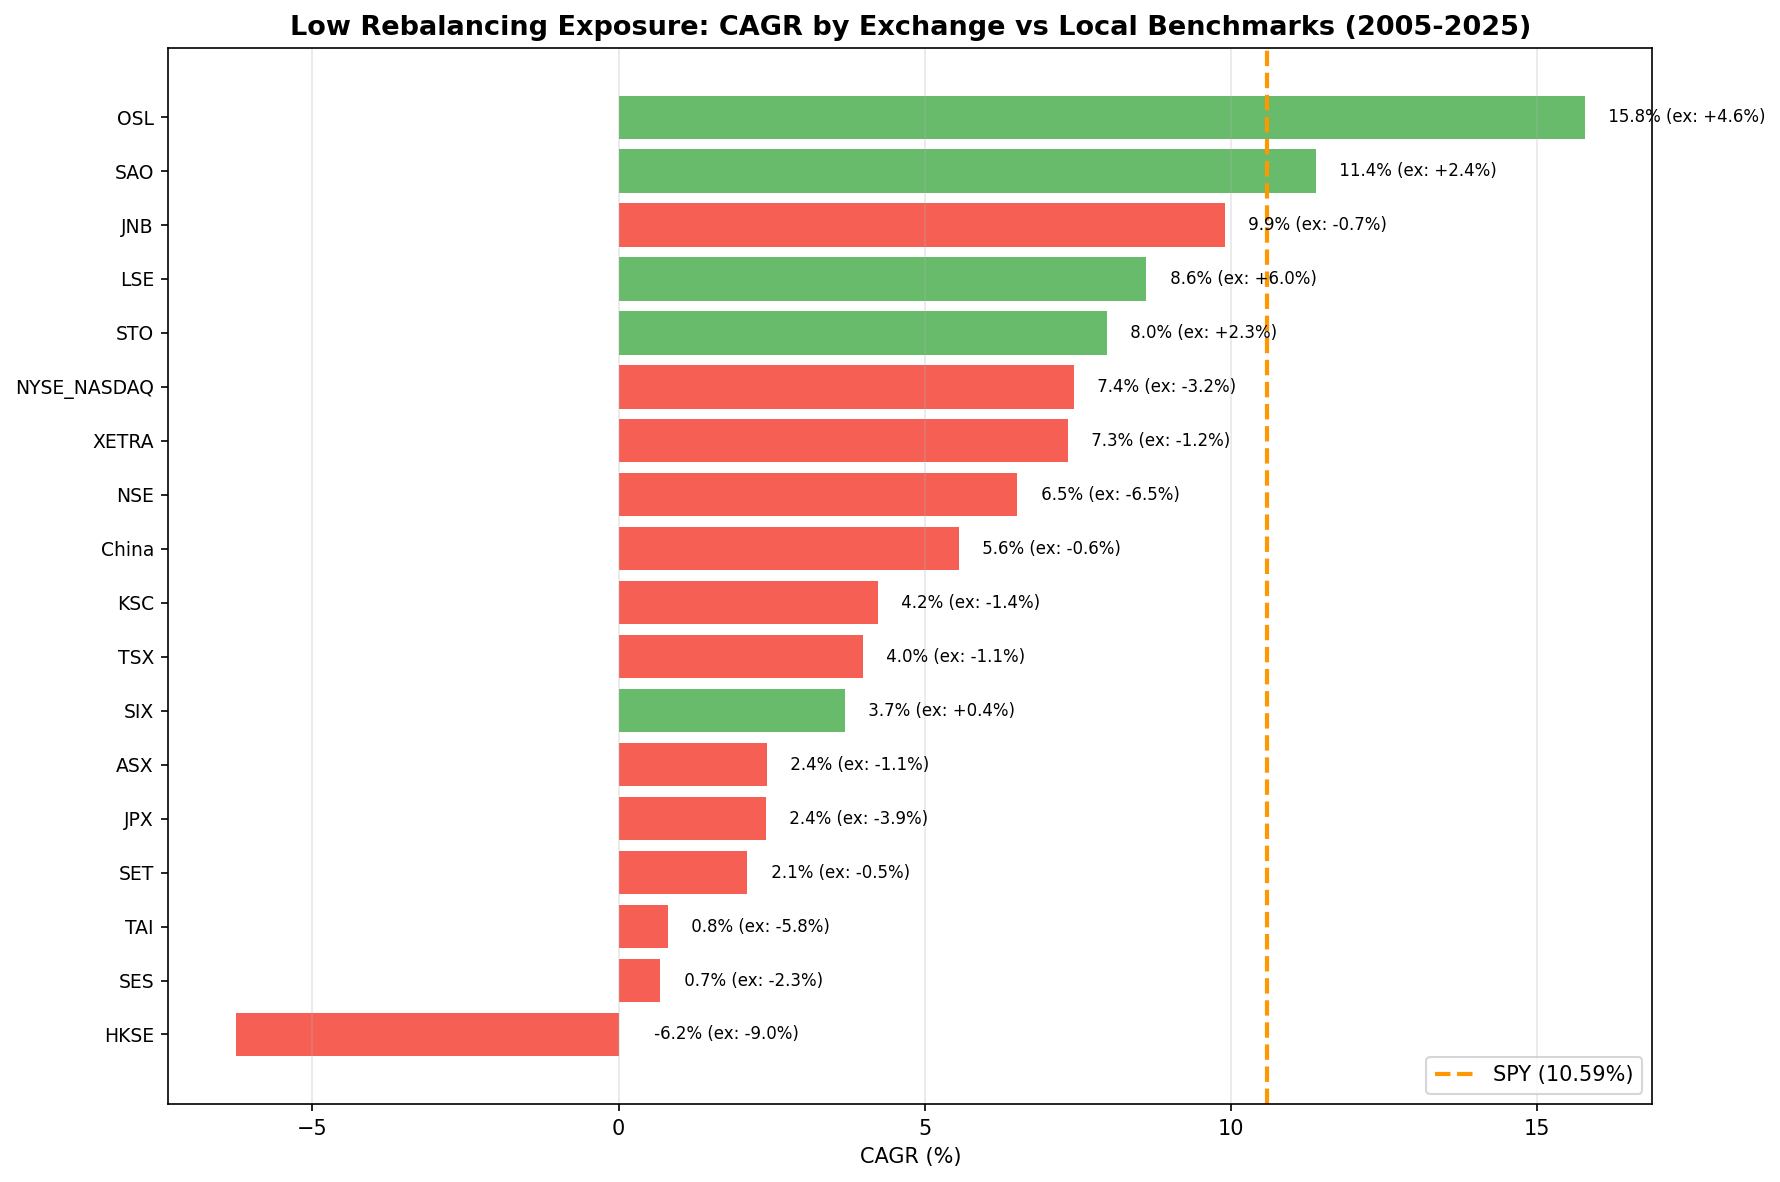
Against local benchmarks, 5 of 18 exchanges show positive excess returns, led by the UK (+5.96% vs FTSE 100) and Norway (+4.59% vs Oslo All Share). Against SPY as the global opportunity cost (10.59% CAGR), only 5 exchanges come close in absolute terms. The passive premium dominates globally, but benchmark strength shapes the result more than the ETF ownership signal.
Data: FMP financial data warehouse, 2000–2025. Updated April 2026.
Full Results: All 18 Exchanges
| Exchange | CAGR | Local Benchmark | Bench CAGR | Excess | Sharpe | Max DD | Win Rate |
|---|---|---|---|---|---|---|---|
| OSL (Norway) | 15.78% | Oslo All Share | 11.20% | +4.59% | 0.955 | -5.6% | 58% |
| SAO (Brazil) | 11.39% | Bovespa | 9.03% | +2.36% | 0.033 | -33.5% | 60% |
| STO (Sweden) | 7.97% | OMX Stockholm 30 | 5.70% | +2.27% | 0.286 | -38.1% | 60% |
| LSE (UK) | 8.62% | FTSE 100 | 2.67% | +5.96% | 0.385 | -15.8% | 65% |
| SIX (Switzerland) | 3.69% | SMI | 3.28% | +0.41% | 0.159 | -45.5% | 60% |
| SET (Thailand) | 2.10% | SET Index | 2.58% | -0.48% | -0.019 | -58.5% | 45% |
| SHH/SHZ (China) | 5.56% | SSE Composite | 6.15% | -0.59% | 0.083 | -51.2% | 55% |
| JNB (S. Africa) | 9.90% | S&P 500* | 10.59% | -0.69% | 0.046 | -34.0% | 45% |
| TSX (Canada) | 3.99% | TSX Composite | 5.10% | -1.11% | 0.081 | -36.2% | 50% |
| ASX (Australia) | 2.42% | ASX 200 | 3.55% | -1.12% | -0.072 | -48.3% | 45% |
| XETRA (Germany) | 7.34% | DAX | 8.54% | -1.19% | 0.341 | -45.4% | 50% |
| KSC (Korea) | 4.23% | KOSPI | 5.66% | -1.43% | 0.061 | -36.8% | 40% |
| SES (Singapore) | 0.68% | STI | 3.00% | -2.32% | -0.091 | -45.3% | 50% |
| NYSE/NASDAQ (US) | 7.43% | S&P 500 | 10.59% | -3.16% | 0.230 | -34.8% | 45% |
| JPX (Japan) | 2.40% | Nikkei 225 | 6.33% | -3.93% | 0.120 | -49.7% | 35% |
| NSE (India) | 6.51% | Sensex | 12.97% | -6.46% | 0.000 | -51.9% | 40% |
| TAI (Taiwan) | 0.80% | TAIEX | 6.61% | -5.82% | -0.014 | -30.3% | 35% |
| HKSE (Hong Kong) | -6.25% | Hang Seng | 2.71% | -8.96% | -0.426 | -86.2% | 20% |
JNB falls back to SPY benchmark (no JSE index data available in FMP). OSL uses Oslo All Share (available from 2013 only, so 12-year backtest period).
Data caveat: ETF ownership data is a current snapshot applied retrospectively. Quality filters use point-in-time FY data with 45-day lag. The ownership signal has look-ahead bias. See our US backtest for full methodology.

The Standout: UK (LSE)
The UK result deserves attention. The Low Rebalancing Exposure strategy returned 8.62% CAGR vs the FTSE 100's 2.67% — a +5.96% excess over 20 years. Sharpe of 0.385, win rate of 65%, and a max drawdown of -15.8%.
The FTSE 100's weakness explains most of this. The UK's flagship index is heavily weighted toward commodity companies, financials, and old-economy names (Shell, HSBC, AstraZeneca, Unilever) that have struggled against global tech-led growth. The index returned just 2.67% annually over 20 years, far below any comparable large-cap index.
Low-ETF-ownership UK stocks, filtered for ROE > 10%, happened to be more domestic consumer and industrial businesses that sidestepped the commodity and banking headwinds. This isn't alpha from the ETF signal. It's accidental sector selection. The down capture of -9.8% confirms this: when the FTSE fell, this portfolio actually went up on average, not because of the strategy's design, but because the portfolio held non-FTSE-correlated businesses.
This result warrants a standalone analysis. See our UK backtest for the full picture.
The Positive Cases: Brazil, Sweden, Norway
Brazil (SAO): +2.36% excess, Bovespa benchmark. The Bovespa has been volatile (oil price cycles, political risk) and the low-ETF filter happened to miss the worst volatility. Sharpe of 0.033 is weak, but consistent 60% win rate over 20 years. The excess survives when measured against Brazil's own market rather than SPY.
Sweden (STO): +2.27% excess, OMX Stockholm 30. Sweden's market is dominated by a few mega-caps: Volvo, Nordea, Ericsson, AstraZeneca. Low-ownership Swedish stocks that pass the quality screen tend to be mid-size domestically-focused companies. Against the OMX (which was dragged by Ericsson's poor decade), this portfolio held its own. Sharpe of 0.286 is reasonable.
Norway (OSL): +4.59% excess, Oslo All Share. Strong Sharpe (0.955) and low max drawdown (-5.6%), but note this result covers only 12 years (2013-2024) because the Oslo All Share benchmark lacks data before 2013. The result is compelling within that window but shouldn't be over-extrapolated.
Switzerland (SIX): +0.41% excess, SMI. Marginal. The SMI is heavily concentrated in Nestlé, Novartis, and Roche (three stocks represent about 50% of the index). Low-ETF Swiss stocks that pass quality screens ended up roughly matching their benchmark over 20 years. Not a signal.
The Worst Performers: Asia Pacific and India
India (NSE): -6.46% vs Sensex. The most damaging result when measured against the right benchmark. The Sensex compounded at 12.97% annually over 20 years, driven by HDFC, Reliance, TCS, and Bajaj Finance. Low-ETF NSE stocks averaged 6.51% CAGR with a Sharpe of zero. You could have held a Sensex index fund. You held the companies that failed to make it into that index for a reason.
Hong Kong (HKSE): -8.96% vs Hang Seng. The worst result globally. -6.25% CAGR with -86.2% max drawdown. Hong Kong's market has been hit by regulatory, geopolitical, and property-related distress since 2019. Low-ETF stocks in this environment had no defensive quality whatsoever.
Taiwan (TAI): -5.82% vs TAIEX. TSMC and its supply chain dominate Taiwan's equity returns. Any quality filter that doesn't explicitly include Taiwan's semiconductor sector will miss the market's primary return driver.
The Global Benchmark Question
Against SPY (the opportunity cost for global investors), the picture changes. SPY returned 10.59% CAGR over 2005-2025. Measured against that:
- Only LSE (+8.62% CAGR) and SAO (+11.39%) come close to SPY's absolute return
- OSL at 15.78% beats SPY, but only over 12 years in a specific favorable environment
- Every other exchange produces absolute returns well below SPY
This matters for a global investor choosing where to allocate. If the alternative is a US ETF, the strategy fails almost everywhere. If you're an investor already committed to a local market, some of these results (UK, Sweden, Brazil, Norway) represent a meaningful improvement over passive local exposure.
Why Most Markets Fail
Three mechanisms explain the consistent underperformance across markets.
1. Passive flows create a self-reinforcing loop. When index funds buy stocks, they push prices up. Higher prices increase market cap. Higher market cap increases index weight. Higher index weight triggers more buying. This feedback loop means passively-owned stocks systematically outperform non-owned stocks, not because of fundamental quality, but because of capital flow mechanics.
2. Low ownership is a negative signal, not a neutral one. The strategy assumes ETF ownership is randomly distributed, that some quality stocks just happen to be overlooked by passive funds. In practice, low ownership correlates with low liquidity, small index weight, poor institutional coverage, and limited analyst attention.
3. The quality filter doesn't compensate. ROE > 10% and P/E 0-40 are broad screens. They pass hundreds of stocks on most exchanges. The binding filter is ETF ownership ratio, which selects for the characteristics listed above.
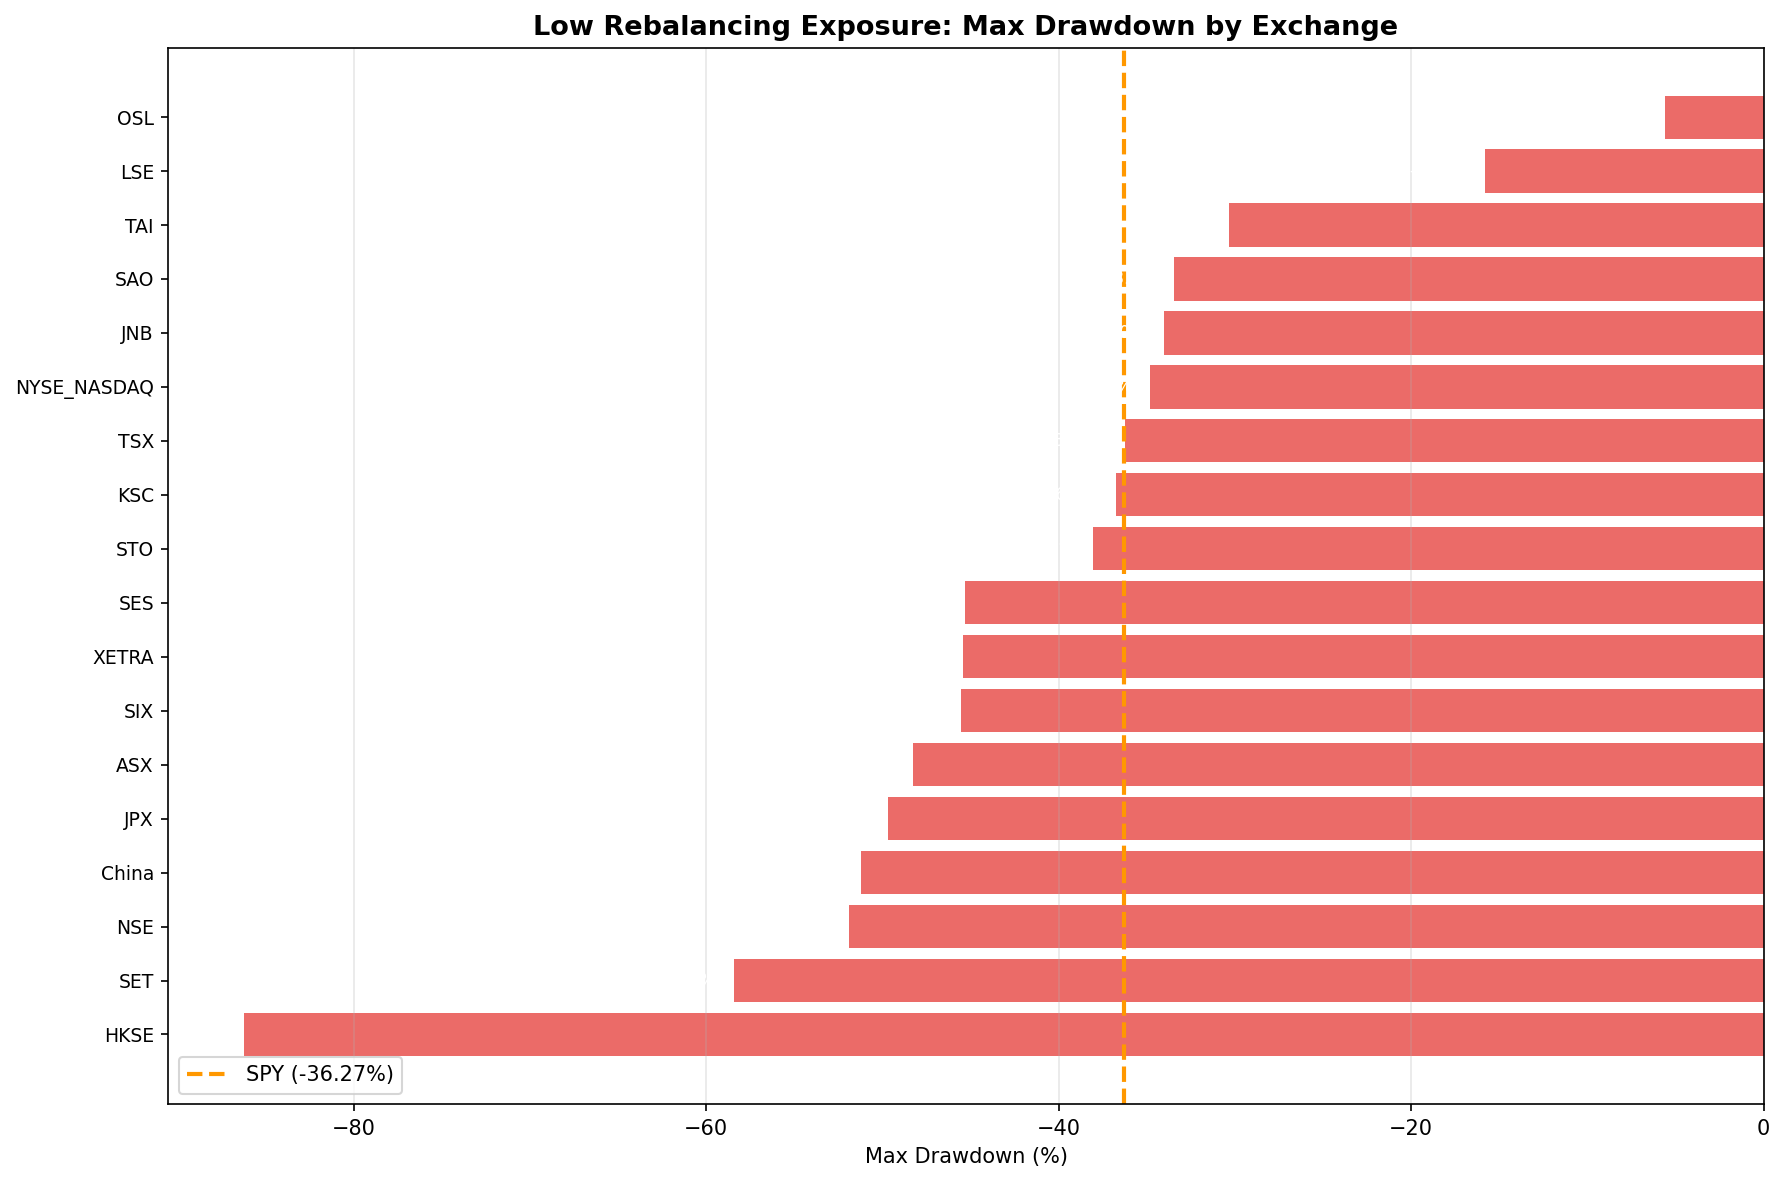
The Drawdown Picture
Several markets show severe drawdowns: HKSE (-86.2%), NSE (-51.9%), SET (-58.5%), SHH (-51.2%), JPX (-49.7%). Low-ownership portfolios don't consistently protect during downturns. When markets fall, illiquid low-passive stocks often fall harder because there's no automatic passive buyer.
The exceptions (UK at -15.8%, Norway at -5.6%) reflect sector composition more than the ETF signal's defensive properties.
Conclusion
Against local benchmarks, 5 of 18 exchanges show positive excess returns. Against SPY as a global opportunity cost, 13 of 18 underperform. The passive premium is real everywhere, but its magnitude depends on how strong the local benchmark is.
The clearest results come from the extremes: UK (+5.96% vs a weak FTSE 100) and India (-6.46% vs a strong Sensex) show that benchmark strength matters as much as the strategy's signal.
If you're testing whether low ETF ownership generates alpha, this is about as comprehensive a test as you can run. The signal doesn't work globally. But "doesn't work globally" is more nuanced than "fails everywhere against SPY."
Data: Ceta Research (FMP financial data warehouse), 2005-2025.
Part of a Series: See our US backtest for full methodology. See our UK backtest for the full UK analysis.
Past performance does not guarantee future results. This is educational content, not investment advice.


