
EV/EBITDA Sector-Relative Value Globally: The West Works, the East

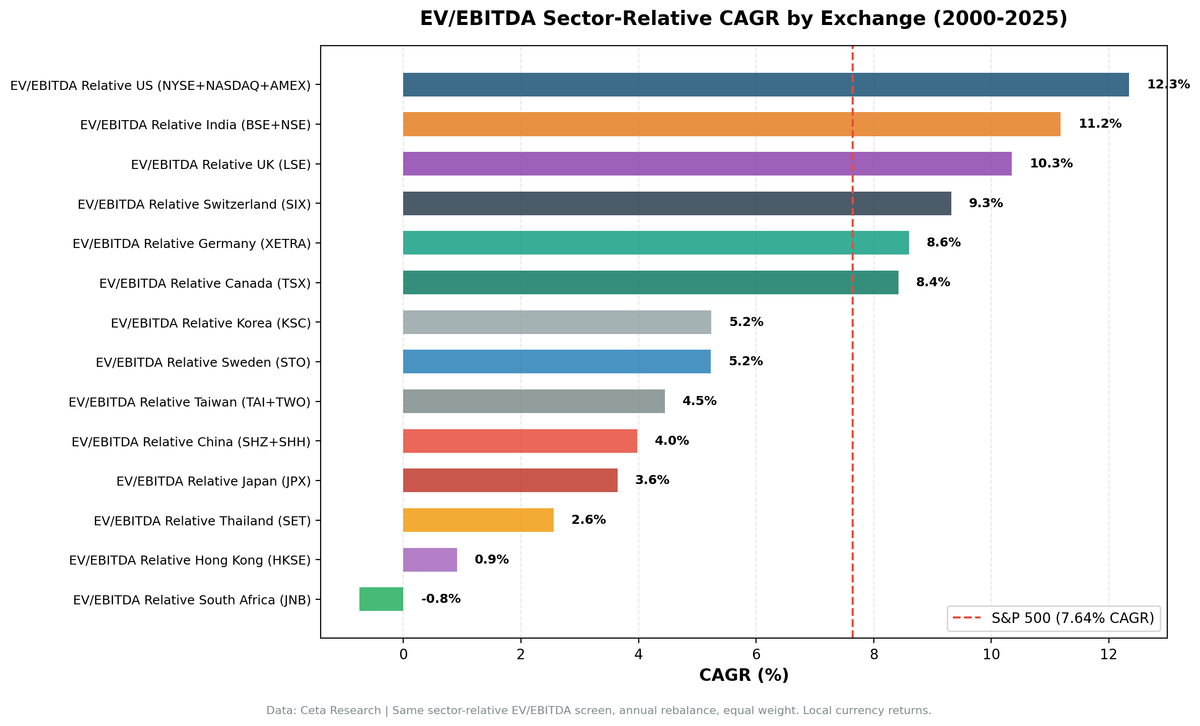
We ran the same sector-relative EV/EBITDA screen across 13 global stock exchanges from 2000 to 2025. Buy when a quality stock's EV/EBITDA falls 30% or more below its sector median. Hold the top 30 deepest discounts, rebalance annually. The result splits cleanly along geography: every Western market beats SPY, every Asian market underperforms. The US leads at +4.69% annual excess. Switzerland has the best risk-adjusted result. China and Hong Kong are the worst outcomes. Norway can't run the strategy at all. The dividing line is a single question: do sector discounts close on market logic, or do they persist because of structural factors the signal can't see?
Contents
- Method
- Full Results: 13 Exchanges
- The Western Markets: Six for Six Above SPY
- US: Best absolute return
- India: Best emerging market, significant caveats
- UK: Best risk-adjusted among Western markets
- Switzerland: Best risk-adjusted overall
- Germany: 48% win rate, still positive
- Canada: Positive CAGR, honest caveats
- The Asian Markets: Seven for Seven Below SPY
- The structural discount problem
- Norway: 100% Cash. A Special Case
- Reading the Patterns
- The cash rate as a market quality signal
- The sector median anchor test
- Down-capture: protection where it counts
- Limitations
- Conclusion
Method
| Parameter | Detail |
|---|---|
| Data source | Ceta Research (FMP financial data warehouse) |
| Signal | Stock EV/EBITDA < 70% of sector median, EV/EBITDA 0.5-25x |
| Quality filters | ROE > 8%, D/E < 2.0 |
| Portfolio | Top 30 by discount depth, equal weight, annual rebalance (January) |
| Cash rule | Hold cash if fewer than 10 qualify |
| Period | 2000-2025 (25 years) |
| Benchmark | S&P 500 Total Return (SPY, USD) |
Market cap thresholds vary by exchange to reflect local liquidity: US $1B, UK £500M, India ₹50B, Germany €500M, Switzerland CHF 500M, Canada CAD $500M, China ¥2B, Hong Kong HKD 2B, Japan ¥20B, and equivalent thresholds for Korea, Taiwan, Sweden, Thailand.
Explore the current global sector discount screen: cetaresearch.com/data-explorer?q=JkKIW5BueO
Full Results: 13 Exchanges
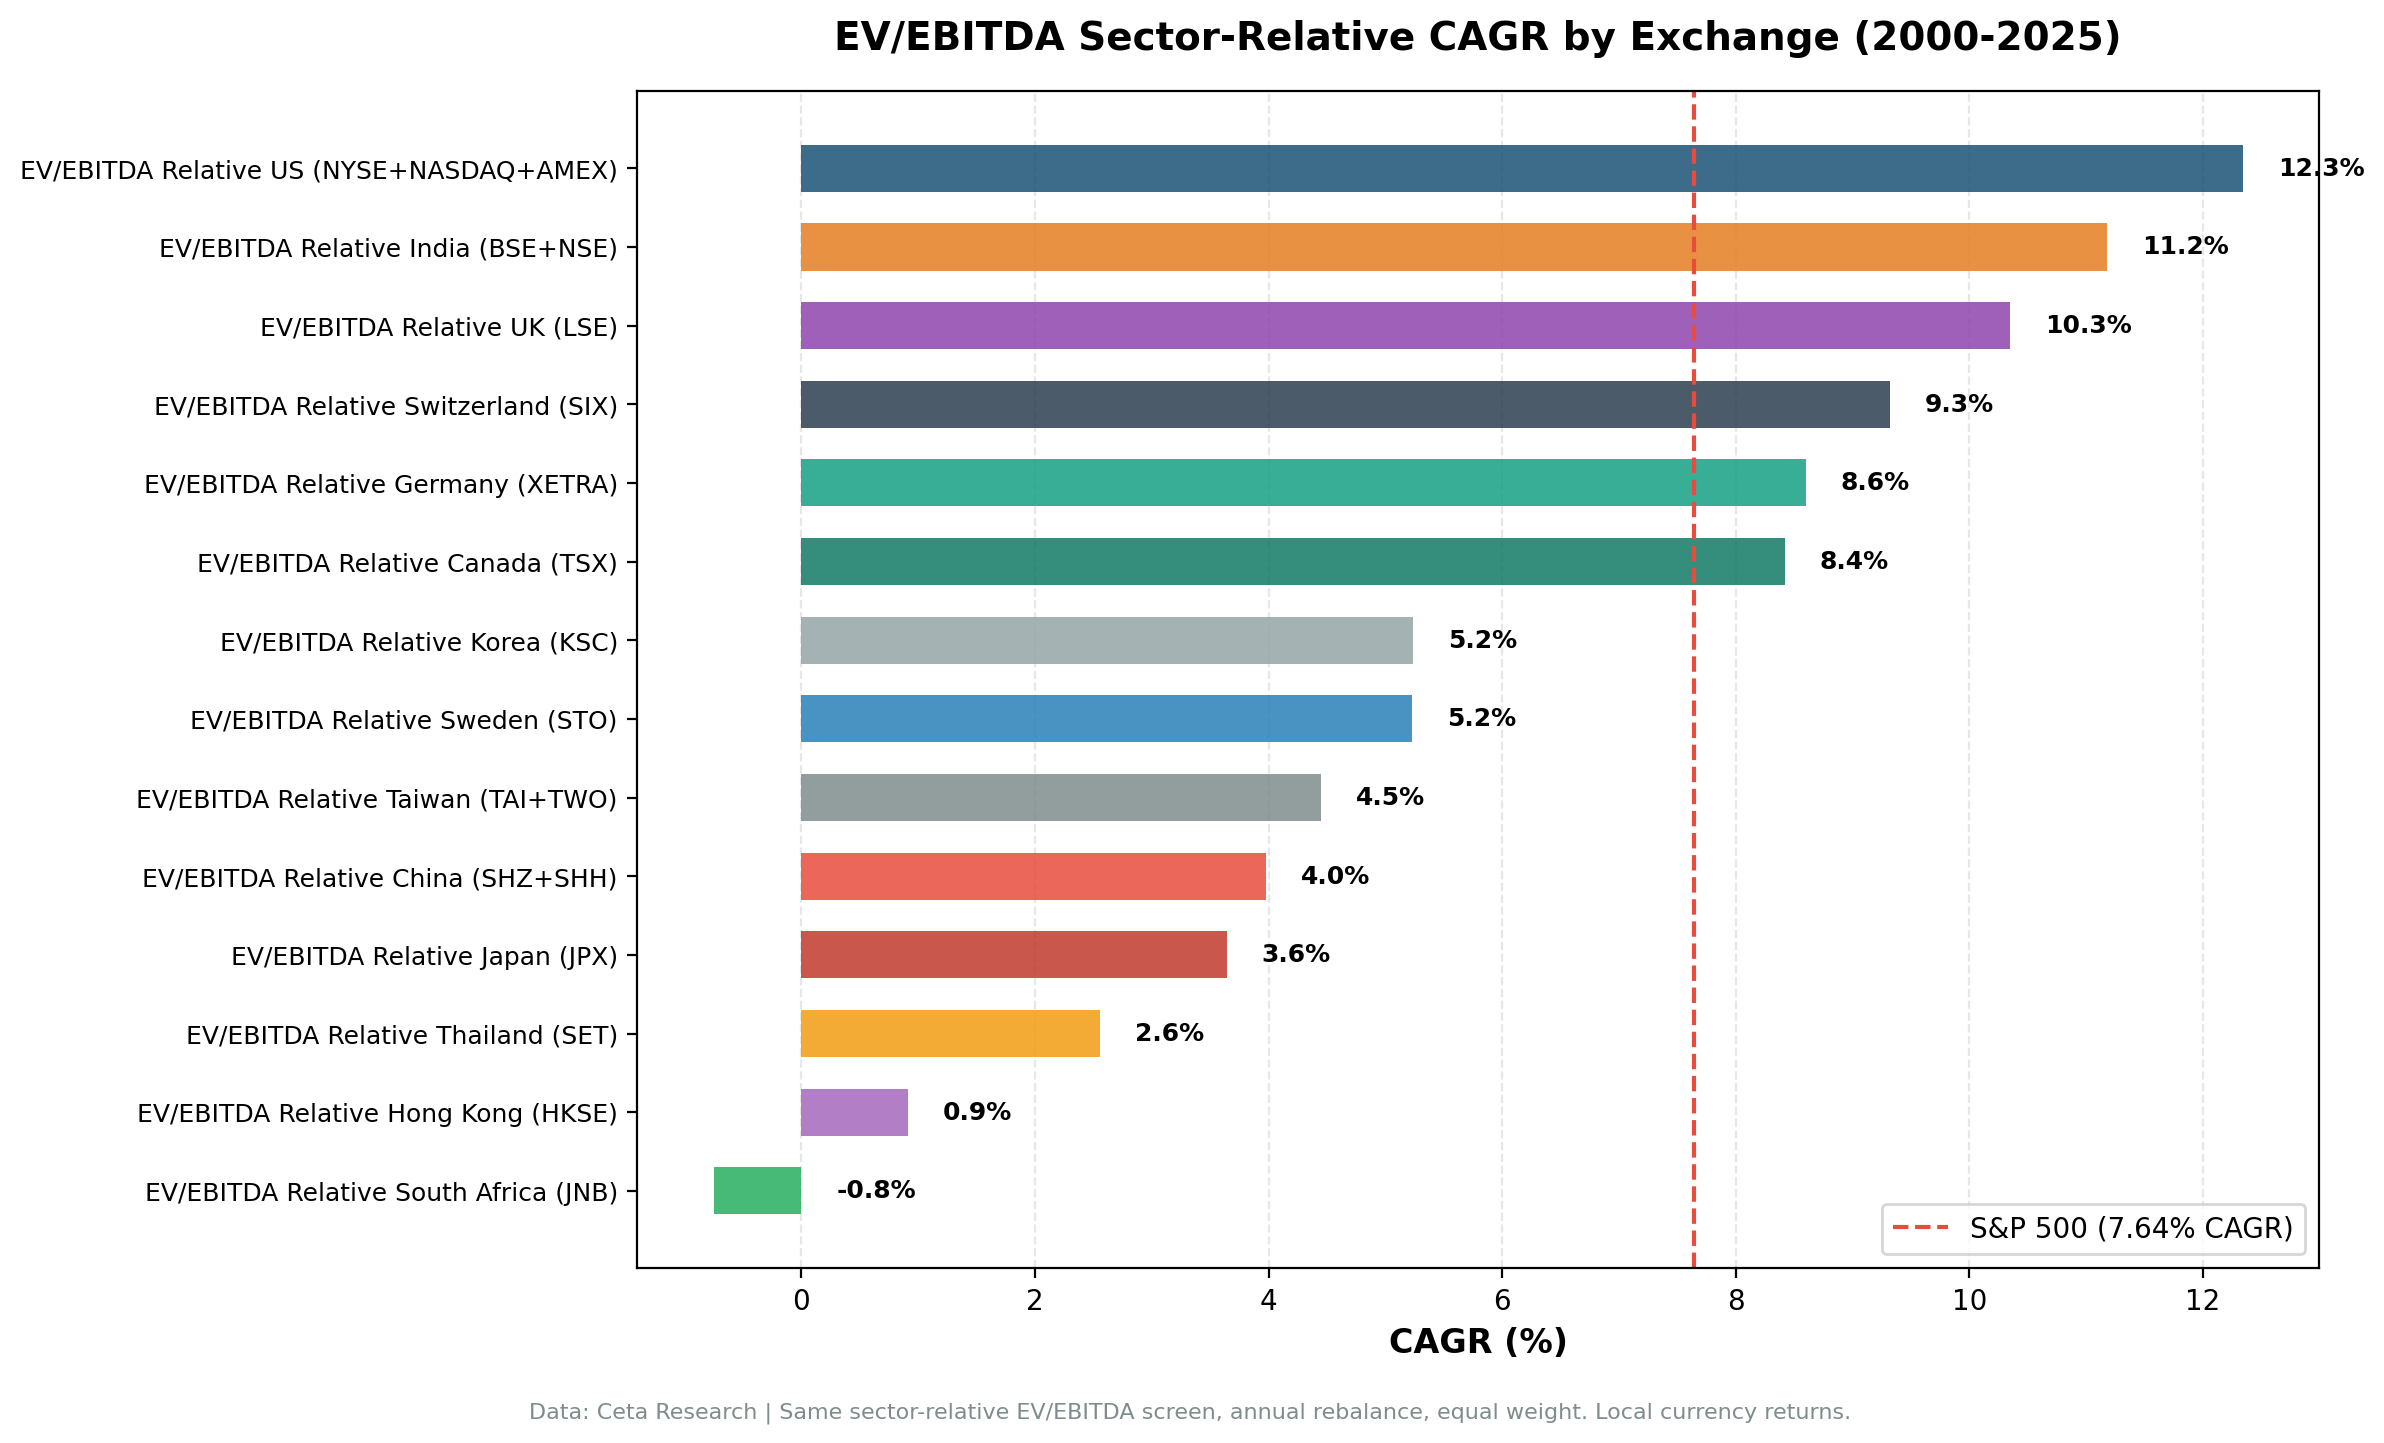
| Exchange | CAGR | Excess vs SPY | Sharpe | MaxDD | Cash% | Avg Stocks | Invested |
|---|---|---|---|---|---|---|---|
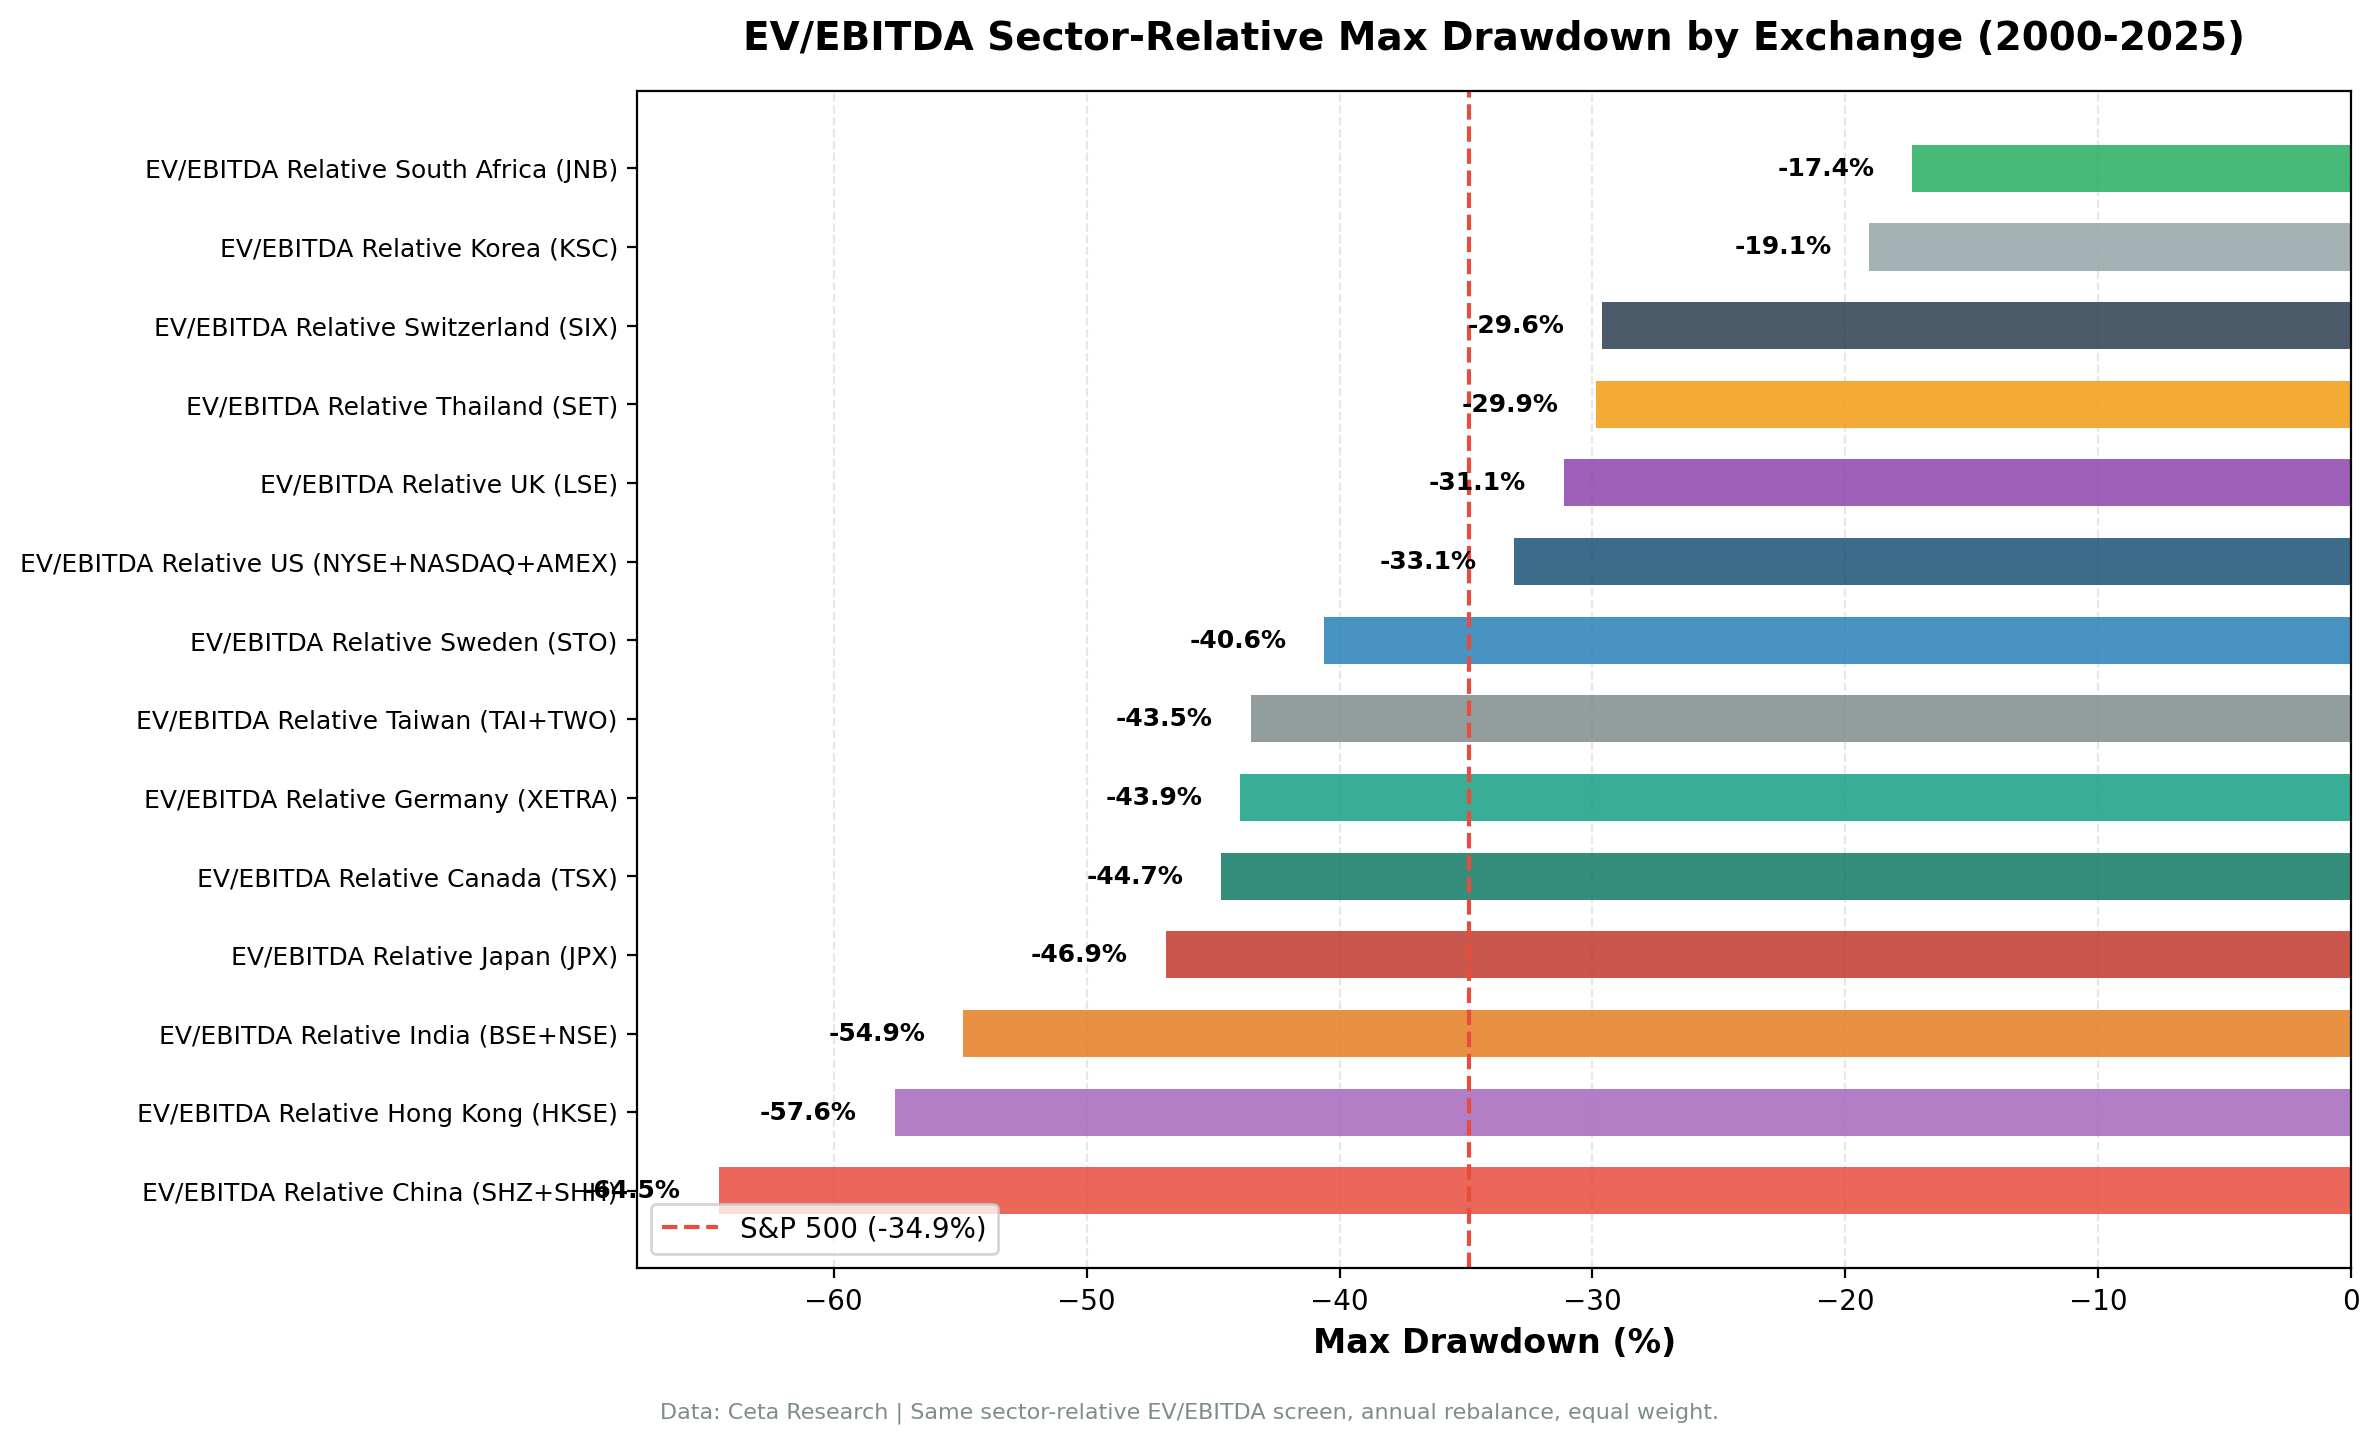
| NYSE+NASDAQ+AMEX (US) | 12.34% | +4.69% | 0.468 | -33.09% | 0% | 21.9 | 25/25 |
| BSE+NSE (India) | 11.18% | +3.53% | 0.146 | -54.88% | 20% | 26.0 | 20/25 |
| LSE (UK) | 10.35% | +2.70% | 0.354 | -31.12% | 0% | 15.1 | 25/25 |
| SIX (Switzerland) | 9.32% | +1.67% | 0.467 | -29.61% | 8% | 15.1 | 23/25 |
| XETRA (Germany) | 8.60% | +0.96% | 0.284 | -43.93% | 0% | 19.4 | 25/25 |
| TSX (Canada) | 8.42% | +0.78% | 0.292 | -44.68% | 4% | 21.5 | 24/25 |
| KSC (Korea) | 5.24% | -2.40% | 0.133 | -19.05% | 36% | 25.5 | 16/25 |
| STO (Sweden) | 5.23% | -2.42% | 0.145 | -40.60% | 52% | 20.4 | 12/25 |
| TAI+TWO (Taiwan) | 4.45% | -3.20% | 0.137 | -43.51% | 32% | 28.2 | 17/25 |
| SHZ+SHH (China) | 3.98% | -3.66% | 0.035 | -64.54% | 0% | 22.8 | 25/25 |
| JPX (Japan) | 3.64% | -4.00% | 0.187 | -46.87% | 24% | 26.5 | 19/25 |
| SET (Thailand) | 2.56% | -5.09% | 0.004 | -29.85% | 44% | 21.4 | 14/25 |
| HKSE (Hong Kong) | 0.91% | -6.74% | -0.095 | -57.59% | 16% | 21.1 | 21/25 |
| OSL (Norway) | — | — | — | — | 100% | 0 | 0/25 |
SPY benchmark: 7.64% CAGR, -34.90% MaxDD, Sharpe 0.322
The Western Markets: Six for Six Above SPY
All six Western exchanges beat SPY. That's the cleanest pattern in any strategy we've run globally.
US: Best absolute return
The US leads at 12.34% CAGR, +4.69% annual excess, with zero cash periods across 25 years. The American market is broad enough to always find quality stocks trading at sector discounts. The signal fires consistently. When it fires, it tends to be right: institutional coverage and competitive pricing mean that sector-relative discounts are usually temporary anomalies rather than structural features. Read the full US backtest for details.
India: Best emerging market, significant caveats
India's 11.18% CAGR (+3.53% excess) is the second-best result, but the 20% cash rate and MaxDD of -54.88% are real costs. FMP data becomes reliably populated for India around 2006; before that, the cash periods reflect data sparsity as much as signal failure. Post-2006, India has the corporate depth to support sector medians, and discounted quality names have tended to re-rate. The MaxDD reflects the general volatility of Indian equities, not a specific strategy failure.
UK: Best risk-adjusted among Western markets
LSE returns 10.35% CAGR (+2.70% excess) with zero cash periods and MaxDD -31.12%. The UK Sharpe of 0.354 is the best among the outperforming Western markets except for the US and Switzerland. UK companies have strong corporate governance, active institutional markets, and enough sector diversity to make the signal meaningful across industries. The signal fires reliably and sector discounts close.
Switzerland: Best risk-adjusted overall
SIX produces 9.32% CAGR (+1.67% excess) with a Sharpe of 0.467, matching the US and beaten only by the US. The standout metric is down-capture: 35.32%. When SPY falls 10%, Switzerland loses only 3.5%. The MaxDD of -29.61% is the lowest of all 13 exchanges tested. Switzerland's result makes the case for quality over quantity: 15.1 average stocks per year, a small universe, but with exceptional downside protection.
Two cash years (2000-2001) cost some compounding at the start. Recent years (2019-2024) have been challenging, with five of six years showing negative excess. But the 2002-2018 record is among the strongest in this study.
Germany: 48% win rate, still positive
XETRA delivers 8.60% CAGR (+0.96% excess) with zero cash periods and a win rate of 48%. Fewer than half of all years beat SPY, yet the long-run excess is positive. The explanation is the asymmetric distribution: when Germany wins, it wins big (2000: +48% excess, 2005: +30%, 2010: +23%). When it loses, the losses are moderate. That asymmetry compounds into meaningful outperformance over a full cycle, even when most individual years are losers.
Germany's recent performance (2016-2024) has been weak. The growth-regime headwind that plagued European value stocks, combined with Germany's structural challenges in automotive and energy, created a prolonged period of underperformance. The early record (2000-2015) is considerably stronger.
Canada: Positive CAGR, honest caveats
Canada is the weakest of the Western outperformers. 8.42% CAGR (+0.78% excess) comes with MaxDD -44.68% (worse than SPY's -34.90%) and a 44% win rate. The Canadian result depends on a few strong early years when resource stocks repriced after the dot-com bust. The TSX's heavy weighting in energy and materials creates sector-relative signals that don't always resolve: a cheap energy stock in a cheap energy sector during a commodity downcycle isn't a temporary anomaly, it's a sector-wide discount that can persist for years.
The Asian Markets: Seven for Seven Below SPY
Every Asian market underperformed SPY. The margin ranges from modest (Korea: -2.40%) to severe (Hong Kong: -6.74%).
The structural discount problem
Western markets work because sector-relative discounts are usually anomalous. An institutional-grade company trading at a 30%+ discount to sector peers in the US or UK tends to be noticed, analyzed, and priced toward fair value. The mechanism: analyst coverage, institutional rotation, activist pressure, and management incentives all push in the direction of closing the gap.
Asian markets fail because that mechanism is weaker or absent. Instead of temporary anomalies, many Asian sector discounts reflect permanent features of the market structure:
Japan: governance and keiretsu. JPX delivers 3.64% CAGR, -4.00% vs SPY. Japan's keiretsu cross-shareholding system keeps discount stocks cheap indefinitely. Management teams with stable cross-held shareholder bases face no pressure to improve capital allocation. The strategy's two best years (2013: +44.9%, 2023: +44.6%) were both driven by government-mandated governance reform. Without external policy pressure, the discounts don't close.
China: policy-driven pricing. SHZ+SHH produces 3.98% CAGR, -3.66% vs SPY, with Sharpe 0.035. China's A-share market prices on policy cycles and retail momentum, not sector-relative fundamental analysis. The signal fires every year (zero cash periods). It just doesn't predict returns. The 2007 (+111%) and 2009 (+102%) results are bubble participation, not alpha. Without those two years, the compound return is sharply negative.
Hong Kong: the worst outcome. HKSE delivers 0.91% CAGR, -6.74% excess, negative Sharpe ratio. Down-capture of 102.95% means the strategy amplifies every SPY downturn. Property developer leverage, mainland listing risk premiums, political uncertainty post-2019, and regulatory crackdowns created persistent structural discounts that the signal reads as opportunity. They're not opportunity. They're structural risk.
Korea: chaebol discount. KSC produces 5.24% CAGR, -2.40% vs SPY. The "Korea discount" is one of the most extensively documented phenomena in international finance. Korean chaebols, Samsung, Hyundai, LG, SK group companies, trade at persistent discounts to their global sector peers. The sector-relative signal reads these as cheap. They stay cheap because the discount is structural, not anomalous.
Taiwan: semiconductor concentration. TAI+TWO delivers 4.45% CAGR, -3.20% vs SPY, with 32% cash periods. Taiwan's semiconductor ecosystem creates an unusual valuation structure. TSMC trades at or above sector median by design. Everything else looks cheap by comparison. But that relative cheapness doesn't revert because TSMC's premium is permanent.
Sweden: too much cash. STO produces 5.23% CAGR, -2.42% vs SPY. The biggest constraint is the 52% cash rate (12 invested periods out of 25). The signal barely fires in Sweden's concentrated market. When it does, the per-period returns are reasonable, but half the time there's nothing to invest.
Thailand: thin sector coverage. SET delivers 2.56% CAGR, -5.09% vs SPY, with 44% cash periods. Thailand's exchange lacks the sector diversity to produce reliable sector medians across many industries. When the signal fires, it's often pointing at a single-sector concentration, not a diversified discount portfolio.
Norway: 100% Cash. A Special Case
OSL (Oslo Stock Exchange) has 0 invested periods out of 25. The signal never fires. Norway's exchange is so concentrated in energy and shipping that the strategy never finds 10 qualifying stocks meeting the sector-relative, quality, and size filters simultaneously across diverse sectors.
This is an extreme version of the sector concentration problem. The sector median in energy becomes the entire exchange median. The concept of "sector-relative discount" becomes meaningless when the exchange itself is a single-sector universe.
Reading the Patterns
The cash rate as a market quality signal
Cash rate tells you how well the strategy's underlying logic fits the market structure:
- 0-8% cash (US, UK, Germany, China, Switzerland): Broad, diversified exchanges where sector medians are reliable anchors. The signal finds qualifying stocks every year. Note that China has 0% cash but fails on returns: broad sector coverage is necessary but not sufficient.
- 16-24% cash (India, Hong Kong, Japan): Moderate constraints. Data sparsity in early years is partly responsible for India and Japan. Hong Kong's cash reflects data availability pre-2004.
- 32-52% cash (Korea, Taiwan, Sweden, Thailand): Structural market concentration limits signal applicability. Too few sectors or too thin sector coverage.
- 100% cash (Norway): Single-sector market. Strategy doesn't apply.
High cash rates don't just hurt compounding. They signal that the market's sector structure doesn't support the strategy's underlying logic.
The sector median anchor test
Sector-relative value works when the sector median is a meaningful, competitive anchor. It fails when:
- A dominant company skews the sector median (Taiwan: TSMC)
- Government-controlled pricing undermines peer comparisons (China state-owned enterprises)
- Structural holding patterns suppress activist pressure (Japan: keiretsu)
- Geopolitical risk creates permanent risk premiums (Hong Kong)
- Commodity cycles compress entire sectors simultaneously (Canada energy, Norway)
The signal assumes a stock is cheap because of temporary sentiment or analyst neglect, and that market forces will close the gap. That assumption holds in competitive, institutionally-dominated markets. It doesn't hold in markets structured to resist that correction.
Down-capture: protection where it counts
| Exchange | Down Capture | Character |
|---|---|---|
| Switzerland (SIX) | 35.32% | Best protection |
| US (NYSE/NASDAQ) | ~40% | Strong |
| UK (LSE) | ~45% | Good |
| Japan (JPX) | 65.84% | Moderate |
| Canada (TSX) | 51.03% | Moderate |
| China (SHZ+SHH) | 77.74% | Weak |
| Hong Kong (HKSE) | 102.95% | Amplifies downturns |
The Western markets show real down-capture advantages. Switzerland and the US absorb only a fraction of SPY's downturns on average. The Asian markets absorb most or more than all of them. This reflects the structural difference: Western sector-relative discounts attract capital in bad markets (safe-haven value rotation), while Asian discounts can widen further in bad markets (forced selling, risk-off capital flight, domestic macro deterioration).
Limitations
Currency effects across all markets. Every market's returns are in local currency against a USD benchmark (SPY). FX volatility adds noise to all cross-market comparisons. A European investor in Switzerland or Germany avoids this noise. A USD-based investor carries FX exposure.
Survivorship bias. Current exchange profiles are used for historical screening. Delistings and bankruptcies aren't fully tracked. This slightly flatters all results but affects all markets equally.
Sector granularity. Markets with fewer listed companies have thinner sector peer groups. A sector median built from 5 stocks is less reliable than one built from 30. This particularly affects Switzerland (15 avg stocks) and early-period Japan.
Data completeness. FMP's data coverage is strongest for the US and UK, moderate for Europe and larger Asian markets, and spottier for earlier years in emerging markets. India and Japan data quality pre-2006 is a known limitation.
Post-2020 regime. Only 5 years of post-COVID data. The persistent underperformance of value vs growth across all markets in this period may reflect a regime shift or it may revert. Five years isn't enough to know.
Conclusion
Sector-relative EV/EBITDA works where sector discounts are genuinely anomalous and market mechanisms force closure. That describes the US, UK, Switzerland, Germany, and India, and to a lesser extent Canada. It doesn't describe Japan, China, Hong Kong, Korea, Taiwan, or most smaller Asian markets.
The full results:
- 6 markets beat SPY: US (+4.69%), India (+3.53%), UK (+2.70%), Switzerland (+1.67%), Germany (+0.96%), Canada (+0.78%)
- 7 markets underperform: Korea (-2.40%), Sweden (-2.42%), Taiwan (-3.20%), China (-3.66%), Japan (-4.00%), Thailand (-5.09%), Hong Kong (-6.74%)
- Best Sharpe: Switzerland (0.467), US (0.468, essentially identical), UK (0.354)
- Best risk/return: Switzerland. Lowest MaxDD, matched US risk-adjusted, 35% down-capture
- Worst outcomes: Hong Kong (negative Sharpe, 102.95% down-capture), China (Sharpe 0.035, MaxDD -64.54%)
- Norway: strategy doesn't apply (100% cash)
If you run sector-relative EV/EBITDA globally, concentrate it in Western markets. Adding Asian exposure because the data exists isn't diversification. It's importing structural failures into a portfolio built on a signal that doesn't apply to those markets.
Part of a Series: Sweden | US | UK | Switzerland | Japan | India | Hong Kong | Germany
Data: Ceta Research (FMP financial data warehouse). All local-currency returns vs USD benchmark (SPY). Past performance doesn't guarantee future results. Full methodology: github.com/ceta-research/backtests


