
FCF Conversion Quality on Chinese A-Shares: +2.83% Over SSE Composite in a Volatile Market
Chinese A-shares returned 5.26% CAGR, beating the SSE Composite (2.43%) by 2.83% annually. 60% win rate, 73.86% down capture, and zero cash periods. $10K grew to ~$36K vs ~$18K for the index. Volatile but FCF quality adds value.

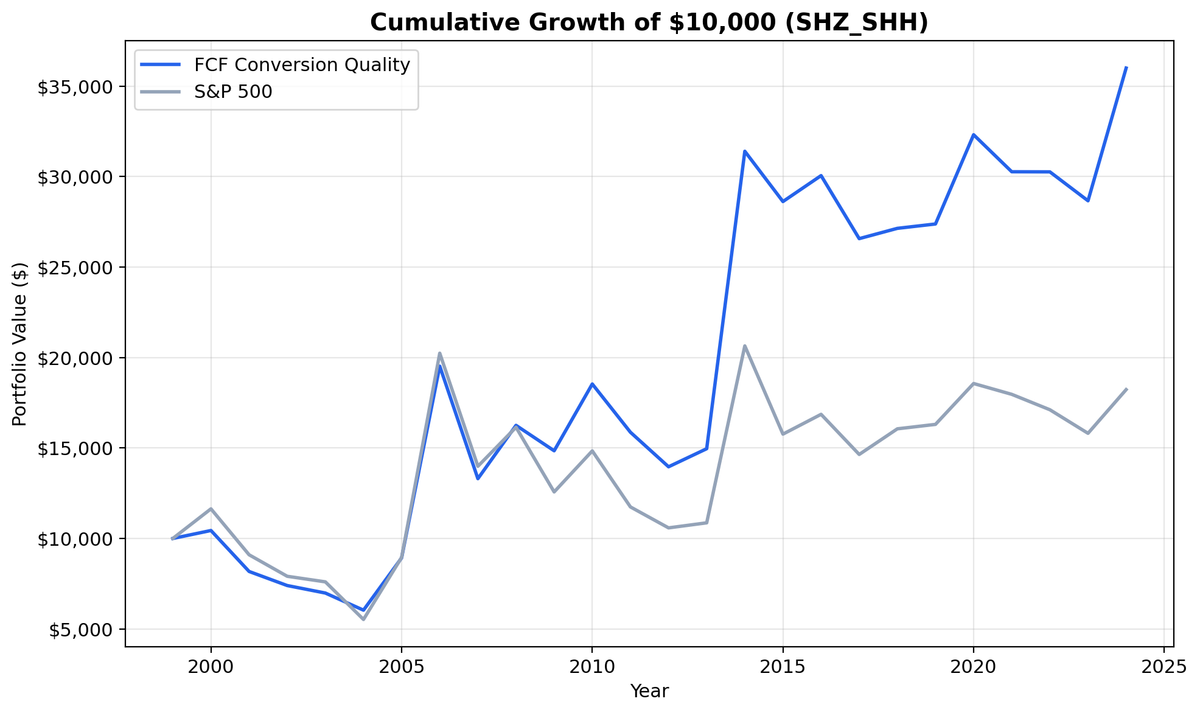
Chinese A-shares returned 5.26% CAGR over 25 years, beating the SSE Composite (2.43% CAGR) by 2.83% annually. $10,000 grew to ~$36K while the local index reached ~$18K. The 60% win rate is solid, and down capture of 73.86% means the portfolio absorbed less than three-quarters of the benchmark's losses. Volatility is high at 36% and the max drawdown hit -42.16%, but FCF quality adds real value in China's boom-bust cycles.
Contents
- Method
- The Signal
- The Screen (SQL)
- What We Found
- $10,000 grew to ~$36K. The SSE Composite reached ~$18K.
- Annual Returns
- Limitations
- Run It Yourself
- Part of a Series
Data: FMP financial data warehouse, 2000–2025. Updated March 2026.
Method
Data source: Ceta Research (FMP financial data warehouse) Universe: Shanghai (SHH) and Shenzhen (SHZ) exchanges, market cap > CNY 2B (~$276M USD) Period: 2000-2025 (25 years, 25 annual periods) Rebalancing: Annual (July), top 30 by highest FCF conversion, equal weight Execution: Next-day close (market-on-close) Benchmark: SSE Composite (local index, CNY) Cash rule: Hold cash if fewer than 10 stocks qualify Costs: Size-tiered transaction costs (0.1% large-cap, 0.3% mid-cap, 0.5% small-cap) Currency: Returns in CNY.
Financial data uses a 45-day lag to prevent look-ahead bias. July rebalancing ensures annual filings are available. Trades execute at the next trading day's close to avoid same-day entry bias. Full methodology: Ceta Research Backtest Methodology.
This is the China edition of our US FCF Conversion Quality analysis.
The Signal
| Filter | Threshold | Why |
|---|---|---|
| FCF / Net Income | 100% - 300% | Cash backs reported earnings. Cap at 300% filters tiny-NI noise |
| FCF / Revenue | > 10% | Meaningful absolute cash flow, not just ratio math |
| Return on Equity | > 10% | Profitable business, not just high conversion on low base |
| Operating Margin | > 10% | Real pricing power, sustainable cash generation |
| Net Income | > 0 | Negative denominators make the ratio meaningless |
| Free Cash Flow | > 0 | Only companies generating cash |
| Market Cap | > CNY 2B (~$276M) | Liquid stocks only |
Selection: Top 30 by highest FCF conversion, equal weight.
The Screen (SQL)
SELECT
  c.symbol,
  p.companyName,
  ROUND(c.freeCashFlow / NULLIF(i.netIncome, 0) * 100, 1) AS fcf_conversion_pct,
  ROUND(c.freeCashFlow / NULLIF(i.revenue, 0) * 100, 1) AS fcf_margin_pct,
  ROUND(k.returnOnEquityTTM * 100, 1) AS roe_pct,
  ROUND(r.operatingProfitMarginTTM * 100, 1) AS op_margin_pct,
  ROUND(k.marketCap / 1e9, 1) AS mktcap_bn
FROM cash_flow_statement_ttm c
JOIN income_statement_ttm i ON c.symbol = i.symbol
JOIN key_metrics_ttm k ON c.symbol = k.symbol
JOIN financial_ratios_ttm r ON c.symbol = r.symbol
JOIN profile p ON c.symbol = p.symbol
WHERE i.netIncome > 0
  AND c.freeCashFlow > 0
  AND c.freeCashFlow / NULLIF(i.netIncome, 0) > 1.0
  AND c.freeCashFlow / NULLIF(i.netIncome, 0) < 3.0
  AND c.freeCashFlow / NULLIF(i.revenue, 0) > 0.10
  AND k.returnOnEquityTTM > 0.10
  AND r.operatingProfitMarginTTM > 0.10
  AND k.marketCap > 2000000000
  AND p.exchange IN ('SHZ', 'SHH')
ORDER BY c.freeCashFlow / NULLIF(i.netIncome, 0) DESC
LIMIT 30
Run this query on Ceta Research
What We Found

$10,000 grew to ~$36K. The SSE Composite reached ~$18K.
| Metric | FCF Conversion Quality | SSE Composite |
|---|---|---|
| CAGR | 5.26% | 2.43% |
| Total Return | 260% | ~80% |
| Excess CAGR | +2.83% | - |
| Max Drawdown | -42.16% | - |
| Sharpe Ratio | 0.077 | - |
| Sortino Ratio | 0.239 | - |
| Win Rate (annual) | 60% | - |
| Down Capture | 73.86% | - |
| Avg Stocks per Period | 20.5 | - |
| Cash Periods | 0 of 25 | - |
The +2.83% excess CAGR over the SSE Composite is the headline. With the old SPY benchmark, this strategy looked like a loser (-2.84% excess). Against the local index, it's a winner. The SSE Composite returned just 2.43% CAGR over 25 years. Chinese markets are volatile but the broad index hasn't rewarded buy-and-hold investors well. FCF quality screening adds real value on top of that weak base.
The 60% win rate means the strategy beat the SSE Composite in 15 of 25 years. Down capture of 73.86% means the portfolio absorbed about three-quarters of the benchmark's losses during down years. Not spectacular downside protection, but you're getting better returns with less downside participation.
Zero cash periods and 20.5 average stocks per period show the A-share universe is deep enough. The quality filters find plenty of qualifying companies. China has large, profitable enterprises that generate real cash, particularly in consumer staples, utilities, infrastructure, and state-owned banks.
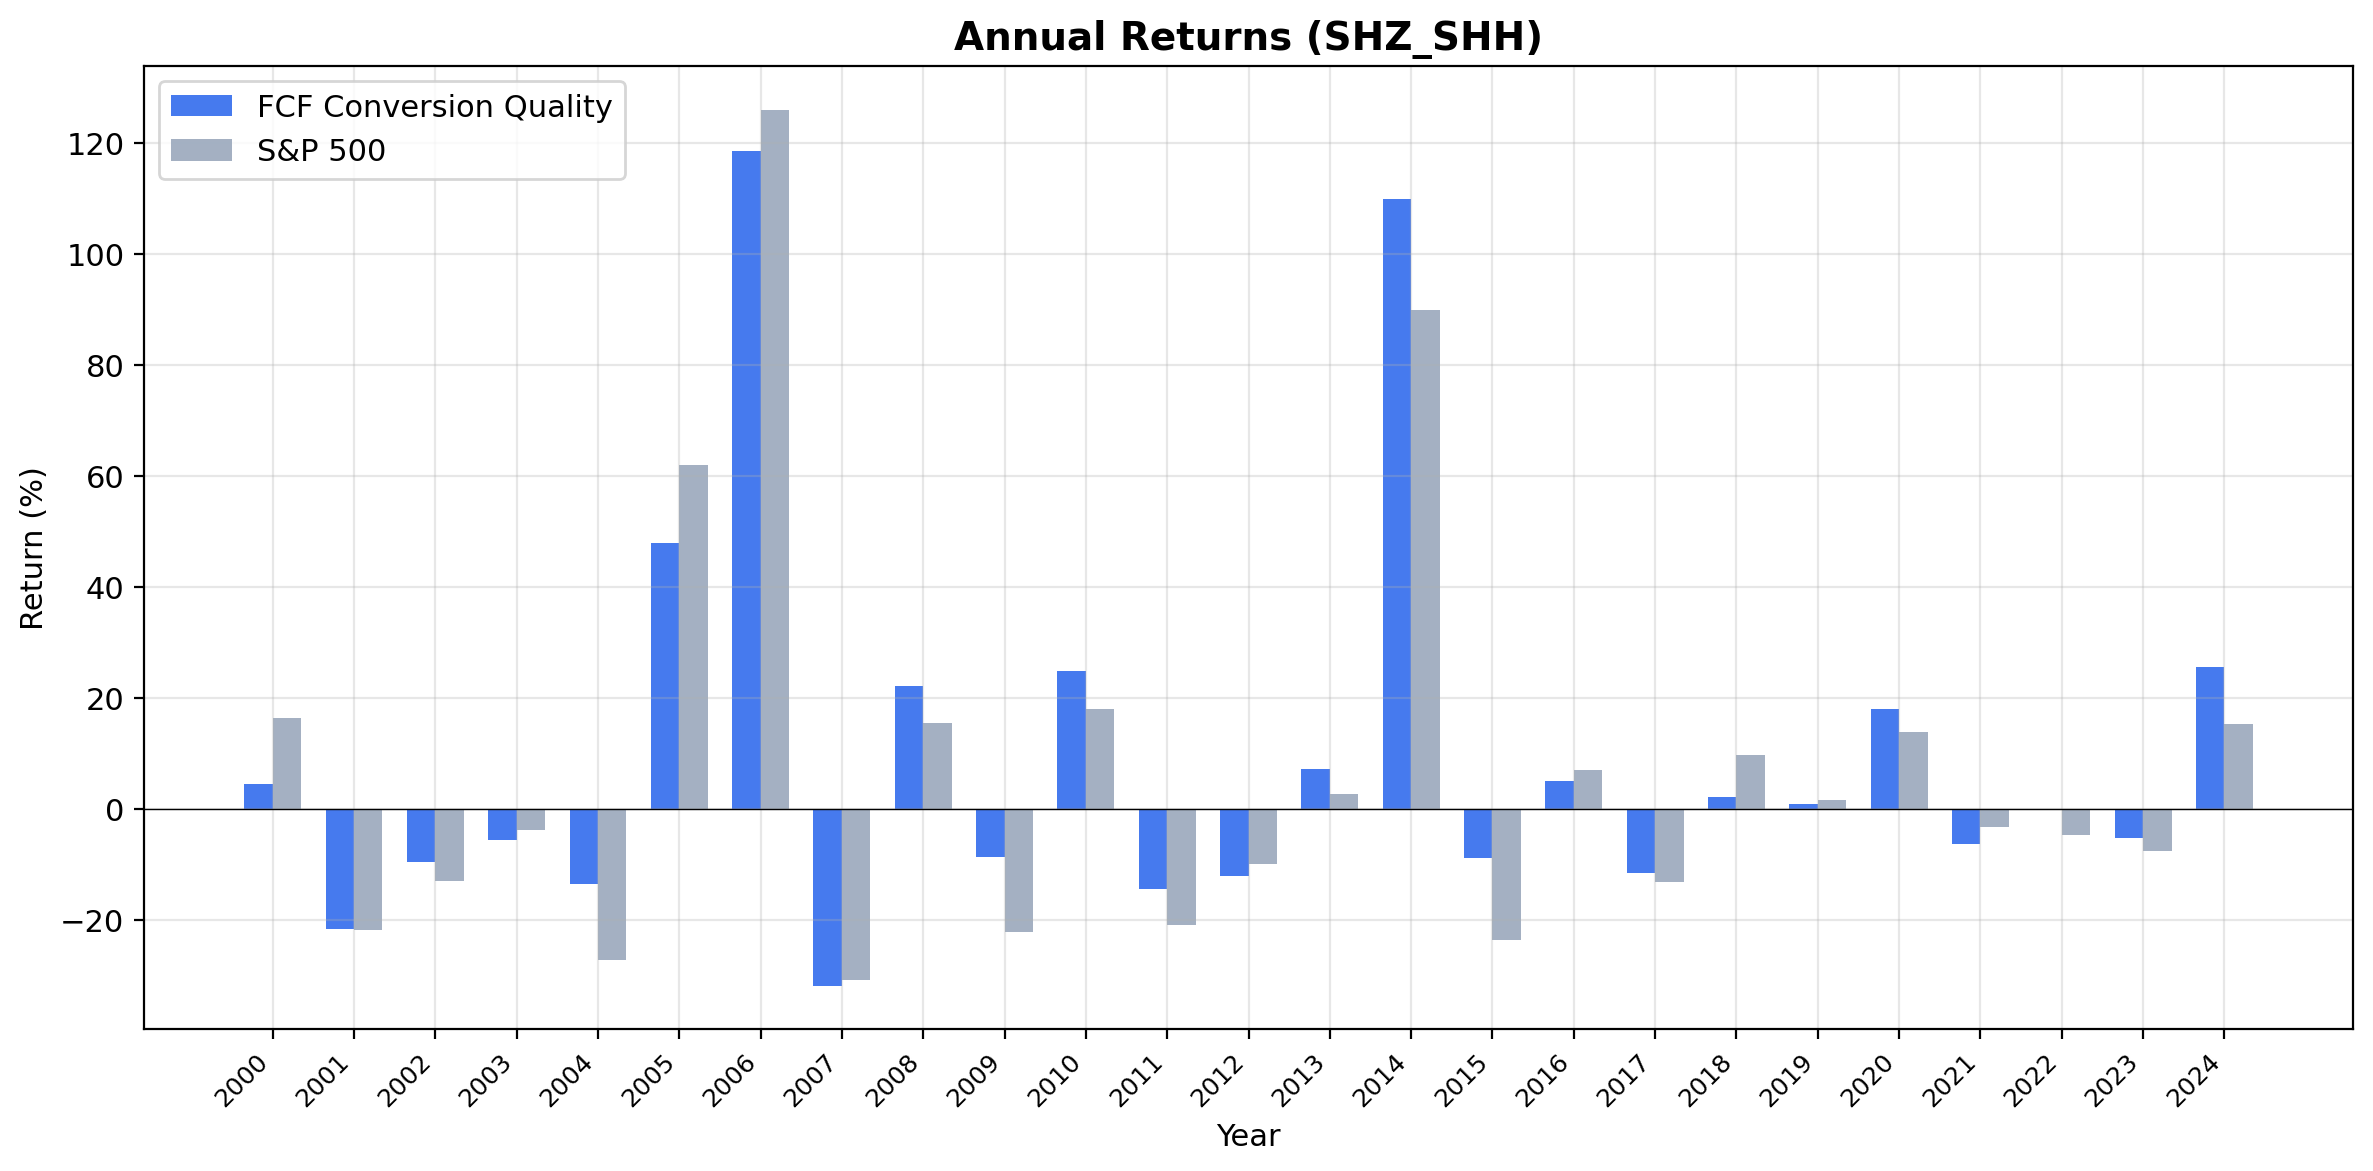
Annual Returns
| Year | Strategy | SSE Composite | Excess |
|---|---|---|---|
| 2006 | +118.7% | +126.0% | -7.3% |
| 2008 | +22.1% | +15.4% | +6.7% |
| 2009 | -8.7% | -22.1% | +13.4% |
2006 was the year of China's massive A-share rally. The strategy gained 118.7%, nearly matching the SSE Composite's 126.0%. Policy-driven liquidity, expanding margin lending, and retail speculation lifted everything. FCF quality stocks participated almost fully because the rally was broad-based.
2008 and 2009 tell a more useful story. In 2008, the strategy returned +22.1% while the SSE Composite managed +15.4%. In 2009, when the index fell 22.1%, the strategy lost only 8.7%. That's the FCF quality filter working: companies with real cash generation held up better through China's volatile swings.
The 60% win rate means the strategy beats its local benchmark more often than not. Combined with the +2.83% excess CAGR, this is a strategy that adds consistent value over the SSE Composite rather than relying on a few blowout years.
Limitations
Extreme volatility. Max drawdown of -42.16% makes position sizing and risk management critical. China's boom-bust cycles produce wild swings even among cash-rich companies. Most investors can't stomach this level of variance.
Accounting quality concerns. Chinese accounting standards (CAS) have improved but still differ from US GAAP and IFRS in treatment of government subsidies, related-party transactions, and consolidation. FCF conversion ratios may not capture the same underlying quality as in Western markets.
State-owned enterprise dynamics. SOEs dominate the A-share market. Their cash flows are influenced by government policy, directed lending, and strategic priorities that don't follow the same logic as private-sector cash generation.
Capital controls. The CNY is managed, not freely floating. A US investor couldn't freely deploy capital into A-shares for most of this period (QFII quotas, Stock Connect launched 2014).
Survivorship bias. FMP data includes delisted stocks where available, but Chinese delistings often involve regulatory suspensions or restructurings that may not be fully captured.
Transaction costs are estimated. Chinese equity stamp duty (0.1% on sells), commissions, and settlement costs aren't individually modeled. The size-tiered approximation may understate actual costs.
Run It Yourself
Live screen:
python3 fcf-conversion/screen.py --preset china
Full backtest:
python3 fcf-conversion/backtest.py --preset china --output results.json --verbose
All exchanges:
python3 fcf-conversion/backtest.py --global --output results/exchange_comparison.json
Code: github.com/ceta-research/backtests/tree/main/fcf-conversion
Part of a Series
This is the China edition of our FCF Conversion Quality analysis. We ran the same screen on 15 exchanges globally:
- US: +1.83% excess, 48% down capture, the benchmark result
- Germany: +3.89% excess, zero cash periods, industrial cash discipline
- Switzerland: Highest Sharpe ratio (0.486), best risk-adjusted returns
- Global comparison: all 15 exchanges side by side
Data: Ceta Research (FMP financial data warehouse), 2000-2025. Execution: next-day close (market-on-close). Benchmark: SSE Composite. Full methodology: github.com/ceta-research/backtests/blob/main/METHODOLOGY.md
Past performance does not guarantee future results. This is research content, not investment advice.


