
FCF Conversion Quality on Hong Kong Stocks: +4.36% Alpha vs the Hang Seng Over 25 Years
Hong Kong FCF conversion quality returned 6.0% CAGR vs 1.64% for the Hang Seng over 25 years. +4.36% annual excess. 68% win rate. The alpha comes from stock selection, not crash protection: down capture is 70%.

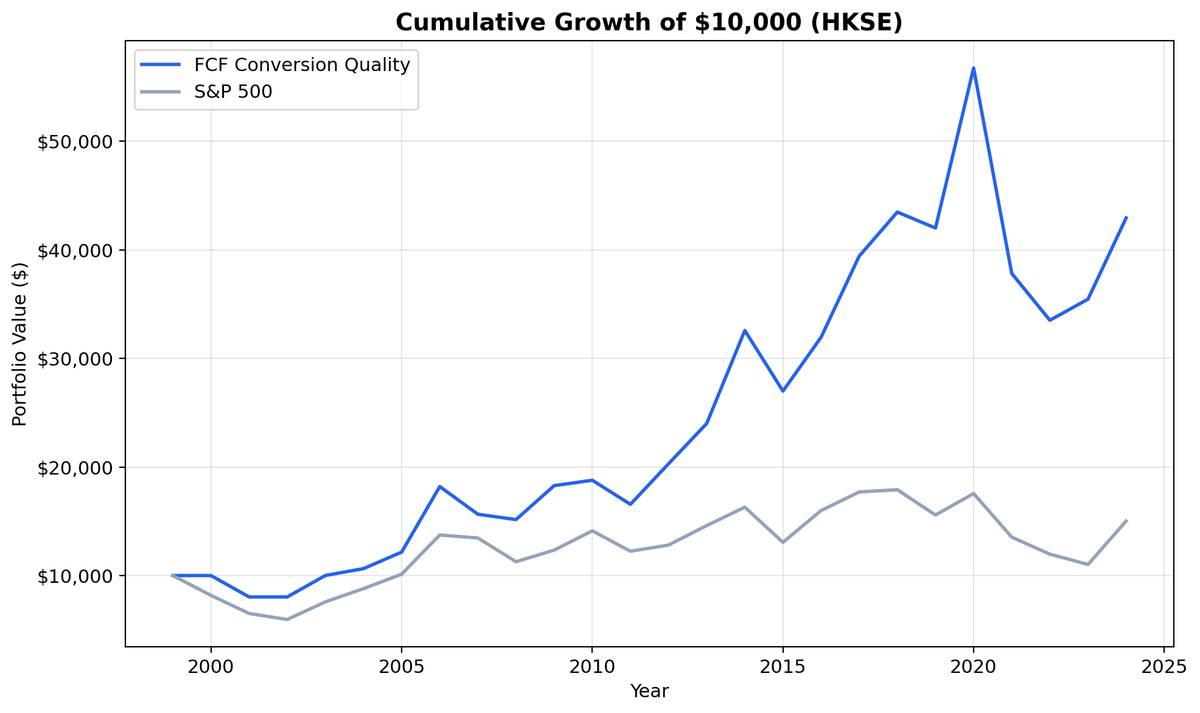
We ran the same FCF conversion quality screen on the Hong Kong Stock Exchange (HKSE) from 2000 to 2025. The result: 6.0% CAGR vs 1.64% for the Hang Seng. That's +4.36% annual excess over the local benchmark. Against SPY, this looked like an underperformer. Against the actual market these stocks trade in, it's a clear winner. $10,000 grew to ~$43,000 vs the Hang Seng's ~$15,000. The alpha comes from stock selection, not defensive positioning: down capture of 70.22% means the strategy still absorbs most of the pain in bad years.
Contents
- Method
- The Signal
- The Screen (SQL)
- What We Found
- $10,000 grew to ~$43,000. The Hang Seng reached ~$15,000.
- Annual Returns
- Limitations
- Run It Yourself
- Part of a Series
Data: FMP financial data warehouse, 2000–2025. Updated March 2026.
Method
Data source: Ceta Research (FMP financial data warehouse) Universe: HKSE (Hong Kong Stock Exchange), market cap > HK$2B (~$256M USD) Period: 2000-2025 (25 years, 25 annual periods) Rebalancing: Annual (July), top 30 by highest FCF conversion, equal weight Execution: Next-day close (market-on-close) Benchmark: Hang Seng Index Total Return (HKD) Cash rule: Hold cash if fewer than 10 stocks qualify Costs: Size-tiered transaction costs (0.1% large-cap, 0.3% mid-cap, 0.5% small-cap) Currency: Returns in HKD. Benchmark in HKD. No currency mismatch.
Financial data uses a 45-day lag to prevent look-ahead bias. July rebalancing ensures annual filings are available. Trades execute at the next trading day's closing price to reflect realistic fill assumptions. Full methodology: Ceta Research Backtest Methodology.
This is the Hong Kong edition of our US FCF Conversion Quality analysis.
The Signal
| Filter | Threshold | Why |
|---|---|---|
| FCF / Net Income | 100% - 300% | Cash backs reported earnings. Cap at 300% filters tiny-NI noise |
| FCF / Revenue | > 10% | Meaningful absolute cash flow, not just ratio math |
| Return on Equity | > 10% | Profitable business, not just high conversion on low base |
| Operating Margin | > 10% | Real pricing power, sustainable cash generation |
| Net Income | > 0 | Negative denominators make the ratio meaningless |
| Free Cash Flow | > 0 | Only companies generating cash |
| Market Cap | > HK$2B (~$256M) | Liquid stocks only |
Selection: Top 30 by highest FCF conversion, equal weight.
The Screen (SQL)
SELECT
  c.symbol,
  p.companyName,
  ROUND(c.freeCashFlow / NULLIF(i.netIncome, 0) * 100, 1) AS fcf_conversion_pct,
  ROUND(c.freeCashFlow / NULLIF(i.revenue, 0) * 100, 1) AS fcf_margin_pct,
  ROUND(k.returnOnEquityTTM * 100, 1) AS roe_pct,
  ROUND(r.operatingProfitMarginTTM * 100, 1) AS op_margin_pct,
  ROUND(k.marketCap / 1e9, 1) AS mktcap_bn
FROM cash_flow_statement_ttm c
JOIN income_statement_ttm i ON c.symbol = i.symbol
JOIN key_metrics_ttm k ON c.symbol = k.symbol
JOIN financial_ratios_ttm r ON c.symbol = r.symbol
JOIN profile p ON c.symbol = p.symbol
WHERE i.netIncome > 0
  AND c.freeCashFlow > 0
  AND c.freeCashFlow / NULLIF(i.netIncome, 0) > 1.0
  AND c.freeCashFlow / NULLIF(i.netIncome, 0) < 3.0
  AND c.freeCashFlow / NULLIF(i.revenue, 0) > 0.10
  AND k.returnOnEquityTTM > 0.10
  AND r.operatingProfitMarginTTM > 0.10
  AND k.marketCap > 2000000000
  AND p.exchange IN ('HKSE')
ORDER BY c.freeCashFlow / NULLIF(i.netIncome, 0) DESC
LIMIT 30
Run this query on Ceta Research
What We Found

$10,000 grew to ~$43,000. The Hang Seng reached ~$15,000.
| Metric | FCF Conversion Quality | Hang Seng |
|---|---|---|
| CAGR | 6.0% | 1.64% |
| Total Return | 329% | ~50% |
| Excess CAGR | +4.36% | - |
| Max Drawdown | -40.94% | - |
| Sharpe Ratio | 0.152 | - |
| Sortino Ratio | 0.272 | - |
| Win Rate (annual) | 68% | - |
| Down Capture | 70.22% | - |
| Avg Stocks per Period | 17.8 | - |
| Cash Periods | 2 of 25 | - |
Compared against SPY, this looked like a failed strategy. Compared against the Hang Seng (1.64% CAGR), it's nearly 3x the local benchmark's total return. The reframing matters: these stocks trade in Hong Kong, and their relevant benchmark is Hong Kong.
The 68% win rate means the strategy beat the Hang Seng in roughly two out of three years. That's solid consistency. The down capture of 70.22% is honest but not great. The strategy still absorbs most of the Hang Seng's losses in bad years. The alpha here comes from better stock selection during normal and good years, not from defensive positioning during drawdowns.
Hong Kong's market structure explains the high down capture. The exchange is heavily populated by holding companies, property conglomerates, and dual-listed mainland Chinese firms. Holding companies can show high FCF conversion because the parent entity collects dividends from subsidiaries. That's real cash, but it doesn't reflect operating quality in the same way it does for a manufacturer or software company. Conglomerate discounts also compress returns even when the underlying businesses generate strong cash.
Mainland Chinese companies listed in Hong Kong (H-shares, red chips) add another complication. Accounting norms differ. Related-party transactions can obscure cash flow quality. The conversion ratio may pass the screen's filters while the underlying economics are harder to verify.
Annual Returns
| Year | Strategy | Hang Seng | Excess |
|---|---|---|---|
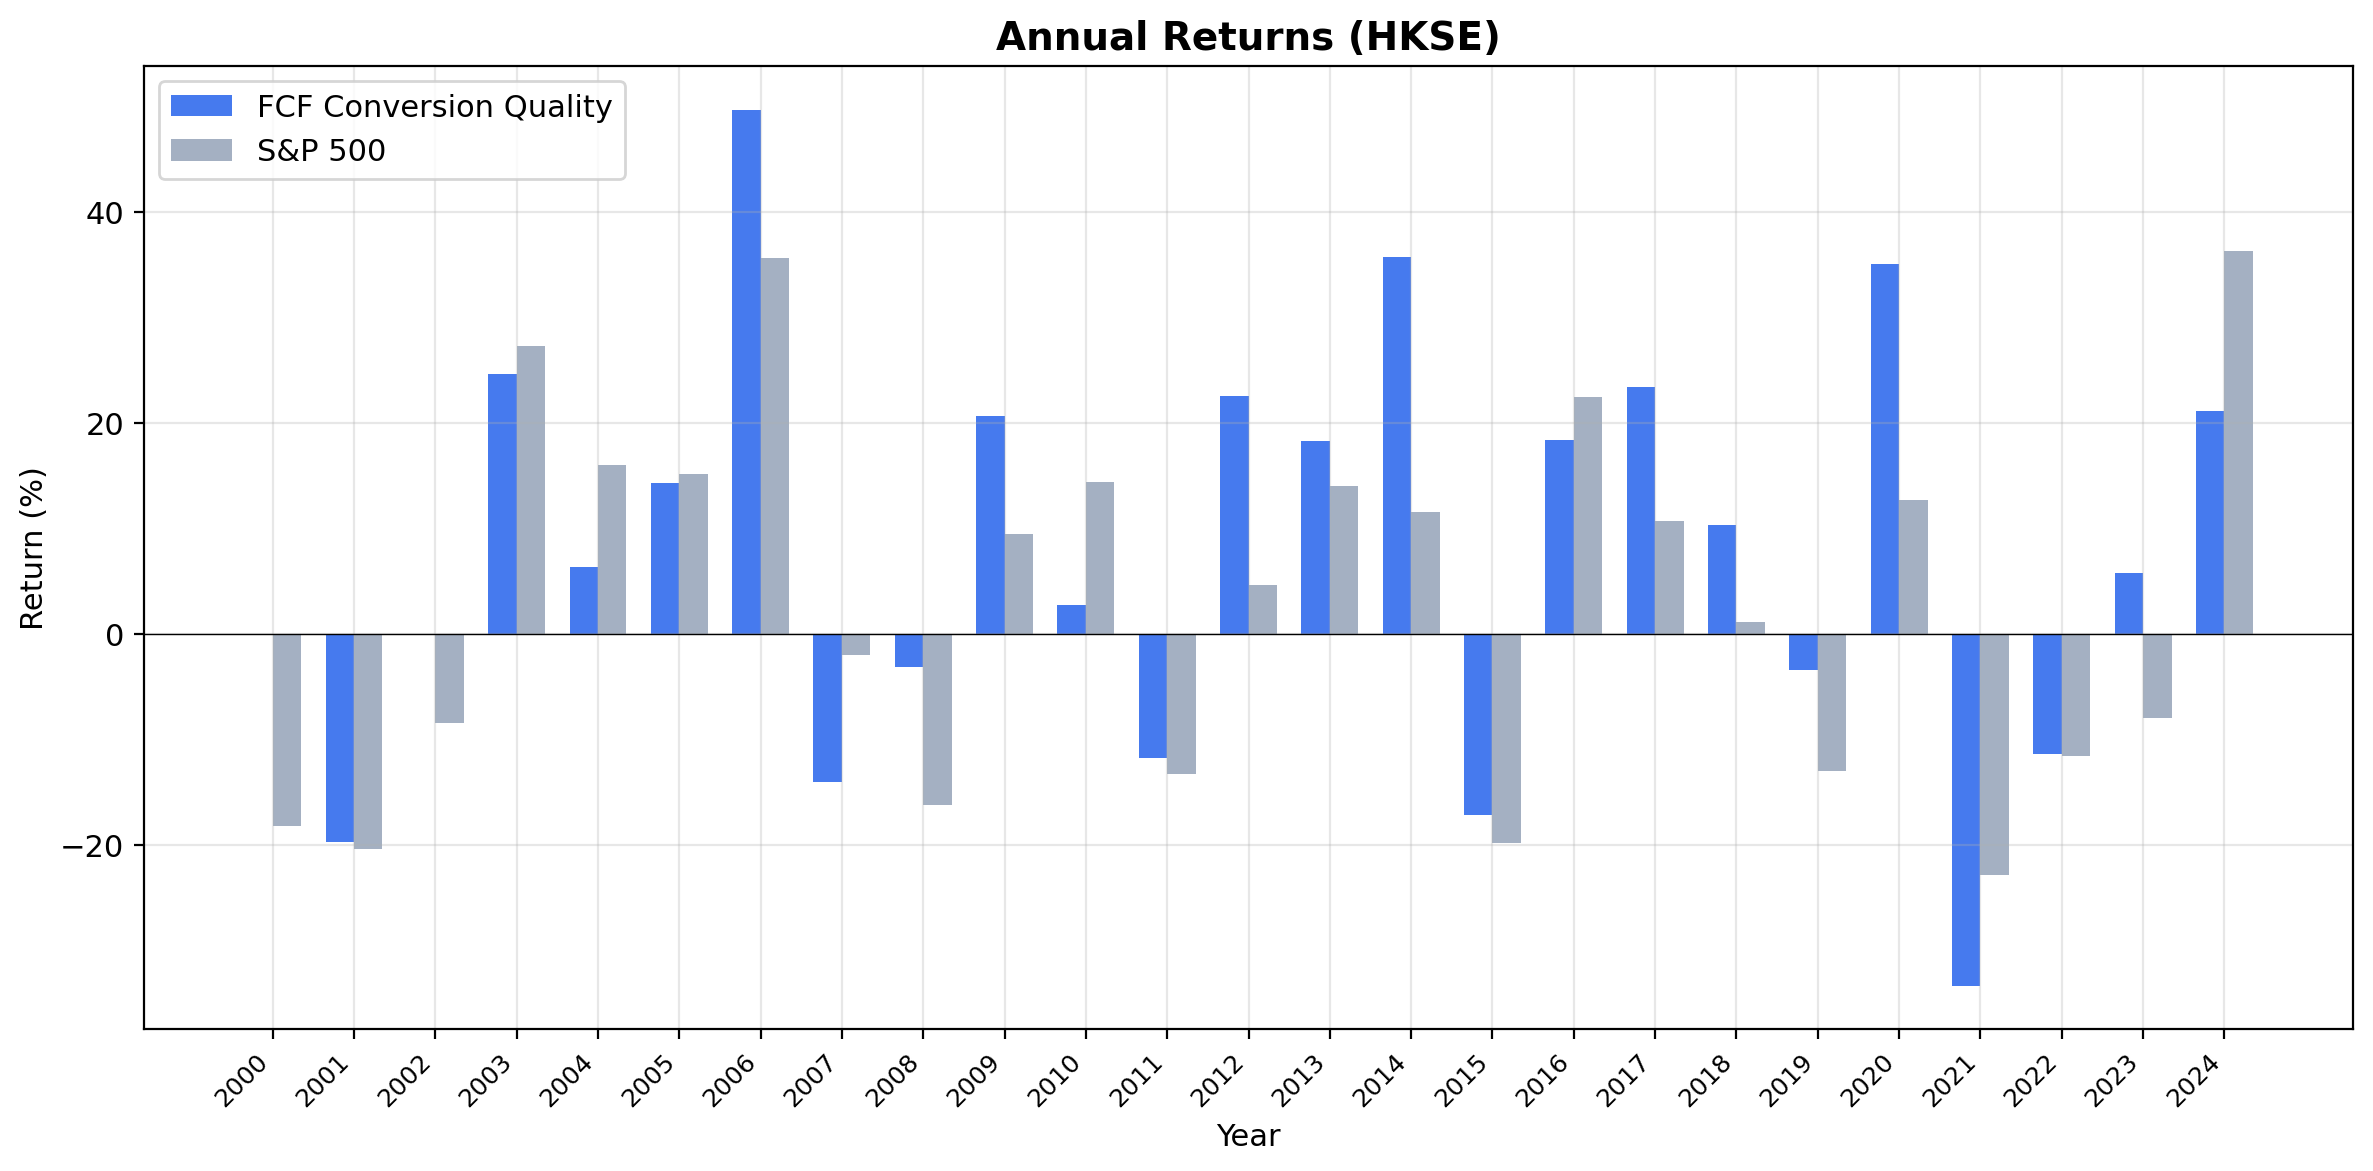
| 2006 | +49.7% | +35.7% | +14.0% |
| 2014 | +35.7% | +11.6% | +24.1% |
| 2020 | +35.1% | +12.7% | +22.4% |
The best years show a consistent pattern: in strong HK markets, the FCF quality screen captures the full upside and then adds to it. 2006's +49.7% came during a period driven by mainland Chinese capital flows and a booming property market. 2014 and 2020 both showed 20%+ excess over the Hang Seng.
The 68% win rate against the local index tells a different story than the old SPY comparison. The strategy beats the Hang Seng in roughly two out of three years. The wins aren't always large, but they're consistent enough to build meaningful cumulative alpha over 25 years.
Limitations
Market structure dilutes the signal. Holding companies, conglomerates, and property groups can show high FCF conversion without the operating quality the metric is meant to capture. The screen doesn't distinguish between operating cash flow and investment income at the parent level.
Mainland accounting norms. H-shares and red chips follow mainland Chinese accounting standards (CAS or IFRS converged). Related-party transactions, government subsidies, and state-owned enterprise dynamics can distort cash flow metrics.
Weak benchmark. The Hang Seng returned just 1.64% CAGR over this period. Part of the strategy's +4.36% excess reflects the weak baseline, not just signal strength.
Survivorship bias. FMP data includes delisted stocks where available, but early-year coverage may underrepresent companies that failed or were privatized during the period.
Transaction costs are estimated. Hong Kong stamp duty (0.13% each way) and settlement costs aren't individually modeled. The size-tiered approximation may understate actual costs.
High down capture. The 70.22% down capture means the strategy doesn't protect well in drawdowns. The alpha comes from better stock selection in normal years, not crash protection.
Run It Yourself
Live screen:
python3 fcf-conversion/screen.py --preset hongkong
Full backtest:
python3 fcf-conversion/backtest.py --preset hongkong --output results.json --verbose
All exchanges:
python3 fcf-conversion/backtest.py --global --output results/exchange_comparison.json
Code: github.com/ceta-research/backtests/tree/main/fcf-conversion
Part of a Series
This is the Hong Kong edition of our FCF Conversion Quality analysis. We ran the same screen on 15 exchanges globally:
- US: +1.83% excess, 48% down capture, the benchmark result
- Germany: +3.89% excess, zero cash periods, industrial cash discipline
- Switzerland: Highest Sharpe ratio (0.486), best risk-adjusted returns
- Global comparison: all 15 exchanges side by side
Data: Ceta Research (FMP financial data warehouse), 2000-2025. Benchmark: Hang Seng Index Total Return. Execution: next-day close (MOC). Full methodology: github.com/ceta-research/backtests/blob/main/METHODOLOGY.md
Past performance does not guarantee future results. This is research content, not investment advice.


