
FCF Conversion Quality on Thai Stocks: -1.83% vs SET Index, Honest Underperformance
We ran our FCF Conversion screen on SET stocks from 2000-2025. 3.30% CAGR in THB, trailing the SET Index (5.13%) by 1.83%. 40% win rate, 80.54% down capture. $10K grew to ~$23K vs ~$35K for the index. The signal doesn't work well here.


We ran our FCF Conversion Quality screen on SET-listed stocks from 2000 to 2025. The result: 3.30% CAGR in Thai Baht, trailing the SET Index (5.13% CAGR) by 1.83% annually. $10,000 grew to ~$23K vs ~$35K for the index. We're not going to dress that up. The strategy doesn't work well in Thailand. Down capture of 80.54% means you're absorbing most of the index's losses with a 40% win rate. Honest underperformance.
Contents
- Method
- The Screen (SQL)
- What We Found
- $10,000 grew to ~$23K in THB. The SET Index reached ~$35K.
- Annual Returns
- Thailand's Cash Flow Landscape
- When It Works
- When It Struggles
- Currency Context
- Limitations
- Run It Yourself
- Part of a Series
Data: FMP financial data warehouse, 2000–2025. Updated March 2026.
Method
Data source: Ceta Research (FMP financial data warehouse) Universe: SET (Stock Exchange of Thailand), market cap > THB 10B (~$286M USD) Period: 2000-2025 (25 years, 25 annual periods) Rebalancing: Annual (July), top 30 by highest FCF conversion, equal weight Execution: Next-day close (market-on-close) Benchmark: SET Index (local index, THB) Cash rule: Hold cash if fewer than 10 stocks qualify Costs: Size-tiered transaction costs (0.1% large-cap, 0.3% mid-cap, 0.5% small-cap)
Financial data uses a 45-day lag to prevent look-ahead bias. July rebalancing ensures annual filings are available. Trades execute at the next trading day's close to avoid same-day entry bias. Returns are in THB. Full methodology: Ceta Research Backtest Methodology.
For a detailed explanation of FCF Conversion as a quality signal and the academic research behind it, see the US FCF Conversion Quality post.
The Screen (SQL)
SELECT
  c.symbol, p.companyName,
  ROUND(c.freeCashFlow / NULLIF(i.netIncome, 0) * 100, 1) AS fcf_conversion_pct,
  ROUND(c.freeCashFlow / NULLIF(i.revenue, 0) * 100, 1) AS fcf_margin_pct,
  ROUND(k.returnOnEquityTTM * 100, 1) AS roe_pct,
  ROUND(r.operatingProfitMarginTTM * 100, 1) AS op_margin_pct,
  ROUND(k.marketCap / 1e9, 1) AS mktcap_bn
FROM cash_flow_statement_ttm c
JOIN income_statement_ttm i ON c.symbol = i.symbol
JOIN key_metrics_ttm k ON c.symbol = k.symbol
JOIN financial_ratios_ttm r ON c.symbol = r.symbol
JOIN profile p ON c.symbol = p.symbol
WHERE i.netIncome > 0 AND c.freeCashFlow > 0
  AND c.freeCashFlow / NULLIF(i.netIncome, 0) > 1.0
  AND c.freeCashFlow / NULLIF(i.netIncome, 0) < 3.0
  AND c.freeCashFlow / NULLIF(i.revenue, 0) > 0.10
  AND k.returnOnEquityTTM > 0.10
  AND r.operatingProfitMarginTTM > 0.10
  AND k.marketCap > 10e9  -- ฿10B (~$286M USD)
  AND p.exchange IN ('SET')
ORDER BY c.freeCashFlow / NULLIF(i.netIncome, 0) DESC
LIMIT 30
Run this query on Ceta Research
What We Found
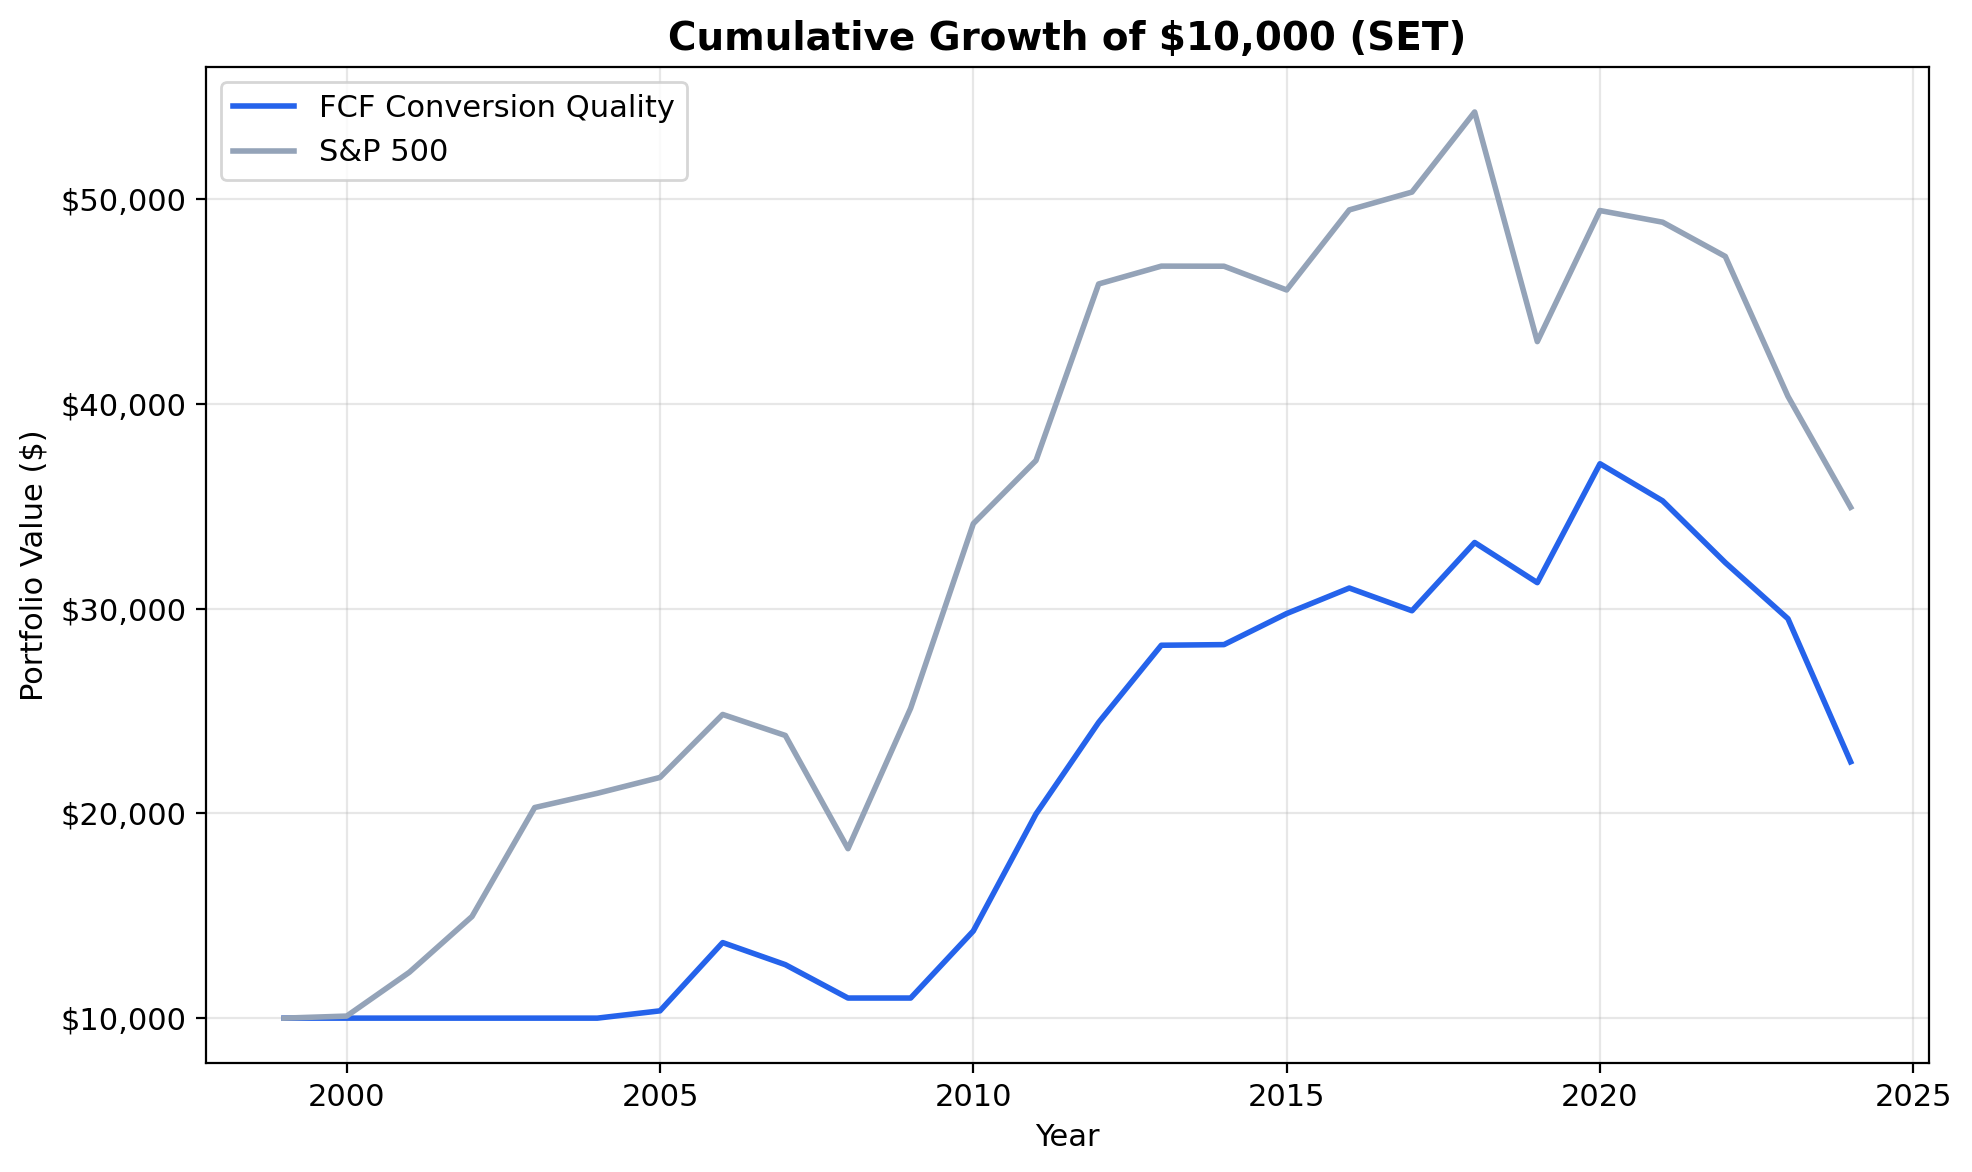
$10,000 grew to ~$23K in THB. The SET Index reached ~$35K.
| Metric | FCF Conversion (THB) | SET Index |
|---|---|---|
| CAGR | 3.30% | 5.13% |
| Total Return | 125% | ~250% |
| Excess CAGR | -1.83% | - |
| Max Drawdown | -39.26% | - |
| Sharpe Ratio | 0.054 | - |
| Sortino Ratio | 0.104 | - |
| Down Capture | 80.54% | - |
| Win Rate (annual) | 40% | - |
| Avg Stocks per Period | 20.4 | - |
| Cash Periods | 6 of 25 | - |
The Sharpe ratio of 0.054 is barely above zero. The Sortino of 0.104 isn't much better. This isn't a strategy that generated attractive risk-adjusted returns in Thailand over 25 years.
Down capture of 80.54% is the problem. In years when the SET Index falls, the portfolio absorbs most of the losses. That's the opposite of what a quality screen should do. Combined with a 40% win rate and -1.83% excess CAGR, the signal doesn't separate winners from losers well enough in Thailand's market structure.
The 6 cash periods and 20.4 average stocks show the universe isn't thin. There are qualifying companies. The issue is that the ones passing the screen don't outperform the broad SET Index.
Annual Returns
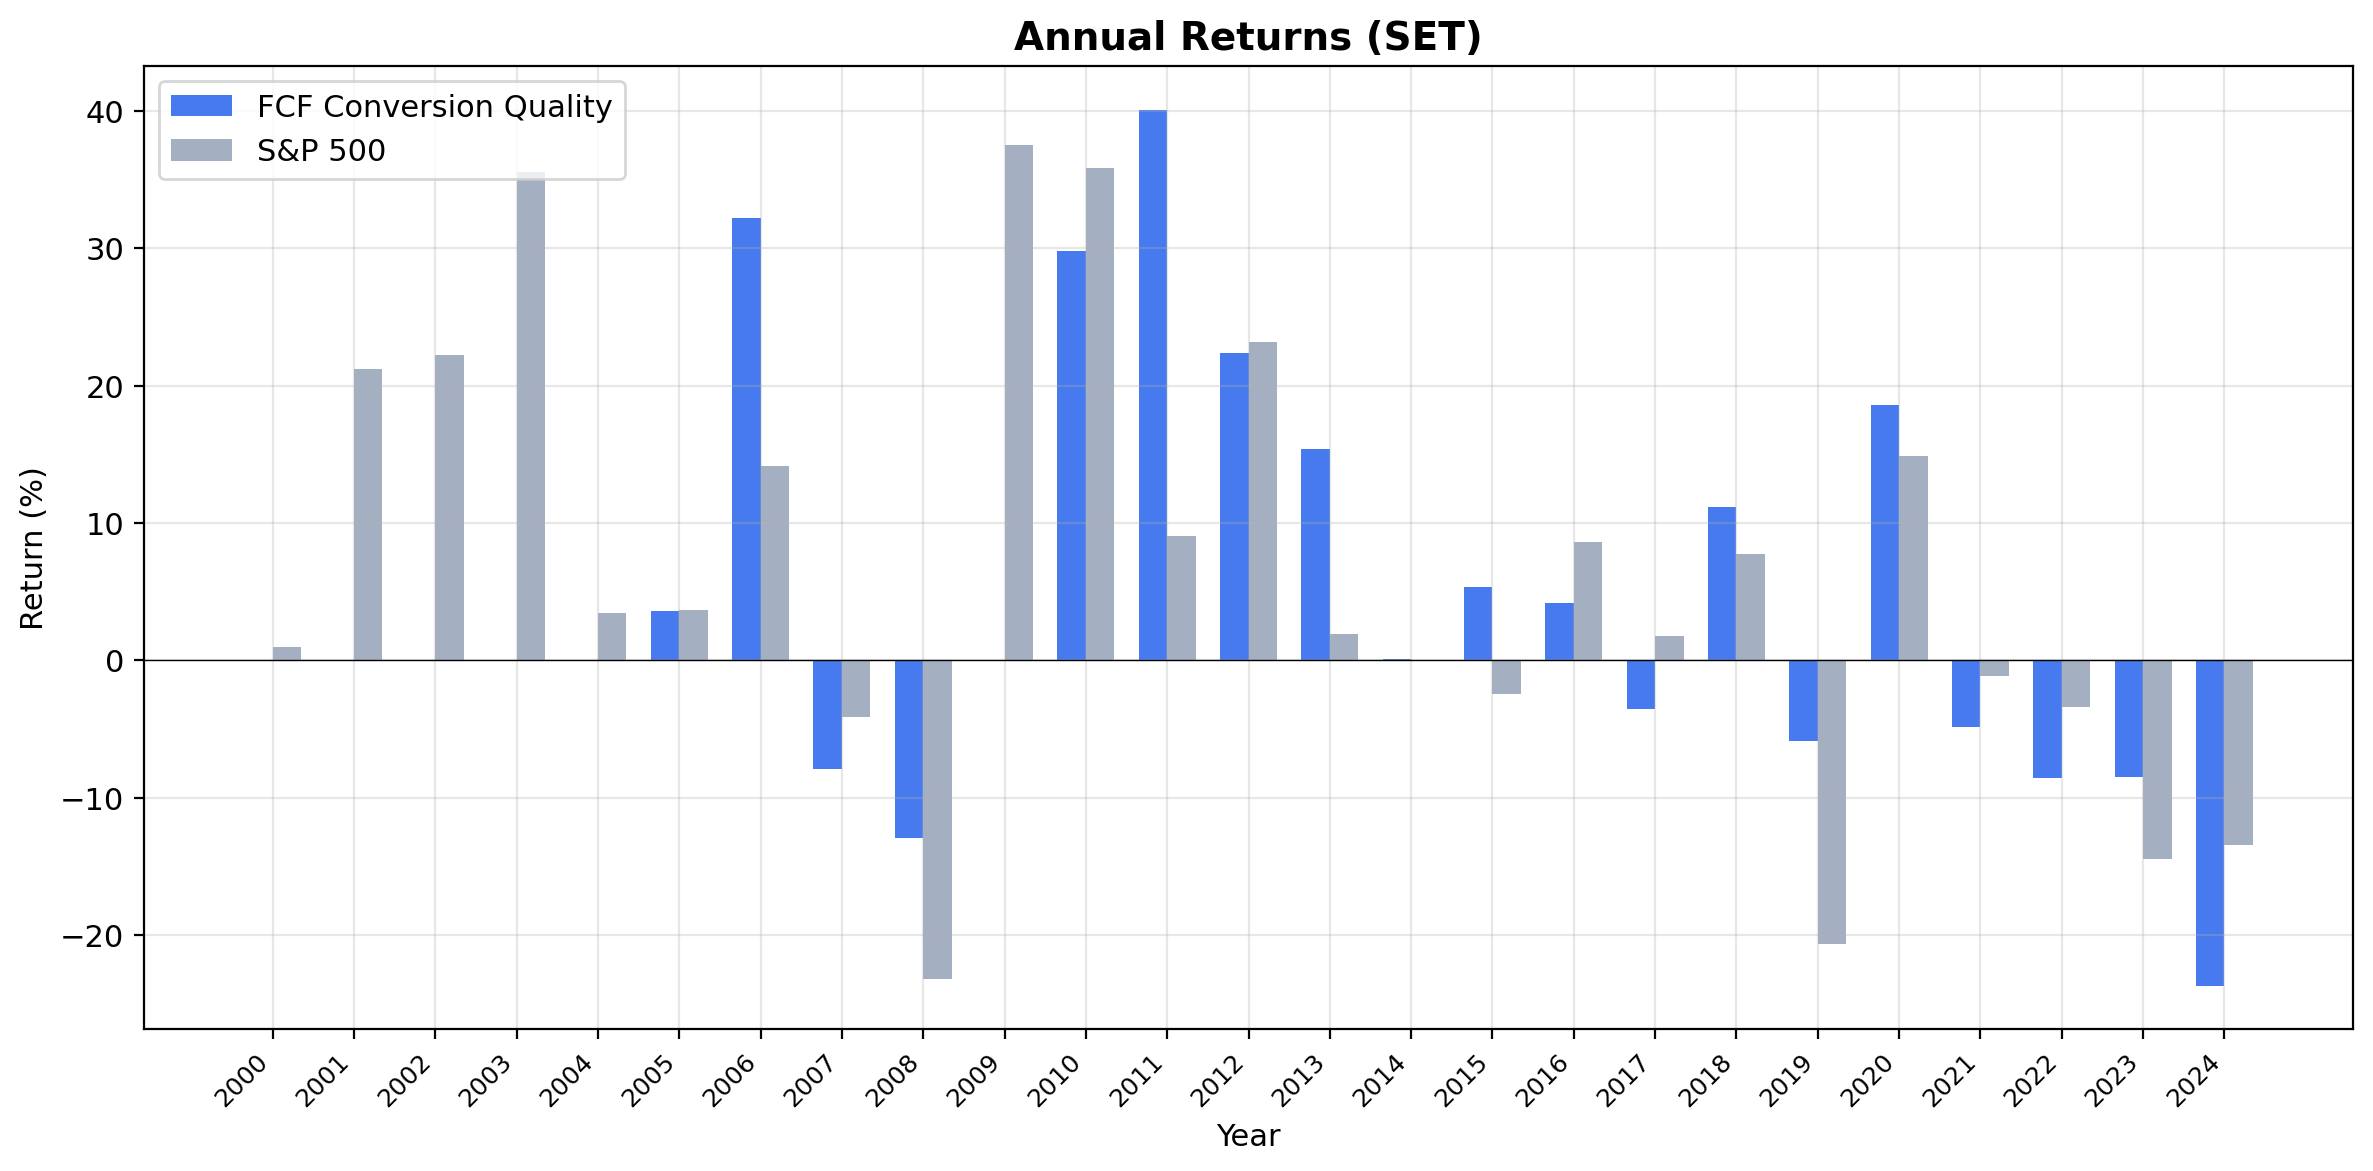
The annual return pattern tells a consistent story: the strategy trails the SET Index in most years and doesn't provide meaningful downside protection when the index drops. The 80.54% down capture confirms this. In down years, you're absorbing most of the pain.
The 6 cash periods (mostly early years with thin FMP data coverage) drag compound returns. When invested, the strategy generates positive absolute returns most of the time, but the SET Index generates more.
Thailand's Cash Flow Landscape
Thailand's equity market is smaller and more concentrated than the major Asian exchanges. The SET has a mix of banks, energy companies, consumer conglomerates, and property developers. The companies passing our FCF Conversion screen tend to be:
Consumer conglomerates. Thailand's large consumer-facing companies (retail, food, beverages) generate consistent operating cash flows from domestic demand. These businesses have predictable revenue and manageable capex.
Energy and utilities. Thai energy companies with toll-road-style cash flow profiles often pass the FCF margin and conversion filters. Their earnings are backed by physical asset revenue.
Healthcare. Thailand's growing medical tourism industry has produced companies with high margins and strong cash conversion. Hospital operators in particular tend to score well.
The average of 20.4 stocks per year means the signal consistently found qualifying companies. Thailand isn't a market where the screen runs dry. The underperformance is about the Thai market's overall trajectory relative to US equities, not a lack of investable companies.
When It Works
Crisis recovery. Companies with cash reserves capitalize on disruptions. The 2011 flood result is the clearest example. Any future shock to Thailand's economy would likely produce a similar pattern: cash-rich survivors outperform.
Domestic demand cycles. When Thai consumer spending strengthens, the consumer conglomerates in the portfolio benefit disproportionately. Their cash generation accelerates with revenue.
Baht stability. In periods of currency calm, the underlying stock selection has a better chance of showing through.
When It Struggles
Political uncertainty. Thailand has experienced multiple coups and constitutional crises over this period. Political instability depresses the entire market, and quality screens don't protect against country-level risk.
Export weakness. When global demand for Thai exports (electronics, autos, agriculture) softens, even cash-rich companies see revenue pressure.
High down capture. 80.54% down capture means the strategy doesn't protect well in downturns. The quality filters aren't selecting companies that hold up better than the index.
Currency Context
Both the strategy and the SET Index benchmark are in Thai Baht, so the comparison is clean. No currency mismatch to worry about.
Limitations
Country risk. Thailand-specific political and economic risks dominate the return profile. No stock-level signal can offset persistent country-level headwinds.
Cash drag. 6 of 25 periods in cash. Nearly a quarter of the backtest was uninvested.
High down capture. 80.54% means the quality filter doesn't provide meaningful crash protection against the local index.
Survivorship bias. Delisted Thai companies aren't fully captured in early years.
Smaller market. With 20.4 average stocks qualifying, a single large position turning bad can materially impact annual returns.
Run It Yourself
Live screen:
python3 fcf-conversion/screen.py --preset thailand
Full backtest:
python3 fcf-conversion/backtest.py --preset thailand --output results.json --verbose
Code: github.com/ceta-research/backtests/tree/main/fcf-conversion
Part of a Series
This is the Thailand edition of our FCF Conversion Quality analysis. We ran the same screen on 15 exchanges globally:
- FCF Conversion on US Stocks (NYSE + NASDAQ + AMEX) - 9.68% CAGR, the baseline
- India: +6.13% excess vs Sensex, best absolute return at 18.18% CAGR, best absolute return
- Japan: corporate governance reforms meet FCF quality signal
- Taiwan: lowest drawdown and volatility of any exchange
- Global comparison: all 15 exchanges side by side
Data: Ceta Research (FMP financial data warehouse), 2000-2025. Execution: next-day close (market-on-close). Benchmark: SET Index. Returns in THB. Full methodology: github.com/ceta-research/backtests/blob/main/METHODOLOGY.md
Past performance does not guarantee future results. This is research content, not investment advice.


