
FCF Yield Screen on Hong Kong Stocks: 25-Year Backtest
We screened for high FCF yield on Hong Kong Stock Exchange stocks from 2000 to 2025. 10.22% CAGR, +8.58% excess over Hang Seng. In 2008, the portfolio lost only 5.5% while Hang Seng fell 16%. 72% win rate, 27% down capture. Hang Seng returned just 1.64% annually over the same 25 years.

We screened for high free cash flow yield on the Hong Kong Stock Exchange (HKSE) from 2000 to 2025. The portfolio returned 10.22% annually against the Hang Seng Index, a +8.58% annual excess over 25 years. The Hang Seng returned 1.64% annually over the same period. Win rate: 72% of years.
Contents
- Method
- The Screen
- Live Screen (SQL)
- Results
- When It Works
- When It Fails
- Full Annual Returns
- Limitations
- Run It Yourself
- Takeaway
- References
During the 2008 financial crisis, the HKSE FCF yield portfolio lost 5.5%. The Hang Seng lost 16.2%.
Returns are in HKD, which maintains a narrow peg to the USD (7.75-7.85 HKD/USD). Currency effects are minimal.
Data: FMP financial data warehouse, 2000–2025. Updated March 2026.
Method
Data source: Ceta Research (FMP financial data warehouse) Universe: Hong Kong Stock Exchange (HKSE), market cap > HK$5B Period: 2000-2025 (25 annual rebalance periods, 5 cash periods 2000-2004) Rebalancing: Annual (July), equal weight top 30 by highest FCF yield Benchmark: Hang Seng Index Total Return (^HSI, HKD) Cash rule: Hold cash if fewer than 10 stocks qualify Transaction costs: Size-tiered model Data quality guards: FCF yield capped at 50%
Historical financial data with 45-day lag to prevent look-ahead bias. Full methodology: backtests/METHODOLOGY.md
The Screen
| Criterion | Metric | Threshold | Why |
|---|---|---|---|
| Cash generation | FCF Yield | 8% - 50% | Genuinely cheap; cap removes data artifacts |
| Profitability | Return on Equity | > 10% | Business earns real returns on capital |
| Debt safety | Interest Coverage | > 3x | Can service debt comfortably |
| Pricing power | Operating Margin | > 10% | Not dependent on one-time cash events |
| Size | Market Cap | > HK$5B | Reliable data, investable |
Live Screen (SQL)
SELECT
    k.symbol,
    p.companyName,
    p.sector,
    k.freeCashFlowYieldTTM * 100 AS fcf_yield_pct,
    k.returnOnEquityTTM * 100 AS roe_pct,
    f.interestCoverageRatioTTM AS interest_coverage,
    f.operatingProfitMarginTTM * 100 AS op_margin_pct,
    k.marketCap / 1e9 AS mktcap_bn
FROM key_metrics_ttm k
JOIN financial_ratios_ttm f ON k.symbol = f.symbol
JOIN profile p ON k.symbol = p.symbol
WHERE k.freeCashFlowYieldTTM > 0.08
  AND k.freeCashFlowYieldTTM < 0.50
  AND k.returnOnEquityTTM > 0.10
  AND f.interestCoverageRatioTTM > 3
  AND f.operatingProfitMarginTTM > 0.10
  AND k.marketCap > 5000000000
  AND p.exchange IN ('HKSE')
ORDER BY k.freeCashFlowYieldTTM DESC
LIMIT 30
Results
| Metric | Portfolio | Hang Seng |
|---|---|---|
| CAGR | 10.22% | 1.64% |
| Total Return | 1,040% | 50% |
| Max Drawdown | -21.2% | -40.5% |
| Volatility | 23.4% | -- |
| Sharpe Ratio | 0.309 | -- |
| Sortino Ratio | 0.930 | -- |
| Down Capture | 26.8% | -- |
| Up Capture | 150.8% | -- |
| Win Rate (vs Hang Seng) | 72% | -- |
| Cash Periods | 5/25 | -- |
| Avg Stocks | 23.4 | -- |
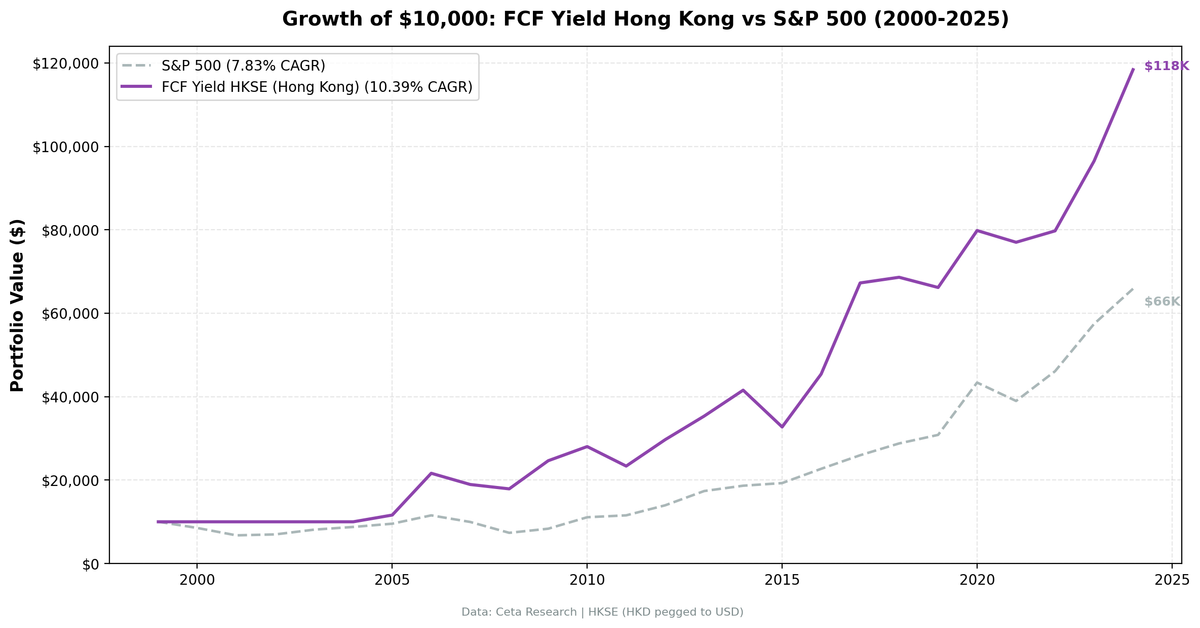
$10,000 in 2000 grew to $113,983 in HKD. Hang Seng: $15,020.
The Hang Seng Index returned just 1.64% annually over 25 years, a period of stagnant Hong Kong equity markets punctuated by sharp crises. The FCF yield screen found companies generating enough cash to navigate that environment. Down capture of 26.8% means the portfolio absorbed only 1 in 4 points of Hang Seng declines. Up capture of 150.8% means it captured half again as much of recoveries. The 72% win rate (18 of 25 years) confirms this wasn't luck: quality cash generators consistently beat a flat Hong Kong index.
When It Works
2008-2009 (Financial Crisis): Strong protection.
| Year | Portfolio | Hang Seng | Excess |
|---|---|---|---|
| 2008 | -5.5% | -16.2% | +10.7% |
| 2009 | +37.7% | +9.5% | +28.2% |
-5.5% in one of the worst financial years in modern history. The quality filters worked exactly as designed: companies with FCF yield > 8%, interest coverage > 3x, and operating margins > 10% had the financial durability to weather 2008. The Hang Seng fell 16.2% as Hong Kong markets absorbed the global credit crisis. The FCF yield portfolio fell only 5.5%.
2006 (Hong Kong Bull Market): Best single year in the backtest.
+86.3% vs Hang Seng +35.7%. The Hang Seng had a genuine bull market in 2006. The FCF yield portfolio, concentrated in 23 quality cash generators, amplified the move significantly. This isn't a data artifact. Small concentrated portfolios can meaningfully exceed the index during strong markets.
2016-2017: Two consecutive exceptional years.
| Year | Portfolio | Hang Seng | Excess |
|---|---|---|---|
| 2016 | +38.7% | +22.4% | +16.3% |
| 2017 | +48.1% | +10.7% | +37.4% |
Two of the strongest excess return years in the backtest. 2017's +37.4% excess is the largest gap vs Hang Seng in the entire 25-year period. Hong Kong equities rallied, and the FCF yield screen captured the best of it.
When It Fails
2011 (-16.7% vs -13.3% for Hang Seng, -3.4% excess): The European debt crisis and concerns about China's growth hit Hong Kong. The FCF yield portfolio fell slightly harder than the Hang Seng that year.
2015 (-21.2% vs -19.9% for Hang Seng, -1.4% excess): The Chinese market crash of 2015 and resulting capital outflows hit HKSE stocks. This is the portfolio's maximum drawdown. The Hang Seng also fell 19.9%. The portfolio and the index moved together: when macro risk dominates, quality filters don't provide protection.
2024 (-13.6% excess): The portfolio gained +22.7% while the Hang Seng surged +36.3%. Hong Kong markets had a strong 2024 rally. The FCF yield screen, concentrated in mature cash generators, captured less than two-thirds of that move.
The worst periods align with Hong Kong-specific risks: China slowdown concerns, political events, and capital flow volatility. These are real risks for HKSE investors and no fundamental screen removes them.
Full Annual Returns
| Year | Portfolio | Hang Seng | Excess |
|---|---|---|---|
| 2000 | CASH | -18.2% | +18.2% |
| 2001 | CASH | -20.4% | +20.4% |
| 2002 | CASH | -8.5% | +8.5% |
| 2003 | CASH | +27.3% | -27.3% |
| 2004 | CASH | +16.0% | -16.0% |
| 2005 | +16.1% | +15.2% | +1.0% |
| 2006 | +86.3% | +35.7% | +50.6% |
| 2007 | -15.2% | -2.0% | -13.2% |
| 2008 | -5.5% | -16.2% | +10.7% |
| 2009 | +37.7% | +9.5% | +28.2% |
| 2010 | +13.8% | +14.4% | -0.6% |
| 2011 | -16.7% | -13.3% | -3.4% |
| 2012 | +26.6% | +4.7% | +21.9% |
| 2013 | +19.0% | +14.0% | +5.0% |
| 2014 | +17.7% | +11.6% | +6.1% |
| 2015 | -21.2% | -19.9% | -1.4% |
| 2016 | +38.7% | +22.4% | +16.3% |
| 2017 | +48.1% | +10.7% | +37.4% |
| 2018 | +1.8% | +1.2% | +0.7% |
| 2019 | -3.4% | -13.0% | +9.6% |
| 2020 | +20.6% | +12.7% | +8.0% |
| 2021 | -3.5% | -22.9% | +19.4% |
| 2022 | +3.5% | -11.6% | +15.1% |
| 2023 | +20.7% | -8.0% | +28.7% |
| 2024 | +22.7% | +36.3% | -13.6% |
Cash periods (2000-2004): insufficient qualifying HKSE stocks in the early period. During those cash years, the Hang Seng fell 18.2%, 20.4%, and 8.5% in 2000-2002 (cash outperformed), then rose 27.3% and 16.0% in 2003-2004 (cash underperformed). FMP data coverage for HKSE improved by 2005.
Limitations
Early cash periods. Five years of cash (2000-2004) reflect thin FMP coverage for HKSE stocks in the early period, not genuinely no qualifying stocks. Returns before 2005 should be treated as indicative.
Hong Kong-specific tail risks. The 2015 drawdown (-21.2%) was driven by China macro risk. The 2019 weakness reflected political events. These risks are structural for HKSE investments and no fundamental quality screen removes them.
Volatility. At 23.4% annualized, the portfolio's volatility matches the US version. But the sources are different: US volatility comes from factor cycles (value vs growth), HK volatility comes from geopolitical and China-linked events.
Currency. Returns are in HKD, which is USD-pegged. The Hang Seng benchmark is also in HKD, so the comparison is fully currency-matched. Currency effects on the comparison are minimal.
Run It Yourself
Run this screen live on Ceta Research
git clone https://github.com/ceta-research/backtests.git
cd backtests
python3 fcf-yield/backtest.py --preset hongkong
Takeaway
The Hong Kong FCF yield screen produced 10.22% annually over 25 years, +8.58 percentage points ahead of the Hang Seng Index. Max drawdown of -21.2% vs -40.5% for the Hang Seng. The portfolio won 72% of years against the local index. During 2008, it lost 5.5% while the Hang Seng fell 16.2%.
The risk-adjusted profile against the local benchmark is exceptional. The Hang Seng returned 1.64% annually from 2000-2025, barely positive over 25 years. The FCF yield screen found quality cash generators that navigated that environment successfully. Sortino ratio of 0.930 and down capture of 26.8% both confirm the core thesis: quality-filtered cash flow beats a flat market with high consistency.
The caveats are real: early cash periods (2000-2004) limit the true track record to 20 years, and HK-specific risks (China exposure, political events) can create drawdowns unrelated to fundamentals. 2015 is notable: -21.2% for the portfolio, -19.9% for the Hang Seng. Both fell together. When macro risk dominates, quality filters don't protect.
Data: Ceta Research (FMP financial data warehouse), 2000-2025. Universe: Hong Kong Stock Exchange (HKSE). Returns in HKD (USD-pegged). Full methodology: METHODOLOGY.md. Past performance does not guarantee future results. This is educational content, not investment advice.
References
- Gray, W. & Vogel, J. (2012). "Analyzing Valuation Measures: A Performance Horse-Race over the Past 40 Years." Journal of Portfolio Management, 39(1), 112-121.
- Lakonishok, J., Shleifer, A. & Vishny, R. (1994). "Contrarian Investment, Extrapolation, and Risk." Journal of Finance, 49(5), 1541-1578.


