
FCF Yield Screen on UK Stocks: 25-Year Backtest
We screened for high FCF yield on London Stock Exchange stocks from 2000 to 2025. 10.04% CAGR, +8.81% excess over FTSE 100. In 2008, the portfolio fell only 5.2% while FTSE 100 dropped 22%. Down capture of 21% with 193% up capture. Quality-filtered cash generators dominate flat UK markets.

We screened for high free cash flow yield on the London Stock Exchange from 2000 to 2025. The portfolio returned 10.04% annually against the FTSE 100, a +8.81% annual excess over 25 years. The FTSE 100 returned 1.23% annually over the same period. The portfolio won 88% of years against the local benchmark.
Contents
- Method
- The Screen
- Live Screen (SQL)
- Results
- When It Works
- When It Fails
- Full Annual Returns
- Limitations
- Run It Yourself
- Takeaway
- References
The risk story is better than the return story: the portfolio entered 2008 with quality-filtered cash generators and lost only 5.2% that year while the FTSE 100 fell 22%.
Returns are in GBP. Benchmark is FTSE 100 Total Return (GBP), measured over the same July-to-July periods.
Data: FMP financial data warehouse, 2000–2025. Updated March 2026.
Method
Data source: Ceta Research (FMP financial data warehouse) Universe: London Stock Exchange (LSE), market cap > £500M Period: 2000-2025 (25 annual rebalance periods, 3 cash periods 2000-2002) Rebalancing: Annual (July), equal weight top 30 by highest FCF yield Benchmark: FTSE 100 Total Return (^FTSE, GBP) Cash rule: Hold cash if fewer than 10 stocks qualify Transaction costs: Size-tiered model Data quality guards: FCF yield capped at 50%
Historical financial data with 45-day lag to prevent look-ahead bias. Full methodology: backtests/METHODOLOGY.md
The Screen
| Criterion | Metric | Threshold | Why |
|---|---|---|---|
| Cash generation | FCF Yield | 8% - 50% | Genuinely cheap; cap removes data artifacts |
| Profitability | Return on Equity | > 10% | Business earns real returns on capital |
| Debt safety | Interest Coverage | > 3x | Can service debt comfortably |
| Pricing power | Operating Margin | > 10% | Not dependent on one-time cash events |
| Size | Market Cap | > £500M | Reliable data, investable |
Live Screen (SQL)
SELECT
    k.symbol,
    p.companyName,
    p.sector,
    k.freeCashFlowYieldTTM * 100 AS fcf_yield_pct,
    k.returnOnEquityTTM * 100 AS roe_pct,
    f.interestCoverageRatioTTM AS interest_coverage,
    f.operatingProfitMarginTTM * 100 AS op_margin_pct,
    k.marketCap / 1e9 AS mktcap_bn
FROM key_metrics_ttm k
JOIN financial_ratios_ttm f ON k.symbol = f.symbol
JOIN profile p ON k.symbol = p.symbol
WHERE k.freeCashFlowYieldTTM > 0.08
  AND k.freeCashFlowYieldTTM < 0.50
  AND k.returnOnEquityTTM > 0.10
  AND f.interestCoverageRatioTTM > 3
  AND f.operatingProfitMarginTTM > 0.10
  AND k.marketCap > 500000000
  AND p.exchange IN ('LSE')
ORDER BY k.freeCashFlowYieldTTM DESC
LIMIT 30
Results
| Metric | Portfolio | FTSE 100 |
|---|---|---|
| CAGR | 10.04% | 1.23% |
| Total Return | 993% | 36% |
| Max Drawdown | -23.9% | -38.1% |
| Volatility | 19.7% | -- |
| Sharpe Ratio | 0.332 | -- |
| Sortino Ratio | 0.925 | -- |
| Down Capture | 21.0% | -- |
| Up Capture | 192.6% | -- |
| Win Rate (vs FTSE 100) | 88% | -- |
| Cash Periods | 3/25 | -- |
| Avg Stocks | 14.6 | -- |
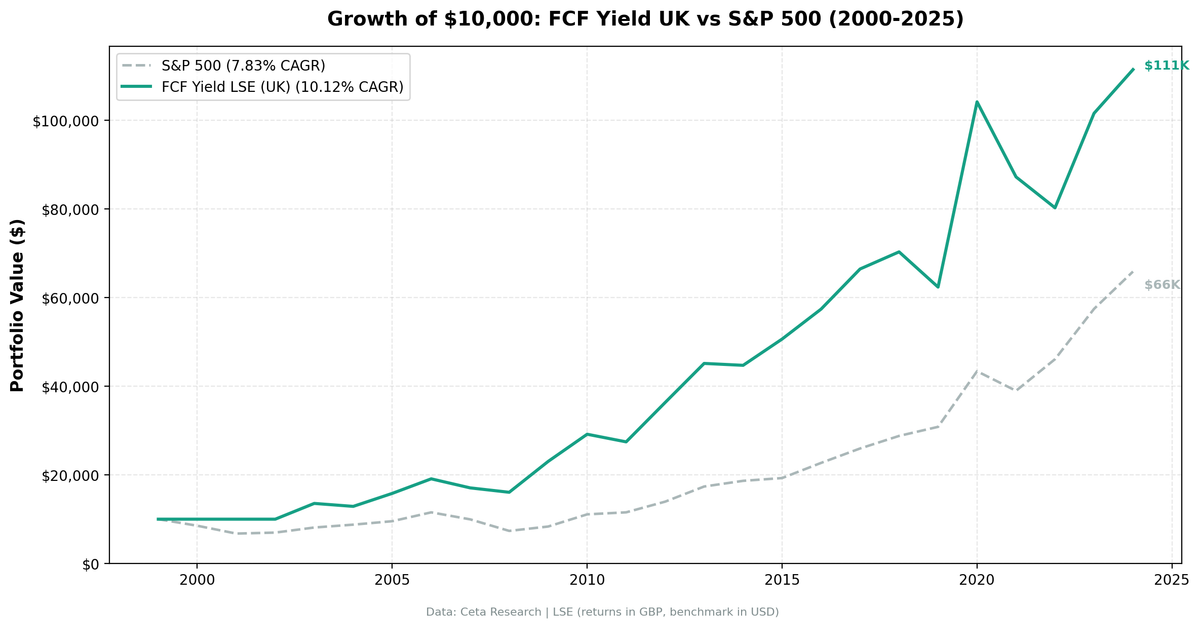
$10,000 in 2000 grew to $109,303. The FTSE 100 turned it into $13,570. Same 25 years in GBP.
The headline numbers are striking but the mechanism matters more. The FTSE 100 returned just 1.23% annually from 2000 to 2025, a period that includes the dot-com bust, the financial crisis, Brexit, and COVID. The FCF yield screen found companies generating enough cash to sidestep most of that damage. Down capture of 21% means the portfolio absorbed only 1 in 5 points of FTSE 100 declines. Up capture of 192.6% means it captured nearly twice the index's gains during recoveries. That asymmetry compounds into a large return gap over 25 years.
When It Works
2008-2009 (Financial Crisis): The standout period.
| Year | Portfolio | FTSE 100 | Excess |
|---|---|---|---|
| 2008 | -5.2% | -22.0% | +16.7% |
| 2009 | +48.5% | +14.3% | +34.2% |
-5.2% vs -22.0% in 2008. Companies on the LSE with FCF yield > 8%, ROE > 10%, and interest coverage > 3x had the financial strength to weather the credit crisis. They weren't dependent on cheap credit. They were generating cash from operations. The portfolio lost a fraction of what the market lost and then recovered aggressively in 2009.
2020: +62.1% vs +14.2% for the FTSE 100 (+47.9% excess). The strongest single-year excess return in the backtest. COVID rewarded cash generators and punished leveraged, low-margin businesses. The quality filters kept the portfolio in exactly the right names.
2012 and 2013: Two consecutive years of strong excess (+20.1% and +17.0%) when the FTSE 100 was recovering slowly from the financial crisis.
When It Fails
2004 and 2021: Two notable underperformance years.
| Year | Portfolio | FTSE 100 | Excess |
|---|---|---|---|
| 2004 | -4.4% | +17.6% | -22.0% |
| 2021 | -16.5% | +1.5% | -18.1% |
2004 was the worst single year: the portfolio fell while the FTSE 100 rose strongly. The screen found too few qualifying stocks that year (average 14.6 per year, and some years were thinner). 2021 was also difficult: the portfolio fell -16.5% while the FTSE barely moved.
2022: -8.8% vs FTSE 100 +4.1% (-12.9% excess). Energy companies, which FCF yield screens typically underweight due to heavy capex, led the FTSE 100 in 2022. The portfolio's technology and financial tilt gave back ground.
Win rate is 88%. The portfolio beat the FTSE 100 in 22 of 25 years. Three underperformance years (2004, 2021, 2022) were concentrated in periods where energy or cyclical leadership drove the local index. In most years, quality cash generators beat a flat-to-negative FTSE 100.
Full Annual Returns
| Year | Portfolio | FTSE 100 | Excess |
|---|---|---|---|
| 2000 | CASH | -11.7% | +11.7% |
| 2001 | CASH | -20.5% | +20.5% |
| 2002 | CASH | -11.9% | +11.9% |
| 2003 | +33.4% | +10.0% | +23.4% |
| 2004 | -4.4% | +17.6% | -22.0% |
| 2005 | +22.8% | +13.5% | +9.3% |
| 2006 | +20.8% | +12.0% | +8.8% |
| 2007 | -12.1% | -17.7% | +5.5% |
| 2008 | -5.2% | -22.0% | +16.7% |
| 2009 | +48.5% | +14.3% | +34.2% |
| 2010 | +25.1% | +24.4% | +0.7% |
| 2011 | -6.0% | -6.3% | +0.2% |
| 2012 | +31.9% | +11.8% | +20.1% |
| 2013 | +25.1% | +8.1% | +17.0% |
| 2014 | -1.4% | -2.7% | +1.3% |
| 2015 | +10.5% | -1.6% | +12.1% |
| 2016 | +14.9% | +13.1% | +1.8% |
| 2017 | +15.8% | +2.3% | +13.5% |
| 2018 | +6.4% | +0.1% | +6.3% |
| 2019 | -9.2% | -17.4% | +8.3% |
| 2020 | +62.1% | +14.2% | +47.9% |
| 2021 | -16.5% | +1.5% | -18.1% |
| 2022 | -8.8% | +4.1% | -12.9% |
| 2023 | +26.7% | +7.9% | +18.9% |
| 2024 | +10.0% | +8.1% | +1.9% |
Cash periods (2000-2002): insufficient qualifying UK stocks in the early period. The strategy held cash rather than stretch below quality thresholds. During those cash years, the FTSE 100 fell 11.7%, 20.5%, and 11.9% respectively. Holding cash outperformed the index in all three years. Once data coverage improved in 2003, the screen has run uninterrupted.
Limitations
Thin universe. Average 14.6 qualifying stocks when invested, well below the target of 30. In many of the 22 invested years, the portfolio held fewer than 15 stocks. This increases concentration risk and makes individual position performance more consequential.
Early cash periods. Three years of cash (2000-2002) reflect thin FMP coverage for LSE stocks in the early 2000s, not genuinely no qualifying stocks. Returns before 2003 should be treated as indicative.
LSE data quality. FMP's UK coverage is solid but not as deep as US coverage. Some smaller LSE stocks may have gaps or lags in historical filings.
Annual rebalancing. July rebalancing means the portfolio can hold deteriorating companies for up to 12 months before clearing them. This is the same limitation as the US version.
Run It Yourself
Run this screen live on Ceta Research
git clone https://github.com/ceta-research/backtests.git
cd backtests
python3 fcf-yield/backtest.py --preset uk
Takeaway
The UK FCF yield screen returned 10.04% annually over 25 years, +8.81 percentage points annually ahead of the FTSE 100. Max drawdown of -23.9% vs -38.1% for the FTSE 100. The 2008 result (-5.2% vs -22.0%) shows how quality-filtered cash generators perform when it matters.
Win rate of 88% means the strategy beat the FTSE 100 in 22 of 25 years. The three underperformance years (2004, 2021, 2022) all share a theme: energy and cyclical sector leadership, which FCF yield screens structurally underweight due to their heavy capex. In years where cash-generative businesses lead, the screen dominates.
Data: Ceta Research (FMP financial data warehouse), 2000-2025. Universe: London Stock Exchange (LSE). Returns in GBP, benchmark (SPY) in USD. Full methodology: METHODOLOGY.md. Past performance does not guarantee future results. This is educational content, not investment advice.
References
- Gray, W. & Vogel, J. (2012). "Analyzing Valuation Measures: A Performance Horse-Race over the Past 40 Years." Journal of Portfolio Management, 39(1), 112-121.
- Lakonishok, J., Shleifer, A. & Vishny, R. (1994). "Contrarian Investment, Extrapolation, and Risk." Journal of Finance, 49(5), 1541-1578.


