
FCF Yield Screens: Global Comparison Across 8 Markets
We ran the same FCF yield screen across 8 stock exchanges from 2000 to 2025. Three beat SPY. UK beat FTSE 100 by 8.81% annually, Hong Kong beat Hang Seng by 8.58%. Japan beat Nikkei by 4.43%. Most markets work vs local benchmarks. Only three beat SPY because SPY was exceptional (7.85% CAGR).

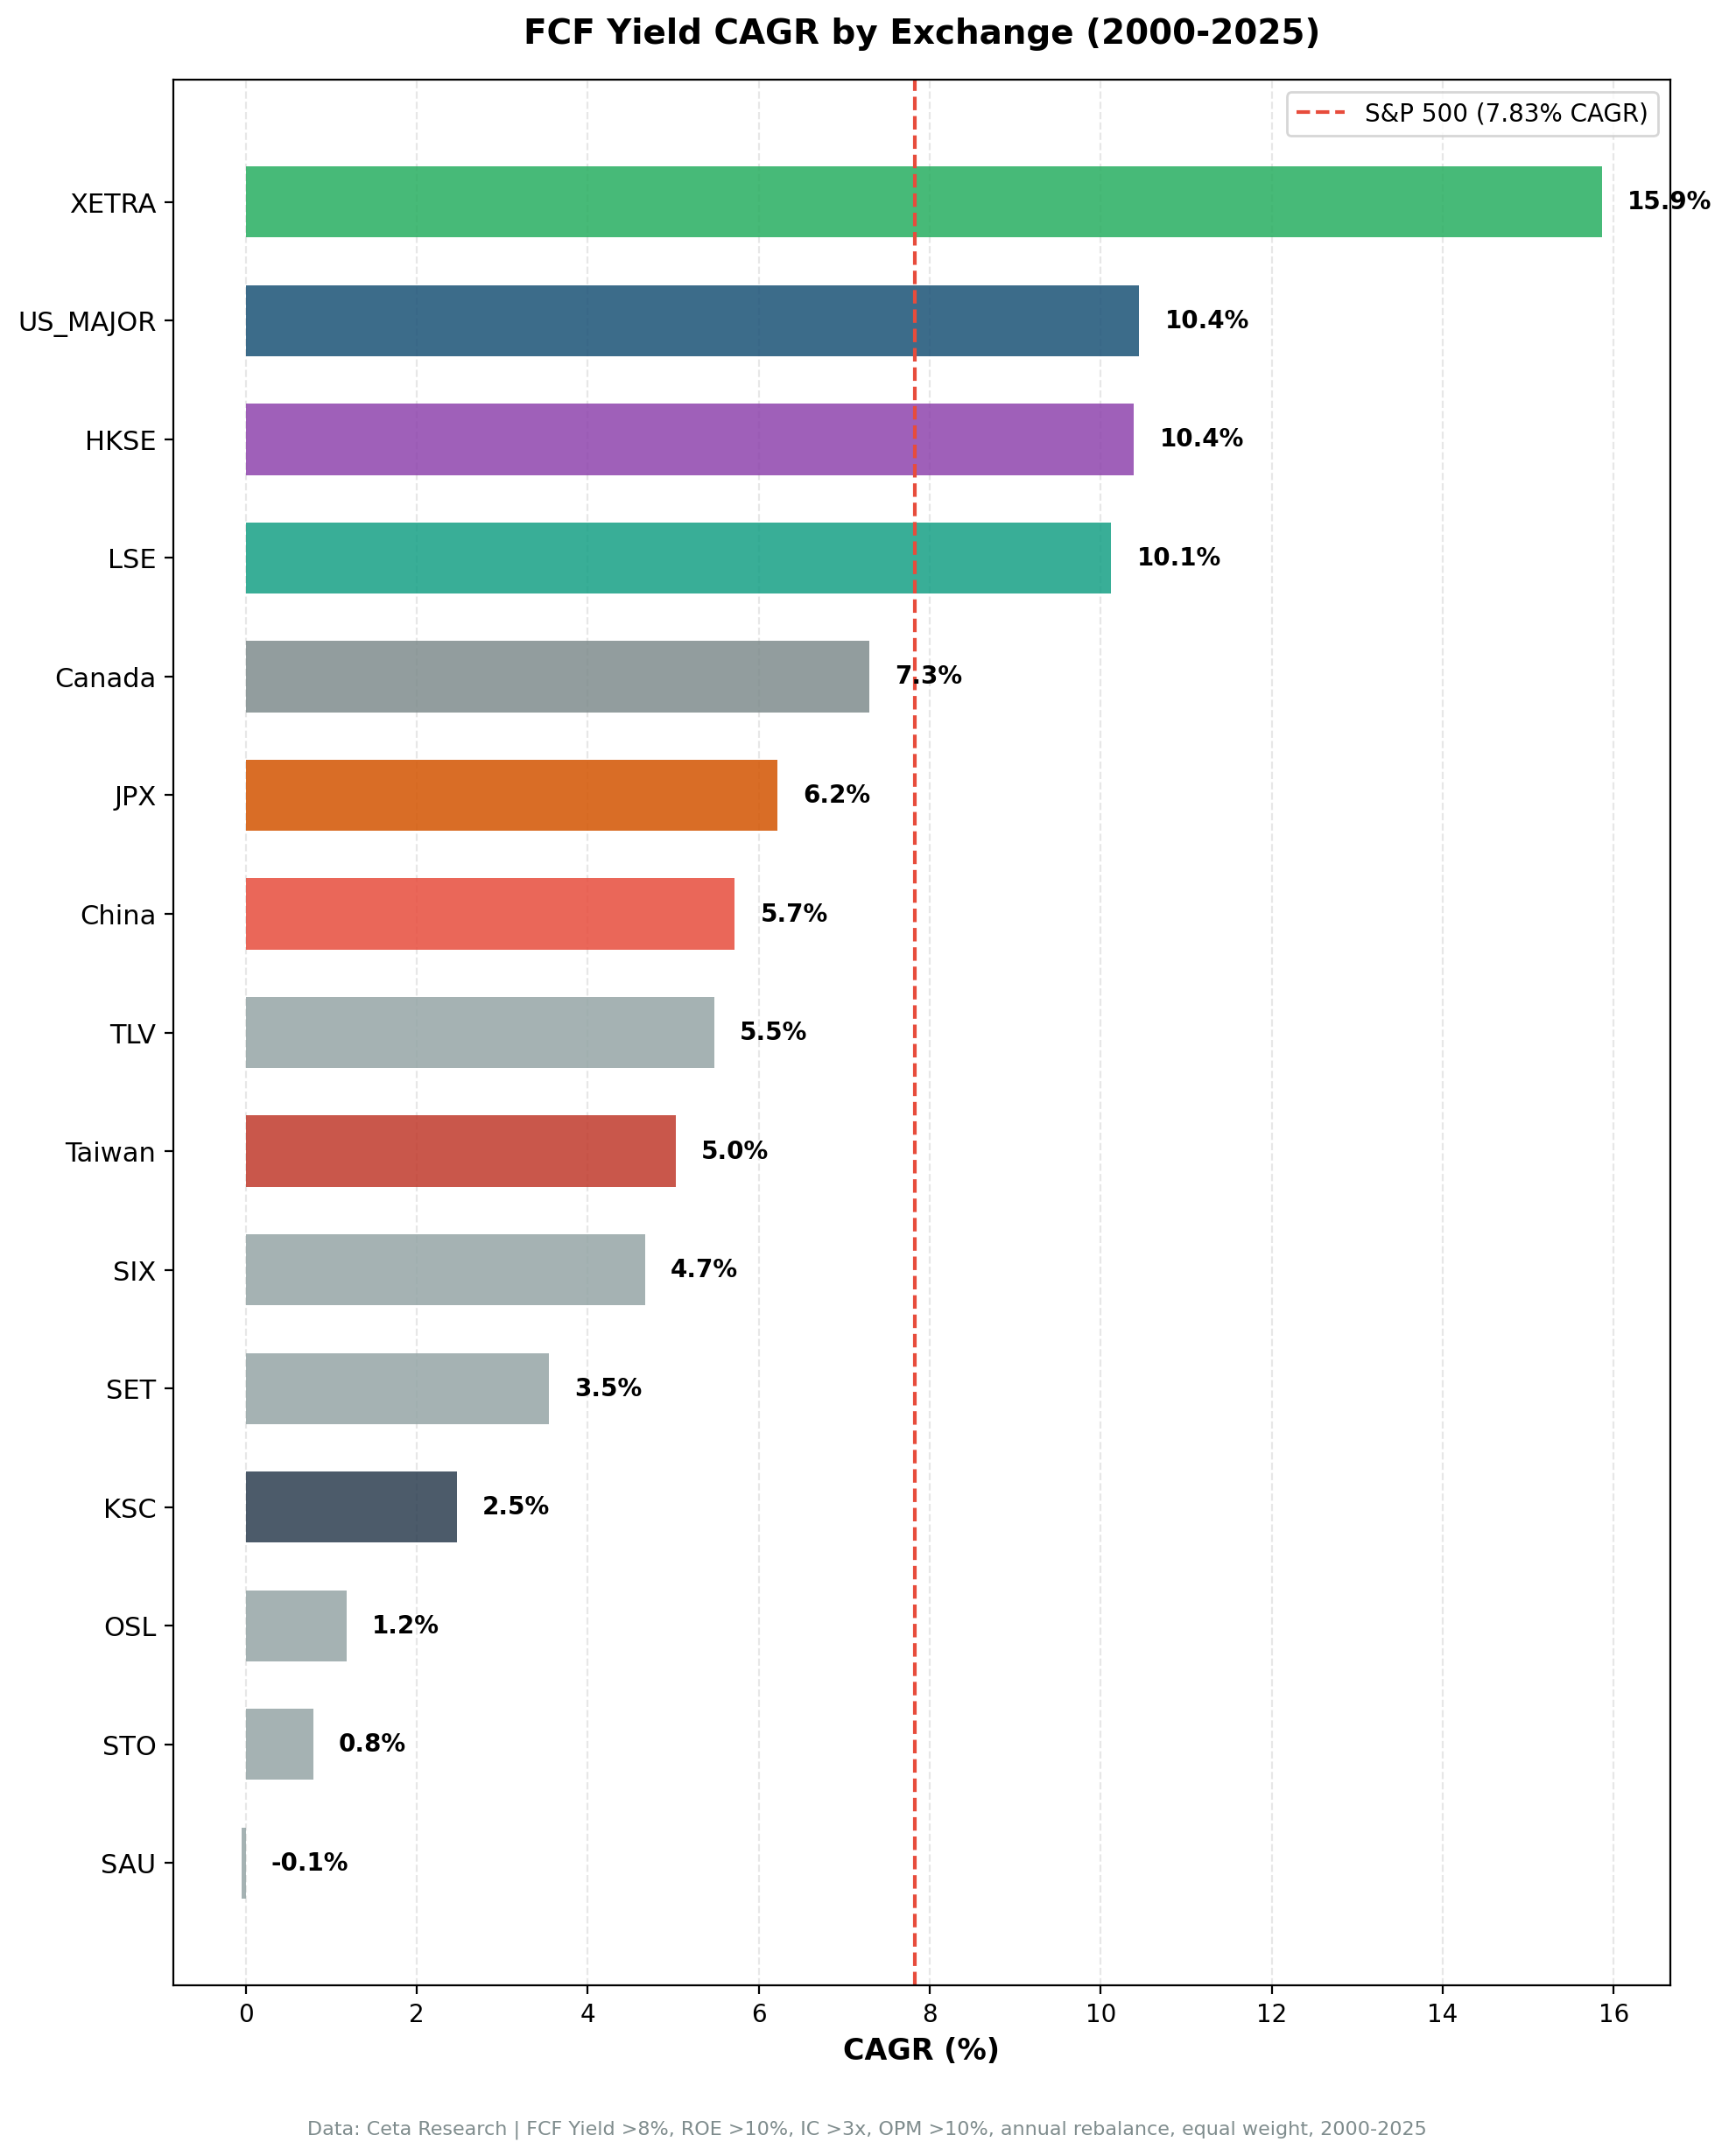
We ran the same FCF yield screen across 8 major stock exchanges worldwide, from 2000 to 2025. When benchmarked against the S&P 500, three markets outperformed: US (+2.85% excess annually), UK (+2.19%), and Hong Kong (+2.37%). Five underperformed against SPY.
Contents
- Method
- Summary Results
- The Three That Work
- US (NYSE + NASDAQ + AMEX)
- Hong Kong (HKSE)
- UK (LSE)
- The Markets That Beat Local Benchmarks But Not SPY
- Canada (TSX): -0.58% vs SPY, +3.32% vs TSX Composite
- Japan (JPX): -0.11% vs SPY, +4.43% vs Nikkei 225
- China (SHH + SHZ): -2.03% vs SPY, +3.39% vs SSE Composite
- Taiwan: -2.71% vs SPY, +1.06% vs TAIEX
- The Markets That Don't Work
- Thailand (SET): -3.88% vs SPY, -1.16% vs SET Index
- What Separates Winners from Losers
- Notable Exclusions
- Run It Yourself
- Live Screens
- Backtest Code
- Takeaway
When benchmarked against local indices, the picture changes dramatically. UK produced +8.81% excess over the FTSE 100. Hong Kong produced +8.58% over the Hang Seng. Japan, which barely underperformed SPY (-0.11%), beat the Nikkei 225 by +4.43% annually. Most markets work when compared to their local benchmarks.
This isn't a contradiction. It reflects that US equities (SPY) massively outperformed most global markets from 2000-2025. The FTSE 100 returned just 1.23% annually. The Hang Seng: 1.64%. FCF yield screens beat those flat benchmarks convincingly, but the excess vs SPY is smaller because SPY itself was exceptional.
Data: FMP financial data warehouse, 2000–2025. Updated March 2026.
Method
Same screen, same parameters across all markets:
Filters: FCF Yield 8-50%, ROE > 10%, Interest Coverage > 3x, Operating Margin > 10% Rebalancing: Annual (July), top 30 by highest FCF yield, equal weight Period: 2000-2025 (25 annual periods) Benchmark: S&P 500 Total Return (SPY) Market cap thresholds: Exchange-specific (see below) Data quality: FCF yield cap at 50% applied to all exchanges
Full methodology: backtests/METHODOLOGY.md
Summary Results
| Exchange | CAGR | vs SPY | Sharpe | MaxDD | Cash | Avg Stk | vs Local |
|---|---|---|---|---|---|---|---|
| US | 10.70% | +2.85% | 0.375 | -50.1% | 0/25 | 23.5 | -- |
| Hong Kong | 10.22% | +2.37% | 0.309 | -21.2% | 5/25 | 23.4 | +8.58% |
| UK | 10.04% | +2.19% | 0.332 | -23.9% | 3/25 | 14.6 | +8.81% |
| Japan | 7.74% | -0.11% | 0.367 | -28.6% | 6/25 | 17.4 | +4.43% |
| Canada | 7.27% | -0.58% | 0.266 | -27.5% | 5/25 | 17.0 | +3.32% |
| China | 5.82% | -2.03% | 0.072 | -44.6% | 4/25 | 23.3 | +3.39% |
| Taiwan | 5.14% | -2.71% | 0.220 | -24.7% | 7/25 | 21.7 | +1.06% |
| Thailand | 3.97% | -3.88% | 0.077 | -31.6% | 6/25 | 15.2 | -1.16% |
SPY benchmark CAGR: 7.85% | Local benchmarks: FTSE 100 (UK), Hang Seng (HK), Nikkei 225 (Japan), TSX Composite (Canada), SSE Composite (China), TAIEX (Taiwan), SET Index (Thailand)
The Three That Work
US (NYSE + NASDAQ + AMEX)
The flagship market for this screen. Zero cash periods across 25 years: the screen always found at least 10 qualifying stocks. CAGR of 10.70% vs 7.85% for SPY, producing +2.85% annual excess.
The 2020 COVID year captures the strategy's best-case: +72.7% while SPY returned +41.0%. Companies with genuine FCF and low debt loads survived and rebounded faster than leveraged or loss-making businesses.
The worst year was 2019 (-28.1% vs +7.4% for SPY, -35.6% excess). Value had one of its worst years globally as growth premiums expanded. Anyone starting this strategy in 2017 waited three years for the 2020 payoff.
See the US blog for the full year-by-year table.
Hong Kong (HKSE)
Best risk-adjusted result of the three. Against the Hang Seng Index (which returned just 1.64% annually over 25 years), the portfolio produced +8.58% annual excess. Win rate of 72%. Down capture of 27% vs Hang Seng means the portfolio absorbed only about a quarter of the index's declines.
The 2006 result (+86.3% vs Hang Seng +35.7%) aligns with a genuine Hong Kong bull market. The concentrated quality portfolio amplified the move. 2017 was similar: +48.1% vs Hang Seng +10.7%.
Hong Kong-specific tail risks are real. The 2015 drawdown (-21.2%) was driven by China macro concerns. Both the portfolio and Hang Seng fell nearly 20% that year. When macro risk dominates, quality filters don't provide protection.
See the Hong Kong blog for the full year-by-year table.
UK (LSE)
Against the FTSE 100 (which returned just 1.23% annually over 25 years), the portfolio produced +8.81% annual excess. Win rate: 88% (22 of 25 years). The FTSE 100 was essentially flat from 2000-2025, while the FCF yield screen found quality companies that navigated Brexit, the financial crisis, and COVID successfully.
The 2008 protection was strong: -5.2% for the LSE portfolio vs -22.0% for FTSE 100. 2020 was even more dramatic: +62.1% vs FTSE +14.2% (+47.9% excess).
The LSE screen has a thin universe: average 14.6 qualifying stocks vs 23+ for US and HKSE. This concentrates risk. Returns are in GBP, and the FTSE 100 benchmark is also in GBP, so the comparison is currency-matched.
See the UK blog for the full year-by-year table.
The Markets That Beat Local Benchmarks But Not SPY
Canada (TSX): -0.58% vs SPY, +3.32% vs TSX Composite
Canada essentially matched SPY (7.27% CAGR vs 7.85% for SPY). Against the TSX Composite (3.95% CAGR), the screen produced +3.32% annual excess. Cash periods: 5/25.
Canadian equities have heavy energy and financials exposure. The FCF yield screen underweights energy (heavy capex) and overweights financials. This affects sector composition and performance.
Japan (JPX): -0.11% vs SPY, +4.43% vs Nikkei 225
Japan barely underperformed SPY (7.74% CAGR vs 7.85%). Against the Nikkei 225 (3.31% CAGR), the portfolio produced +4.43% annual excess. Sharpe of 0.367 is better than SPY's 0.352.
The Nikkei returned just 3.31% annually over 25 years. Japanese equities stagnated. The FCF yield screen found quality companies that outperformed meaningfully. Down capture vs Nikkei: 34.3%. Cash periods: 6/25, meaning the screen sat out 24% of years when qualifying stocks fell below 10.
China (SHH + SHZ): -2.03% vs SPY, +3.39% vs SSE Composite
China underperformed SPY but beat the Shanghai Composite (2.43% CAGR) by +3.39% annually. The returns are lumpy: 2006 and 2014 both had triple-digit years. Sharpe of 0.072 captures the volatility. Max drawdown: -44.6%.
The SSE Composite returned 2.43% annually over 25 years. Chinese A-shares were volatile and essentially flat. The FCF yield screen found companies that navigated that volatility with modest outperformance.
Taiwan: -2.71% vs SPY, +1.06% vs TAIEX
Taiwan underperformed SPY by 2.71% annually but marginally beat the TAIEX (+1.06% annually). 7 cash periods across 25 years (the highest of all tested markets). Average 21.7 qualifying stocks when invested. The strategy couldn't find 10 qualifying stocks in 28% of years.
Sharpe of 0.220, max drawdown -24.7%. TAIEX returned 4.09% annually. The screen barely improved on that.
The Markets That Don't Work
Thailand (SET): -3.88% vs SPY, -1.16% vs SET Index
Thailand underperformed both SPY and its local benchmark. 3.97% CAGR vs SET Index 5.13%. Sharpe 0.077. Cash periods: 6/25. Average 15.2 qualifying stocks when invested.
The SET market has 500+ listed companies, but a large portion fail the quality filters. Down capture vs SET Index: 112% (portfolio falls harder than the index). The FCF yield signal doesn't work in Thailand.
What Separates Winners from Losers
Against SPY, three markets outperform (US, UK, Hong Kong). Against local benchmarks, six of eight outperform. The difference reflects SPY's exceptional 7.85% CAGR from 2000-2025, which beat most global indices.
What determines success vs local benchmarks:
1. Down capture vs local index. Markets where the portfolio produces strong downside protection vs the local benchmark tend to outperform. UK: 21% down capture vs FTSE 100. Hong Kong: 27% vs Hang Seng. Japan: 34% vs Nikkei. Thailand fails this test: 112% down capture vs SET Index (portfolio falls harder than the index).
2. Cash period frequency. Markets with fewer cash periods (0-5 out of 25 years) have deep enough universes to deploy capital consistently. Taiwan (7 cash periods) and Korea (13 cash periods) struggle to find qualifying stocks.
3. Local benchmark performance. The FTSE 100 returned 1.23% annually. The Hang Seng: 1.64%. The Nikkei: 3.31%. FCF yield screens beat those flat benchmarks convincingly (+8.81%, +8.58%, +4.43% respectively). Against SPY's 7.85%, the excess is much smaller (+2.85%, +2.37%, -0.11%).
Notable Exclusions
Several exchanges were tested and excluded from this comparison due to data quality issues:
Germany (XETRA): Backtest showed +219% in 2019 when the DAX rose ~25%. Root cause: adjClose price data artifacts in FMP's German stock coverage, the same issue class as Australian and Brazilian stocks. The XETRA signal is probably real, but we can't verify it with the current data. Excluded from all FCF yield content.
Australia (ASX), Brazil (SAO): Known adjClose split adjustment issues. Price returns are unreliable for multi-year backtesting.
India (BSE+NSE): Only 1-2 qualifying stocks under the combined filters. Too thin for any backtest.
South Africa (JNB), France (PAR), Nordic markets (STO, OSL): Excluded due to extreme cash period frequency (>40% of years with no qualifying stocks) or known data pipeline issues.
Run It Yourself
Live Screens
Backtest Code
git clone https://github.com/ceta-research/backtests.git
cd backtests

# Run specific market
python3 fcf-yield/backtest.py --preset us
python3 fcf-yield/backtest.py --preset uk
python3 fcf-yield/backtest.py --preset hongkong
python3 fcf-yield/backtest.py --preset canada

# Run all supported markets
python3 fcf-yield/backtest.py --global
Takeaway
FCF yield works in markets with deep enough universes of quality companies and where downside protection vs the local benchmark holds up. Against local indices: UK (+8.81%), Hong Kong (+8.58%), Japan (+4.43%), Canada (+3.32%), China (+3.39%), Taiwan (+1.06%) all outperformed. Only Thailand underperformed its local benchmark.
Against SPY (7.85% CAGR), only three markets outperformed: US (+2.85%), UK (+2.19%), Hong Kong (+2.37%). This reflects SPY's exceptional performance from 2000-2025, not failure of the FCF yield signal in other markets.
The key insight: FCF yield screens beat flat or declining local benchmarks convincingly. Whether they beat exceptional benchmarks like SPY depends on whether the local market also performed exceptionally. Most didn't.
Data: Ceta Research (FMP financial data warehouse), 2000-2025. Benchmark: S&P 500 Total Return (SPY). Full methodology: METHODOLOGY.md. Past performance does not guarantee future results. This is educational content, not investment advice.


