
Graham Number Backtest Germany: 25 Years on XETRA
We ran the Graham Number screen on XETRA for 25 years. 8.21% CAGR vs 4.45% DAX, a +3.77% annual excess. Beta 1.00 vs the DAX, up capture 125.4%, down capture 79.8%, and alpha +3.77%. A genuine value edge over the local benchmark.

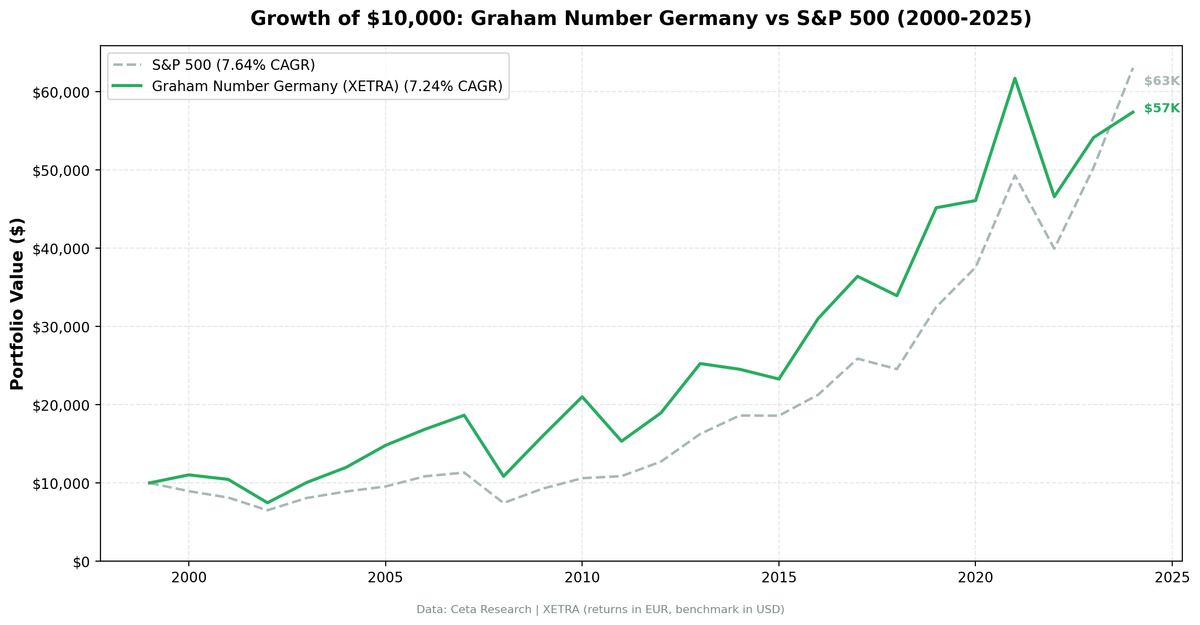
Germany's Graham Number screen beats the DAX by 3.77% annually over 25 years. 8.21% vs 4.45%. Against SPY, the strategy looked like a statistical tie. Against the local benchmark, the picture is different: genuine outperformance.
Contents
- Method
- The Formula
- What We Found
- Year by Year
- 2000-2009: Early Leadership, Then Crisis
- 2010-2019: Mixed, With Volatility Spikes
- 2020-2024: The Recent Record
- Why Germany Beats Its Benchmark
- The Full Annual Record
- Limitations
- Run It Yourself
- Part of a Series
Beta 1.00 vs the DAX. Up capture 125.4%. Down capture 79.8%. This portfolio captures more of the upside than the downside, producing +3.77% alpha after risk adjustment.
A 10,000 EUR investment in January 2000 grew to roughly 72,000 EUR by end of 2024 vs about 29,700 EUR for the DAX. The strategy delivered well over twice the local benchmark's total return.
Data: FMP financial data warehouse, 2000–2025. Updated May 2026.
Method
Data source: Ceta Research (FMP financial data warehouse) Universe: XETRA (Frankfurt), market cap > 500M EUR Period: 2000-2024 (25 annual rebalance periods) Rebalancing: Annual (January), equal weight top 30 by discount to Graham Number Ranking: Deepest discount first (lowest price / Graham Number ratio) Benchmark: DAX Cash rule: Hold cash if fewer than 10 stocks qualify Transaction costs: Size-tiered model
Full methodology: backtests/METHODOLOGY.md
The Formula
Graham Number = sqrt(22.5 x EPS x Book Value Per Share)
The constant 22.5 comes from Graham's rule that a stock shouldn't exceed 15x earnings or 1.5x book value. Multiply those limits: 15 x 1.5 = 22.5. The screen buys only stocks trading below this theoretical intrinsic value ceiling, ranked by depth of discount.
| Parameter | Value | Purpose |
|---|---|---|
| Formula | sqrt(22.5 x EPS x BVPS) | Graham's combined earnings + book ceiling |
| Max portfolio size | 30 stocks | Concentrated enough to matter |
| Ranking | Price / Graham Number ascending | Deepest discounts first |
| Market cap floor | > 500M EUR | Investable universe only |
| Cash threshold | < 10 qualifying stocks | Avoids forced exposure |
No momentum filters. No quality overlays. No sector caps. Graham's arithmetic, applied literally.
What We Found
| Metric | Graham Number | DAX |
|---|---|---|
| CAGR | 8.21% | 4.45% |
| Excess CAGR | +3.77% | — |
| Total Return | 619.7% | 196.6% |
| Max Drawdown | -42.02% | -54.00% |
| Volatility (ann.) | 23.61% | 19.83% |
| Sharpe Ratio | 0.263 | 0.123 |
| Sortino Ratio | 0.513 | 0.180 |
| Calmar Ratio | 0.195 | 0.082 |
| Beta | 1.002 | 1.00 |
| Alpha | +3.77% | — |
| Up Capture | 125.4% | — |
| Down Capture | 79.8% | — |
| Win Rate (vs DAX) | 52% | — |
| Cash Periods | 0/25 | — |
| Avg Stocks Held | 25.7 | — |
The up and down captures tell the real story. Up capture of 125.4% means the strategy rises faster than the DAX in good years. Down capture of 79.8% means it falls less than the DAX in bad years. That asymmetry, even with a win rate of only 52%, compounds into meaningful outperformance over 25 years.
Alpha of +3.77% is positive after adjusting for market risk. The strategy doesn't just track the DAX with leverage; it adds genuine value through stock selection.
Year by Year
2000-2009: Early Leadership, Then Crisis
The first decade started well. Germany's market entered the 2000s trading at lower valuations than US tech-dominated indices, and the Graham Number screen found real bargains in German industrials, financials, and cyclicals.
| Year | Portfolio | DAX | Excess |
|---|---|---|---|
| 2000 | -0.5% | -6.8% | +6.4% |
| 2001 | -5.5% | -17.8% | +12.4% |
| 2002 | -25.0% | -39.9% | +15.0% |
| 2003 | +33.8% | +29.4% | +4.4% |
| 2004 | +18.1% | +6.8% | +11.3% |
| 2005 | +24.8% | +27.0% | -2.2% |
| 2006 | +18.7% | +22.6% | -3.9% |
| 2007 | +11.5% | +19.0% | -7.5% |
| 2008 | -42.0% | -37.4% | -4.6% |
| 2009 | +58.3% | +21.6% | +36.7% |
2000 through 2002 showed genuine outperformance. German value stocks had limited exposure to the tech collapse, and the Graham Number screen found companies with real assets and real earnings trading at discounts. The DAX fell nearly 40% in 2002; the portfolio fell 25%. Still painful, but 15 points better.
2003 through 2004 were the payoff years: consecutive outperformance as German industrials and cyclicals re-rated. Solid double-digit excess returns.
2005 through 2007 were a lagging stretch. The DAX rallied hard on export strength and financial sector expansion. The Graham Number screen's cheaper, more industrial picks didn't keep pace with the index's momentum.
2008 was the worst year in the dataset. At -42.0%, the drawdown was 4.6 points worse than the DAX. German financial and industrial stocks, which dominate XETRA Graham Number screens, took concentrated hits in the credit crisis.
2009 was the best excess year: +36.7%. The same beaten-down cyclicals bounced hard.
2010-2019: Mixed, With Volatility Spikes
| Year | Portfolio | DAX | Excess |
|---|---|---|---|
| 2010 | +30.9% | +15.6% | +15.4% |
| 2011 | -17.5% | -13.1% | -4.4% |
| 2012 | +25.1% | +28.0% | -2.9% |
| 2013 | +38.6% | +20.8% | +17.7% |
| 2014 | -2.9% | +3.9% | -6.8% |
| 2015 | -4.5% | +5.3% | -9.8% |
| 2016 | +31.5% | +12.8% | +18.7% |
| 2017 | +22.6% | +11.0% | +11.7% |
| 2018 | -8.5% | -17.8% | +9.3% |
| 2019 | +29.3% | +26.5% | +2.8% |
2014 and 2015 were the lagging stretch in this decade: combined -16.6% excess. The Eurozone backdrop and lack of cyclical leadership held the screen back.
2013 and 2016 were strong. German value stocks benefited from global economic expansion and a recovery in cyclical sectors. 2016's +18.7% excess was one of the best years of the decade.
2018 is notable. The portfolio fell only -8.5% while the DAX fell -17.8%. A +9.3% protective gap. The down capture worked here: rate fears and trade war concerns hit the DAX harder than the cheap, asset-heavy names in the Graham screen.
2019 added +2.8% excess on top of a +29.3% absolute return.
2020-2024: The Recent Record
| Year | Portfolio | DAX | Excess |
|---|---|---|---|
| 2020 | -0.9% | +2.5% | -3.5% |
| 2021 | +40.1% | +16.7% | +23.4% |
| 2022 | -16.9% | -12.2% | -4.7% |
| 2023 | +13.8% | +19.2% | -5.4% |
| 2024 | -2.1% | +19.4% | -21.5% |
2021 was a strong year: +23.4% excess as German value stocks re-rated in the post-COVID recovery.
2022 was a difficult year. Rate hikes punished the broader market. The German screen amplified the decline modestly, falling -16.9% vs the DAX's -12.2%.
2024's -21.5% excess gap is the widest negative in the recent period. The DAX rallied strongly while the screen's cheaper, more industrial picks lagged.
Why Germany Beats Its Benchmark
The Graham Number screen on XETRA produces a portfolio that amplifies the DAX's cyclical character, but with a value tilt that adds alpha. The screen selects European industrials, automotive companies, chemicals, and financials trading below Graham's value ceiling. These sectors are cyclical and global-trade-sensitive.
The result is a portfolio that participates in Germany's economic upcycles more aggressively than the DAX (125.4% up capture) while absorbing less of the downside (79.8% down capture). That asymmetry compounds into +3.77% annual excess over 25 years.
The beta of 1.00 is essentially the market's, meaning the portfolio tracks the DAX's overall volatility closely. The alpha of +3.77% is where the value comes from: stock selection within Germany's industrial and financial sectors, buying the cheapest names by Graham's criteria.
For a German investor, this is a more compelling story than the comparison vs SPY suggested. A simple value screen on local stocks that beats the local index by 3.77% annually, with genuine stock-selection alpha, is a useful tool.
The Full Annual Record
| Year | Portfolio | DAX | Excess |
|---|---|---|---|
| 2000 | -0.5% | -6.8% | +6.4% |
| 2001 | -5.5% | -17.8% | +12.4% |
| 2002 | -25.0% | -39.9% | +15.0% |
| 2003 | +33.8% | +29.4% | +4.4% |
| 2004 | +18.1% | +6.8% | +11.3% |
| 2005 | +24.8% | +27.0% | -2.2% |
| 2006 | +18.7% | +22.6% | -3.9% |
| 2007 | +11.5% | +19.0% | -7.5% |
| 2008 | -42.0% | -37.4% | -4.6% |
| 2009 | +58.3% | +21.6% | +36.7% |
| 2010 | +30.9% | +15.6% | +15.4% |
| 2011 | -17.5% | -13.1% | -4.4% |
| 2012 | +25.1% | +28.0% | -2.9% |
| 2013 | +38.6% | +20.8% | +17.7% |
| 2014 | -2.9% | +3.9% | -6.8% |
| 2015 | -4.5% | +5.3% | -9.8% |
| 2016 | +31.5% | +12.8% | +18.7% |
| 2017 | +22.6% | +11.0% | +11.7% |
| 2018 | -8.5% | -17.8% | +9.3% |
| 2019 | +29.3% | +26.5% | +2.8% |
| 2020 | -0.9% | +2.5% | -3.5% |
| 2021 | +40.1% | +16.7% | +23.4% |
| 2022 | -16.9% | -12.2% | -4.7% |
| 2023 | +13.8% | +19.2% | -5.4% |
| 2024 | -2.1% | +19.4% | -21.5% |
Win rate vs DAX: 52% (13 of 25 years). Just over half the years were wins. The positive excess years tend to be wider than the negative ones, which is how 52% win rate still produces +3.77% annual excess.
Limitations
2008 drawdown severity. At -42.0%, Germany's max drawdown was 4.6 points deeper than the DAX's. Financial and cyclical concentration in XETRA is worse in a credit crisis.
Multi-year European lag (2014-2015). A combined -16.6% excess across those two years reflects a risk specific to European equities during periods of sovereign stress and global rotation away from cyclicals.
2024 lag. The -21.5% excess gap in 2024 reflects the DAX's strong rally driven by a handful of large-cap names. The Graham Number screen, which selects cheaper mid-cap names, missed this move entirely.
Cyclical concentration. The strategy's returns are heavily tied to German industrial and financial cycles. In years when those sectors underperform (2005-2007, 2014-2015), the screen lags. It's not a hedge against sector rotation.
Annual rebalancing lag. With January rebalancing and a 45-day filing lag, the portfolio can hold a deteriorating position for up to 13 months before rotating out.
Run It Yourself
-- Current Graham Number screen (XETRA)
SELECT
    p.symbol,
    p.companyName,
    p.sector,
    p.exchange,
    ROUND(k.marketCap / 1e9, 2) AS mktcap_b,
    ROUND(k.grahamNumberTTM, 2) AS graham_number,
    ROUND(p.price, 2) AS current_price,
    ROUND(p.price / k.grahamNumberTTM, 3) AS price_to_gn
FROM profile p
JOIN key_metrics_ttm k ON p.symbol = k.symbol
WHERE p.exchange IN ('XETRA')
  AND k.marketCap BETWEEN 500000000 AND 500000000000
  AND k.grahamNumberTTM > 0
  AND k.grahamNumberTTM < 10000
  AND p.price > 1
  AND p.price < k.grahamNumberTTM
ORDER BY price_to_gn ASC
LIMIT 30
Run Germany Graham Number screen live →
git clone https://github.com/ceta-research/backtests.git
cd backtests

# Germany backtest
python3 graham-number/backtest.py --preset germany --output results.json --verbose

# Current screen
python3 graham-number/screen.py --preset germany
Part of a Series
This is the Germany analysis. We tested the Graham Number screen across markets globally:
- Global comparison →: How the strategy performs across 12 exchanges, and where Graham's formula still works
- US analysis →: 7.01% CAGR, 68.8% down capture over 25 years
- Switzerland analysis →: Best Sharpe of the European exchanges, with genuine downside protection
- Japan analysis →: Book-value-rich market where the screen finds a very different opportunity set

Data: Ceta Research (FMP financial data warehouse), 2000-2024. Universe: XETRA. Returns in EUR. Benchmark: DAX. Full methodology: METHODOLOGY.md. Past performance does not guarantee future results.


