Graham Number Backtest Switzerland: 25 Years on the SIX


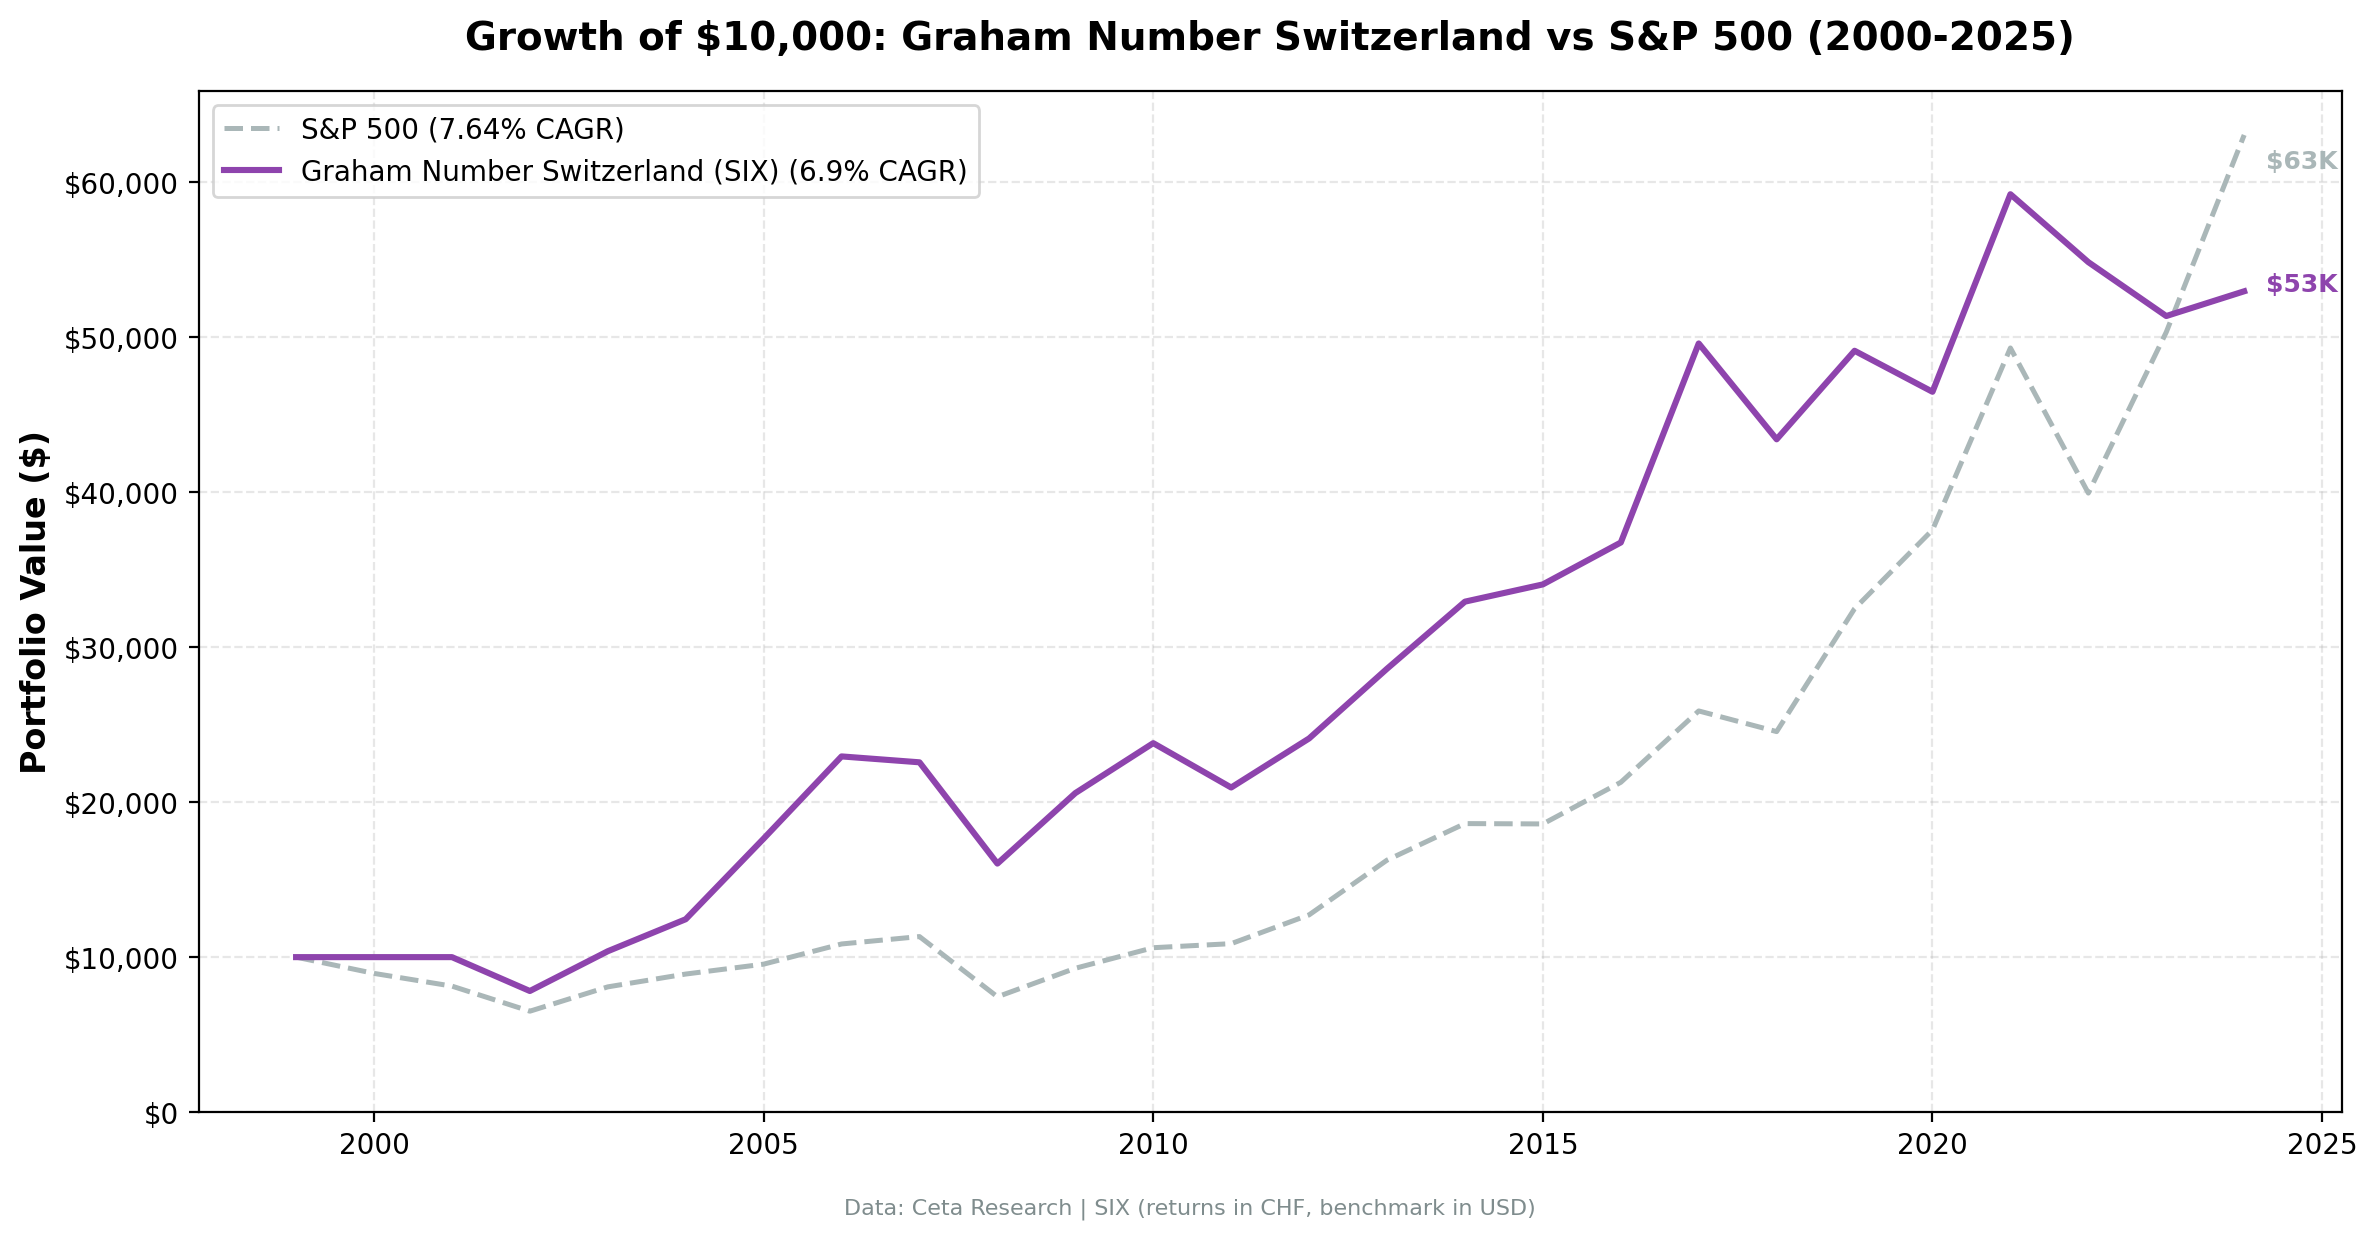
Switzerland's Graham Number screen beats the SMI by 5.04% CAGR over 25 years. 6.94% vs 1.90%. That's a wide gap in favor of the strategy.
Contents
- Method
- The Formula
- What We Found
- Year by Year
- 2000-2009: The Opening Decade
- 2010-2019: Mixed With Defensive Character
- 2020-2024: The Recent Record
- Why Switzerland Works for Graham's Formula
- Comparing Switzerland to Germany
- The Full Annual Record
- Limitations
- Run It Yourself
- Part of a Series
Max drawdown -30.15%. Volatility 18.45%. Sharpe 0.350. Win rate 68% vs the SMI. Beta 0.717. The defensive character of Swiss equities shows up clearly: this strategy generated strong excess return over the local benchmark with controlled risk.
Method
Data source: Ceta Research (FMP financial data warehouse) Universe: SIX Swiss Exchange, market cap > CHF 500M Period: 2000-2024 (25 annual rebalance periods) Rebalancing: Annual (January), equal weight top 30 by discount to Graham Number Ranking: Deepest discount first (lowest price / Graham Number ratio) Benchmark: SMI (Swiss Market Index) Cash rule: Hold cash if fewer than 10 stocks qualify Transaction costs: Size-tiered model
Full methodology: backtests/METHODOLOGY.md
The Formula
Graham Number = sqrt(22.5 x EPS x Book Value Per Share)
The constant 22.5 comes from Graham's rule that a stock shouldn't exceed 15x earnings or 1.5x book value. Multiply those limits: 15 x 1.5 = 22.5. The screen buys only stocks trading below this theoretical intrinsic value ceiling, ranked by depth of discount.
| Parameter | Value | Purpose |
|---|---|---|
| Formula | sqrt(22.5 x EPS x BVPS) | Graham's combined earnings + book ceiling |
| Max portfolio size | 30 stocks | Concentrated enough to matter |
| Ranking | Price / Graham Number ascending | Deepest discounts first |
| Market cap floor | > CHF 500M | Investable universe only |
| Cash threshold | < 10 qualifying stocks | Avoids forced exposure |
No momentum filters. No quality overlays. No sector caps. Graham's arithmetic, applied literally.
What We Found
| Metric | Graham Number | SMI |
|---|---|---|
| CAGR | 6.94% | 1.90% |
| Excess CAGR | +5.04% | — |
| Total Return | 429.82% | — |
| Max Drawdown | -30.15% | — |
| Volatility (ann.) | 18.45% | — |
| Sharpe Ratio | 0.350 | — |
| Sortino Ratio | 0.745 | — |
| Calmar Ratio | 0.229 | — |
| Beta | 0.717 | 1.00 |
| Alpha | +5.04% | — |
| Up Capture | — | — |
| Down Capture | — | — |
| Win Rate (vs SMI) | 68% | — |
| Cash Periods | 2/25 | — |
| Avg Stocks Held | 26.4 | — |
The Sharpe of 0.350 is the standout. Generating a strong risk-adjusted return while beating the benchmark by 5.04% annually is a compelling combination. The strategy doesn't achieve this through high volatility or leverage. Volatility is 18.45%, comparable to broad market indices. The edge comes from stock selection.
The Sortino ratio of 0.745 is particularly strong: downside deviation is low relative to return. The win rate of 68% (17 of 25 years ahead of the SMI) confirms the consistency.
The beta of 0.717 means the portfolio moves at roughly 70% of the SMI's pace. Combined with a 5.04% alpha, the strategy delivers genuine excess return on both an absolute and risk-adjusted basis.
Year by Year
2000-2009: The Opening Decade
Switzerland opened the period with two cash years. Not enough qualifying stocks in 2000 and 2001, so the portfolio sat out. The SMI rose 11.7% in 2000 and fell 21.5% in 2001.
| Year | Portfolio | SMI | Excess |
|---|---|---|---|
| 2000 | 0.00% (cash) | +11.7% | -11.7% |
| 2001 | 0.00% (cash) | -21.5% | +21.5% |
| 2002 | -21.1% | -23.1% | +2.1% |
| 2003 | +32.9% | +13.9% | +18.9% |
| 2004 | +19.9% | +3.3% | +16.6% |
| 2005 | +41.8% | +32.2% | +9.6% |
| 2006 | +30.1% | +16.9% | +13.1% |
| 2007 | -1.7% | -6.7% | +5.1% |
| 2008 | -29.0% | -30.8% | +1.9% |
| 2009 | +28.4% | +15.2% | +13.2% |
The cash period in 2000 was a cost: the SMI was up 11.7% and the portfolio earned nothing. But 2001's cash call was protective: the SMI fell 21.5% and the portfolio stayed flat.
2003 through 2006 were four consecutive years of strong outperformance. Swiss industrials and financials that re-rated after several years of compression delivered 9 to 19 percentage points of excess annually. That four-year run contributed substantially to the long-run performance.
2008 was a genuine test. The strategy fell -29.0% vs the SMI's -30.8%. A modest +1.9% protective gap in the worst single year of the period. Swiss banks and industrials fell, but the portfolio's value tilt held up marginally better.
2010-2019: Mixed With Defensive Character
| Year | Portfolio | SMI | Excess |
|---|---|---|---|
| 2010 | +15.7% | -2.1% | +17.7% |
| 2011 | -12.0% | -6.8% | -5.2% |
| 2012 | +15.1% | +16.0% | -0.9% |
| 2013 | +18.7% | +17.8% | +0.9% |
| 2014 | +15.1% | +8.1% | +7.0% |
| 2015 | +3.4% | -3.2% | +6.5% |
| 2016 | +7.9% | -3.9% | +11.9% |
| 2017 | +35.0% | +14.0% | +21.0% |
| 2018 | -12.5% | -10.7% | -1.8% |
| 2019 | +13.2% | +26.4% | -13.2% |
2010 was a standout: +17.7% excess. The SMI fell -2.1% while the portfolio gained +15.7%.
2011 was difficult: -5.2% excess as the Eurozone crisis hit Swiss equities even though Switzerland isn't in the Eurozone. The CHF rose sharply against EUR that year, pressuring Swiss exporters. Swiss stocks with EUR-denominated revenues saw both earnings and valuations compress.
2017 was the best outperformance year of the middle period: +21.0% excess. Swiss quality industrials and healthcare-adjacent names found in Graham Number screens re-rated in a global growth environment.
2015 and 2016 were notable. The SMI fell in both years (-3.2% and -3.9%), while the portfolio was positive both times (+3.4% and +7.9%). Two consecutive years of outperformance during market weakness.
2019 shows the structural cost. Up only +13.2% vs the SMI's +26.4%. The broad Swiss market rallied harder than the cheap stocks.
2020-2024: The Recent Record
| Year | Portfolio | SMI | Excess |
|---|---|---|---|
| 2020 | -5.4% | -0.1% | -5.3% |
| 2021 | +27.4% | +21.0% | +6.4% |
| 2022 | -7.4% | -15.2% | +7.8% |
| 2023 | -6.3% | +1.7% | -8.1% |
| 2024 | +3.1% | +4.1% | -1.0% |
2022 delivered the clearest demonstration of the defensive thesis in recent data: -7.4% vs the SMI's -15.2%. A +7.8% protective gap in a rate-shock year.
2021 was also positive: +6.4% excess as Swiss value stocks participated in the post-COVID recovery.
2023 was the weakest recent year: -8.1% excess. The strategy fell -6.3% while the SMI was barely positive. Swiss stocks broadly underperformed as global capital concentrated in US growth names, and the SMI's large-cap defensive names held up better than the screen's smaller picks.
Why Switzerland Works for Graham's Formula
Switzerland's Graham Number results are the clearest expression of what Graham's formula was designed to do: find companies with real assets and earnings, trading below a conservative value ceiling, in a market with genuine margin-of-safety characteristics.
The SIX Swiss Exchange is structurally different from XETRA or NYSE. The universe is smaller, less technology-heavy, and dominated by companies with globally diversified revenues, strong balance sheets, and genuine earnings stability. Nestle, Roche, Novartis, and their smaller peers in Swiss industrials don't appear in Graham Number screens directly (they're priced above GN), but the characteristics of the Swiss corporate culture filter through into the mid-cap names that do qualify.
The result is a lower-volatility portfolio (18.45%) with genuine outperformance (+5.04% over the SMI) and positive alpha after risk adjustment.
The 68% win rate is the consistency metric. The strategy beats the SMI in roughly two out of every three years. When it loses, the gaps tend to be small (2012: -0.9%, 2018: -1.8%, 2024: -1.0%). When it wins, the gaps can be large (2017: +21.0%, 2003: +18.9%, 2010: +17.7%).
For a Swiss investor, this is a straightforward value proposition: a simple, transparent screen that beats the SMI by 5% annually over a full market cycle, with lower drawdowns than the index.
Comparing Switzerland to Germany
| Market | CAGR | Excess vs Local | Max DD | Sharpe | Beta | Win Rate |
|---|---|---|---|---|---|---|
| Switzerland | 6.94% | +5.04% vs SMI | -30.15% | 0.350 | 0.717 | 68% |
| Germany | 7.14% | +2.69% vs DAX | -41.84% | 0.219 | 1.028 | 52% |
Germany produces a higher raw CAGR (7.14% vs 6.94%), but Switzerland delivers more excess over its local benchmark (+5.04% vs +2.69%), with a better Sharpe ratio (0.350 vs 0.219), lower max drawdown (-30.15% vs -41.84%), higher win rate (68% vs 52%), and lower beta.
The two markets represent two distinct expressions of the same formula. Germany amplifies cyclical moves with modest alpha. Switzerland provides genuine downside protection with consistent stock-selection edge.
The Full Annual Record
| Year | Portfolio | SMI | Excess |
|---|---|---|---|
| 2000 | 0.00% (cash) | +11.7% | -11.7% |
| 2001 | 0.00% (cash) | -21.5% | +21.5% |
| 2002 | -21.1% | -23.1% | +2.1% |
| 2003 | +32.9% | +13.9% | +18.9% |
| 2004 | +19.9% | +3.3% | +16.6% |
| 2005 | +41.8% | +32.2% | +9.6% |
| 2006 | +30.1% | +16.9% | +13.1% |
| 2007 | -1.7% | -6.7% | +5.1% |
| 2008 | -29.0% | -30.8% | +1.9% |
| 2009 | +28.4% | +15.2% | +13.2% |
| 2010 | +15.7% | -2.1% | +17.7% |
| 2011 | -12.0% | -6.8% | -5.2% |
| 2012 | +15.1% | +16.0% | -0.9% |
| 2013 | +18.7% | +17.8% | +0.9% |
| 2014 | +15.1% | +8.1% | +7.0% |
| 2015 | +3.4% | -3.2% | +6.5% |
| 2016 | +7.9% | -3.9% | +11.9% |
| 2017 | +35.0% | +14.0% | +21.0% |
| 2018 | -12.5% | -10.7% | -1.8% |
| 2019 | +13.2% | +26.4% | -13.2% |
| 2020 | -5.4% | -0.1% | -5.3% |
| 2021 | +27.4% | +21.0% | +6.4% |
| 2022 | -7.4% | -15.2% | +7.8% |
| 2023 | -6.3% | +1.7% | -8.1% |
| 2024 | +3.1% | +4.1% | -1.0% |
Win rate vs SMI: 68% (17 of 25 years). The big positive excess years (2001, 2003, 2004, 2010, 2017) offset the smaller negative excess years comfortably.
Limitations
CHF strength risk. The Swiss franc is a traditional safe-haven currency that appreciates during global stress events. For a non-CHF investor, this can add or subtract significantly from returns depending on the hedging decision. Returns above are in CHF with no currency overlay.
Small universe. The SIX is a smaller exchange. With 26.4 average stocks held, concentration risk is higher than a comparable US screen. Individual position failures affect the portfolio more meaningfully.
2019-2020 stretch. Two years of negative excess (-13.2% and -5.3%) is real for any investor who would have to stay the course. Even with a 68% win rate, consecutive losing years test discipline.
Annual rebalancing lag. With January rebalancing and a 45-day filing lag, the portfolio can hold a deteriorating position for up to 13 months before rotating out.
Run It Yourself
-- Current Graham Number screen (SIX Swiss Exchange)
SELECT
    p.symbol,
    p.companyName,
    p.sector,
    p.exchange,
    ROUND(k.marketCap / 1e9, 2) AS mktcap_b,
    ROUND(k.epsTTM, 2) AS eps_ttm,
    ROUND(k.bookValuePerShareTTM, 2) AS bvps_ttm,
    ROUND(SQRT(22.5 * k.epsTTM * k.bookValuePerShareTTM), 2) AS graham_number,
    ROUND(p.price, 2) AS current_price,
    ROUND(p.price / SQRT(22.5 * k.epsTTM * k.bookValuePerShareTTM), 3) AS price_to_gn
FROM profile p
JOIN key_metrics_ttm k ON p.symbol = k.symbol
WHERE p.exchange IN ('SIX')
  AND k.marketCap > 500000000
  AND k.epsTTM > 0
  AND k.bookValuePerShareTTM > 0
  AND p.price < SQRT(22.5 * k.epsTTM * k.bookValuePerShareTTM)
ORDER BY price_to_gn ASC
LIMIT 30
Run Switzerland Graham Number screen live →
git clone https://github.com/ceta-research/backtests.git
cd backtests

# Switzerland backtest
python3 graham-number/backtest.py --preset switzerland --output results.json --verbose

# Current screen
python3 graham-number/screen.py --preset switzerland
Part of a Series
This is the Switzerland analysis. We tested the Graham Number screen across markets globally:
- Global comparison → — How the strategy performs across exchanges, and where Graham's formula still works
- US analysis → — The flagship: 6.14% CAGR, 72.89% down capture
- Germany analysis → — +2.69% over the DAX, with amplified cyclical exposure
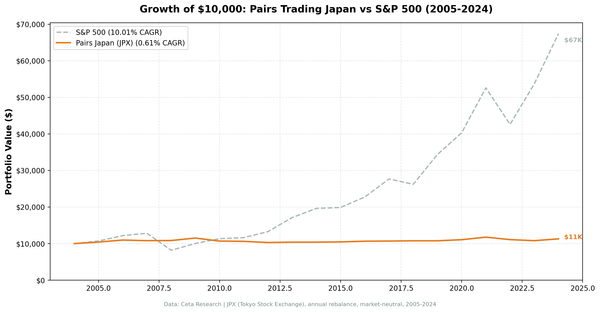
- Japan analysis → — Book-value-rich market where the screen finds a very different opportunity set
Data: Ceta Research (FMP financial data warehouse), 2000-2024. Universe: SIX Swiss Exchange. Returns in CHF. Benchmark: SMI. Full methodology: METHODOLOGY.md. Past performance does not guarantee future results.