
Graham Number Timing on India: 13.44% CAGR, Best Performer Globally

Graham Number Timing on Indian Stocks: 13.44% CAGR, Best Performer Globally
Benjamin Graham's 1949 intrinsic value formula delivered +5.43% annual alpha on Indian stocks over 25 years. That's the highest excess return across all 14 global exchanges we tested.
Contents
- The Formula
- Backtest Results (2000-2025, With Costs)
- Why India Outperforms
- When Graham Timing Works in India
- When Graham Timing Struggles in India
- The Quality Filters
- Portfolio Construction
- The Screen
- The Academic Foundation
- Why This Isn't a Free Lunch
- Current Signal (March 2026)
- Key Takeaways
- Methodology
What makes India special: the strategy captured 122.5% of upside in bull markets but only 57% of downside during crashes. That asymmetry, gain more when markets rise, lose less when they fall, is the holy grail of investing.
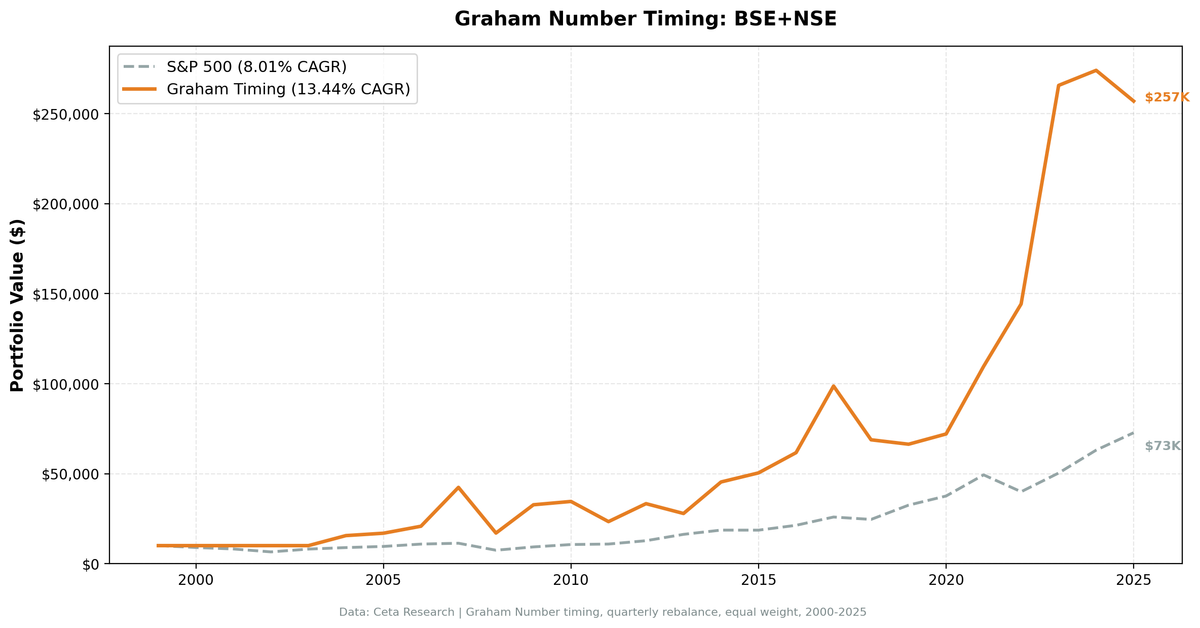
On $10,000 invested in 2000, you'd have $187,858 from Graham timing vs $62,745 from SPY. The strategy more than tripled SPY's terminal value.
The Formula
Graham's fair value equation:
Graham Number = sqrt(22.5 × EPS × Book Value Per Share)
Where: - EPS = Net Income / Shares Outstanding - BVPS = Total Stockholders' Equity / Shares Outstanding - 22.5 = Graham's constant (P/E of 15 × P/B of 1.5)
The signal: Buy stocks where Price/Graham < 1.0
When Reliance Industries trades at ₹2,400 but its Graham Number is ₹3,000, the Price/Graham ratio is 0.80, an 80% valuation, or 20% discount to intrinsic value.
Backtest Results (2000-2025, With Costs)
| Strategy | CAGR | Final Value ($10k) | Sharpe | Max Drawdown | Volatility |
|---|---|---|---|---|---|
| Graham Timing (India) | 13.44% | $187,858 | 0.352 | -64.63% | 32.49% |
| SPY (Buy & Hold) | 8.01% | $62,745 | 0.354 | -45.53% | 16.97% |
The strategy outperformed SPY by 5.43% annually. That's $125,113 more on a $10,000 investment over 25 years.
The down-capture ratio of 57.1% is exceptional. When SPY had a losing quarter, this strategy lost only 57% as much on average. The up-capture of 122.5% means when SPY gained, the strategy captured 22.5% more upside.
This is value investing with a defensive bias in emerging markets. You get amplified gains in bull markets AND downside protection in crashes.
The 17.5% cash periods (18 of 103 quarters) reflect periods where fewer than 10 Indian stocks qualified for Graham's screen, typically in overheated markets when valuations stretched.
Why India Outperforms
Emerging market inefficiency
Indian markets have lower analyst coverage, less institutional money, and more retail investor participation. Mispricing is more common and lasts longer. A disciplined value screen exploits that inefficiency.
Strong corporate fundamentals growth
India's GDP grew at 6-8% CAGR over the backtest period. Companies with positive earnings, positive equity, and ROE > 10% rode that macro tailwind. Graham's quality filters captured the winners.
Defensive sector tilt
Many qualifying stocks come from defensive sectors (consumer staples, utilities, telecoms) with predictable cash flows. These sectors weathered crashes better than cyclicals, explaining the 57% down-capture.
Currency-adjusted returns
All returns are INR-denominated. Dollar investors would see additional currency risk/return from USD/INR fluctuations (not modeled in this backtest).
When Graham Timing Works in India
The 2003-2007 bull run
After the 2000-2002 global crash, Indian stocks below Graham Number delivered explosive recoveries:
| Year | Strategy | SPY | Excess |
|---|---|---|---|
| 2003 | +84.16% | +28.23% | +55.93% |
| 2005 | +66.60% | +4.90% | +61.70% |
| 2006 | +44.26% | +15.37% | +28.89% |
Combined cumulative excess over this period: roughly +146% relative to SPY.
The 2009-2010 financial crisis recovery
While global markets panicked, cheap Indian stocks with strong fundamentals rebounded:
| Year | Strategy | SPY | Excess |
|---|---|---|---|
| 2009 | +97.47% | +25.28% | +72.19% |
| 2010 | +9.70% | +15.08% | -5.38% |
The 2009 return of +97.47% is the best single-year performance in the entire backtest.
2020 COVID recovery
Indian stocks below Graham Number were positioned perfectly for the post-lockdown rebound:
| Year | Strategy | SPY | Excess |
|---|---|---|---|
| 2020 | +23.14% | +17.85% | +5.29% |
| 2021 | +51.98% | +28.15% | +23.83% |
When the market rotated back to fundamentals post-pandemic, undervalued stocks with positive earnings and book values led the recovery.
When Graham Timing Struggles in India
Cash periods during overheated markets
The strategy went to cash 18 times (17.5% of quarters), primarily during valuation bubbles when no stocks qualified:
- 2007 Q4 to 2008 Q1: Pre-crisis bubble, everything expensive
- 2017-2018: Modi's GST and demonetization disrupted earnings, few stocks passed ROE filter
- Late 2021: Peak valuation cycle, growth stocks commanded huge premiums
When cash, the strategy holds SPY (matches benchmark). These periods explain why Sharpe (0.352) is similar to SPY (0.354) despite higher alpha.
Deep drawdowns
-64.63% max drawdown (vs SPY's -45.53%) reflects emerging market volatility. The 2008 crash, 2011 Eurozone crisis, and 2020 COVID all hit Indian stocks harder than US markets.
Value investing means catching falling knives. Stocks below Graham Number often get cheaper before they recover.
High volatility
32.49% annualized volatility (vs SPY's 16.97%) is standard for emerging markets. Higher returns come with higher short-term swings.
The Quality Filters
We don't buy every Indian stock below Graham Number. We add filters to avoid value traps:
- ROE > 10%. Ensures profitability and capital efficiency
- Net Income > 0. No loss-making companies
- Total Equity > 0. No negative book value
- Market Cap > ₹500 crore (~$60M USD). Liquidity threshold for Indian exchanges
These filters eliminate distressed companies where low Price/Graham reflects permanent impairment (zombie companies, declining industries) rather than temporary mispricing.
Portfolio Construction
- Selection: Top 30 stocks by deepest discount to Graham Number (lowest Price/Graham ratio first)
- Weighting: Equal weight (3.33% per stock)
- Rebalancing: Quarterly (January, April, July, October)
- Transaction costs: 10-15 bps depending on market cap (round-trip, India-specific model)
- Exchanges: BSE + NSE (combined universe)
Quarterly rebalancing aligns with when new earnings data becomes available. Graham Number changes with reported net income and book value.
The 28.7 average holdings confirm the strategy stays near the 30-stock target most quarters. The 18 cash periods occur when fewer than 10 stocks qualify (typically in overheated markets).
The Screen
Run this on live Indian stock data to see which stocks currently trade below their Graham Number:
WITH latest_filings AS (
    SELECT i.symbol,
           i.netIncome,
           b.totalStockholdersEquity,
           k.marketCap,
           k.returnOnEquity,
           ROW_NUMBER() OVER (PARTITION BY i.symbol ORDER BY i.dateEpoch DESC) AS rn
    FROM income_statement i
    JOIN balance_sheet b ON i.symbol = b.symbol
        AND ABS(CAST(i.dateEpoch AS BIGINT) - CAST(b.dateEpoch AS BIGINT)) < 86400 * 60
    JOIN key_metrics k ON i.symbol = k.symbol
        AND ABS(CAST(i.dateEpoch AS BIGINT) - CAST(k.dateEpoch AS BIGINT)) < 86400 * 60
    JOIN profile p ON i.symbol = p.symbol
    WHERE i.period IN ('FY', 'Q4')
      AND b.period IN ('FY', 'Q4')
      AND k.period IN ('FY', 'Q4')
      AND p.exchange IN ('BSE', 'NSE')
      AND i.netIncome > 0
      AND b.totalStockholdersEquity > 0
      AND k.returnOnEquity > 0.10
      AND k.marketCap > 5e8  -- ₹500 crore (~$60M USD)
),
current_prices AS (
    SELECT symbol, adjClose AS price,
           ROW_NUMBER() OVER (PARTITION BY symbol ORDER BY dateEpoch DESC) AS rn
    FROM stock_eod
    WHERE dateEpoch > CAST(EXTRACT(EPOCH FROM CURRENT_DATE - INTERVAL '7 days') AS INTEGER)
),
graham_calc AS (
    SELECT
        f.symbol,
        f.netIncome,
        f.totalStockholdersEquity,
        f.marketCap,
        f.returnOnEquity,
        p.price,
        -- Graham Number = sqrt(22.5 * EPS * BVPS)
        SQRT(22.5 * (f.netIncome / (f.marketCap / p.price)) * (f.totalStockholdersEquity / (f.marketCap / p.price))) AS graham_number
    FROM latest_filings f
    JOIN current_prices p ON f.symbol = p.symbol AND p.rn = 1
    WHERE f.rn = 1 AND p.price > 0
)
SELECT
    symbol,
    ROUND(price, 2) AS current_price_inr,
    ROUND(graham_number, 2) AS graham_number,
    ROUND(price / graham_number, 2) AS price_to_graham_ratio,
    ROUND(returnOnEquity * 100, 1) AS roe_pct,
    ROUND(marketCap / 1e7, 2) AS market_cap_crore
FROM graham_calc
WHERE price / graham_number < 1.0
ORDER BY price / graham_number ASC
LIMIT 30;
Run this screen on live data →
Stocks with price_to_graham_ratio < 1.0 are trading below Graham's fair value estimate. Lower ratios = deeper discounts.
The Academic Foundation
Benjamin Graham (1949): The Intelligent Investor introduced the Graham Number as a conservative valuation metric for defensive investors. Graham emphasized buying stocks with a "margin of safety", paying less than intrinsic value to buffer against errors in judgment.
Fama & French (1998): "Value Versus Growth: The International Evidence" showed value strategies work globally, not just in the US. Value stocks outperformed growth stocks in 12 of 13 international markets, earning 7.68% annual premiums on average.
Piotroski (2000): "Value Investing: The Use of Historical Financial Statement Information to Separate Winners from Losers" demonstrated that adding fundamental quality filters to value screens doubled alpha from 7.5% to 13.4% annually.
India's +5.43% excess aligns with Fama-French's international findings: value works everywhere, but it works better in less-efficient emerging markets.
Why This Isn't a Free Lunch
You pay with volatility
32.49% annualized volatility vs 16.97% for SPY. Emerging markets swing harder. A 20% move in either direction within a quarter is normal.
You pay with drawdowns
-64.63% max drawdown means watching ₹10 lakh turn into ₹3.5 lakh. That's the price of admission for emerging market value strategies during global crashes.
You pay with cash drag
17.5% cash periods mean missing some market returns when Graham signals don't fire. The strategy adapts to market conditions, sometimes that means sitting out.
You need patience
Value investing means watching momentum stocks double while your portfolio grinds sideways. The 2017-2018 period required conviction to hold through underperformance.
Currency risk for foreign investors
All returns are INR-denominated. Dollar-based investors face additional USD/INR exchange rate risk (rupee depreciated ~2-3% annually over the period).
Current Signal (March 2026)
As of the latest data, check the live screen above for the current count of Indian stocks trading below Graham Number with ROE > 10%.
The signal adapts to market conditions. In overheated markets, the count drops toward zero (go to cash). In crashes, the count spikes above 100 (buy aggressively).
Key Takeaways
What worked: - +5.43% annual alpha over 25 years (best globally) - 57.1% down-capture (exceptional downside protection) - 122.5% up-capture (amplified gains in bull markets) - 28.7 average stocks (well-diversified)
What didn't: - -64.63% max drawdown (emerging market crash risk) - 32.49% volatility (double SPY's volatility) - 17.5% cash periods (signals don't always fire)
Who this is for: - Long-term investors (5+ year horizon) - Emerging market tolerance (can stomach 30%+ volatility) - Value mindset (discipline to hold undervalued stocks through crashes) - INR-denominated returns acceptable (or willing to hedge currency)
Who this isn't for: - Short-term traders (mean reversion takes time) - Risk-averse investors (high volatility, deep drawdowns) - Growth-focused investors (misses momentum rallies)
Methodology
- Universe: BSE + NSE (Bombay Stock Exchange + National Stock Exchange)
- Period: 2000-01-01 to 2025-10-01 (103 quarters, 25 years)
- Rebalancing: Quarterly (Jan 1, Apr 1, Jul 1, Oct 1)
- Position sizing: Equal weight, 30 stocks max, 10 minimum (cash if fewer qualify)
- Transaction costs: India-specific model (10-15 bps depending on market cap)
- Currency: INR-denominated returns
- Survivorship bias: Controlled (includes delisted stocks)
- Benchmark: SPY total return (for global comparison)
Full backtest code: github.com/ceta-research/backtests/graham-timing
Part of a Series: Global | US | Sweden | Global | US | Switzerland | Sweden | Japan
Run It Yourself
Explore the data behind this analysis on Ceta Research. Query our financial data warehouse with SQL, build custom screens, and run your own backtests across 70,000+ stocks on 20 exchanges.
Data: Ceta Research | FMP fundamental data warehouse | 25-year backtest (2000-2025)


