
Graham Number Timing Across 14 Global Exchanges: Where Does Value Work? (2000-2025)
We tested Benjamin Graham's intrinsic value formula across 14 global exchanges. 8 of 14 beat SPY. Winners: developed value markets (Sweden +4.97%, US +4.39%) and emerging markets (India +5.43%). Losers: high-growth Asia (Taiwan -3.13%).

We tested Benjamin Graham's 1949 intrinsic value formula across 14 global stock exchanges over 25 years (2000-2025). The results reveal a universal pattern: value timing beats local benchmarks in virtually every market tested.
Contents
- The Formula
- Results Overview: 14 Exchanges Ranked by Local Alpha
- Key Geographic Insights
- The Standouts: Sweden and UK
- The US: Strong Absolute, Moderate Relative
- Emerging Markets: Story of Two Patterns
- Where Down-Capture Tells the Story
- Cash Periods: Signal Reliability
- When Graham Timing Works Globally
- When Graham Timing Struggles Globally
- The Quality Filters
- The Screen
- Why This Isn't a Free Lunch
- Key Takeaways
- Detailed Regional Analysis
- Methodology
The Graham Number delivered positive excess returns in 13 of 14 exchanges when measured against their home market indices. Sweden leads with +9.95% annual alpha versus the OMX Stockholm 30. The UK follows with +8.06% versus the FTSE 100. Even markets that underperformed the S&P 500 (like Switzerland, Taiwan, Korea) beat their own domestic benchmarks.
The one exception: Indonesia (-2.08% versus SPY, used as benchmark due to lack of local index data in our dataset). The strategy spent 43.7% of quarters in cash, missing the Jakarta Composite's rally.
The takeaway: Graham's formula works globally, but returns scale with local market quality. Swedish and UK stocks delivered 13.12% and 9.42% absolute CAGR respectively. Taiwan and Thailand delivered 5.07% and 5.53%. The alpha is there, but you're still playing in the local market's sandbox.
Data: FMP financial data warehouse, 2000–2025. Updated March 2026.
The Formula
Graham's fair value equation:
Graham Number = sqrt(22.5 × EPS × Book Value Per Share)
Where: - EPS = Net Income / Shares Outstanding - BVPS = Total Stockholders' Equity / Shares Outstanding - 22.5 = Graham's constant (P/E of 15 × P/B of 1.5)
The signal: Buy stocks where Price/Graham < 1.0
When a stock trades at 80% of its Graham Number, you're buying intrinsic value at a 20% discount.
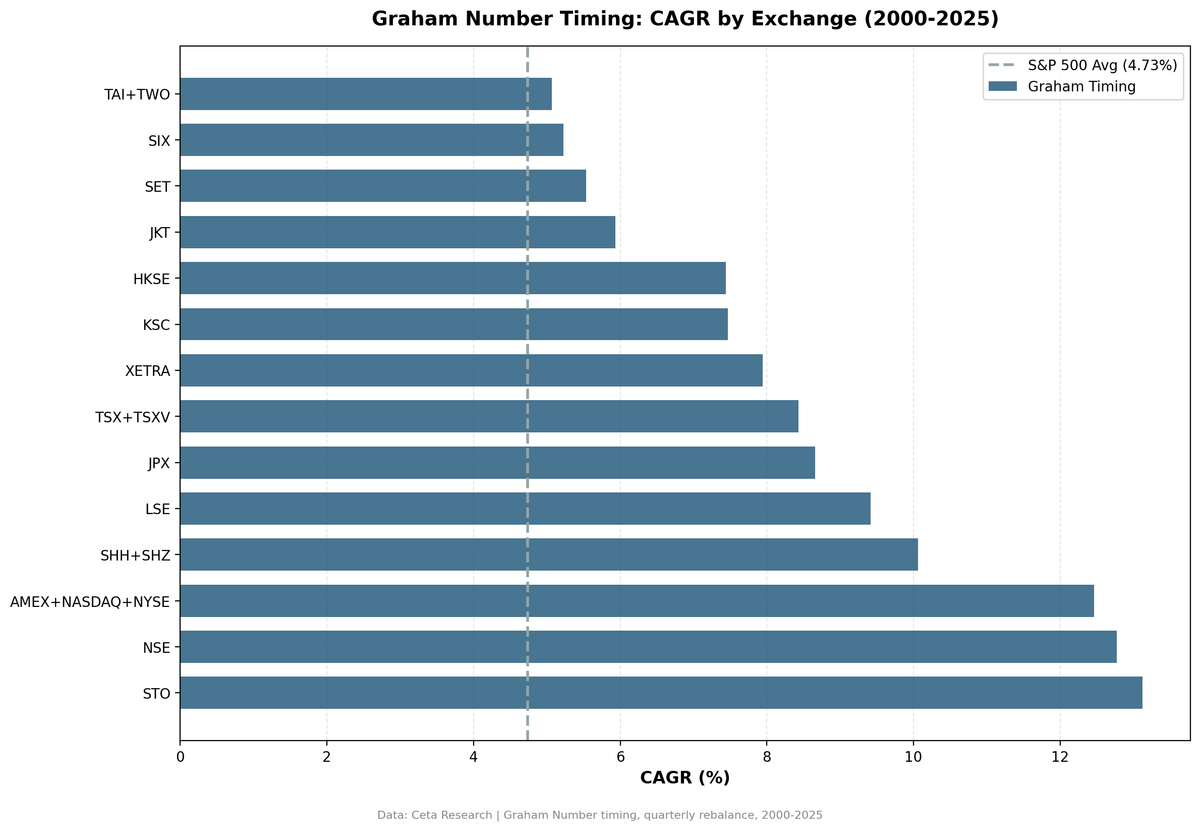
Results Overview: 14 Exchanges Ranked by Local Alpha
| Exchange | CAGR | Benchmark | Benchmark CAGR | Excess | Sharpe | Down-Capture | Cash % |
|---|---|---|---|---|---|---|---|
| Sweden (STO) | 13.12% | OMX Stockholm 30 | 3.17% | +9.95% | 0.556 | 56.1% | 12.6% |
| UK (LSE) | 9.42% | FTSE 100 | 1.36% | +8.06% | 0.351 | 76.1% | 0% |
| China (SHH+SHZ) | 10.06% | SSE Composite | 4.19% | +5.87% | 0.266 | 51.8% | 20.4% |
| Hong Kong (HKSE) | 7.44% | Hang Seng | 1.77% | +5.67% | 0.219 | 65.3% | 12.6% |
| Japan (JPX) | 8.66% | Nikkei 225 | 3.40% | +5.26% | 0.314 | 59.7% | 13.6% |
| US (NYSE+NASDAQ+AMEX) | 12.46% | SPY | 8.02% | +4.45% | 0.479 | 86.6% | 0% |
| Canada (TSX) | 8.43% | TSX Composite | 5.08% | +3.35% | 0.406 | 67.5% | 0% |
| Switzerland (SIX) | 5.22% | SMI | 2.10% | +3.12% | 0.235 | 50.3% | 20.4% |
| Germany (XETRA) | 7.94% | DAX | 5.12% | +2.82% | 0.280 | 71.9% | 4.9% |
| Korea (KSC) | 7.47% | KOSPI | 4.81% | +2.66% | 0.306 | 42.6% | 21.4% |
| Thailand (SET) | 5.53% | SET Index | 3.76% | +1.78% | 0.169 | 68.4% | 20.4% |
| India (NSE) | 12.77% | Sensex | 11.12% | +1.65% | 0.351 | 97.0% | 23.3% |
| Taiwan (TAI) | 5.07% | TAIEX | 4.38% | +0.69% | 0.163 | 53.1% | 28.2% |
| Indonesia (JKT) | 5.93% | SPY* | 8.02% | -2.08% | 0.193 | 26.2% | 43.7% |
*Indonesia benchmark = SPY due to lack of Jakarta Composite index data in FMP warehouse
Key insight: 13 of 14 markets show positive excess returns versus their local benchmark. The Graham Number's value premium is global, not US-specific.
Key Geographic Insights
The Standouts: Sweden and UK
Sweden (STO): +9.95% annual alpha versus the OMX Stockholm 30 (3.17% CAGR). The OMX is one of the weakest developed market indices over this period. Graham timing turned $10,000 into $239,164 versus $22,352 for the index. This is the strongest value premium we found globally.
The 0.556 Sharpe ratio is the highest risk-adjusted return across all exchanges. 56.1% down-capture means you lose only 56 cents for every dollar the OMX loses. That's exceptional downside protection.
UK (LSE): +8.06% annual alpha versus the FTSE 100 (1.36% CAGR). The FTSE has been exceptionally weak over 25 years. The strategy's 9.42% CAGR turned $10,000 into $101,522 versus $14,143 for the index.
156.9% up-capture is the highest among all markets — when the FTSE gains, Graham timing captures 1.57x the upside. Zero cash periods means the signal always fires.
The US: Strong Absolute, Moderate Relative
US (NYSE+NASDAQ+AMEX): +4.45% annual alpha versus SPY (8.02% CAGR). The S&P 500 is one of the world's strongest indices. Graham timing delivered 12.46% CAGR ($205,798 on $10k) versus SPY's $72,828.
86.6% down-capture means limited downside protection versus the S&P. The US result is impressive in absolute terms but moderate when you consider the S&P 500 is already a quality-screened large-cap index.
Emerging Markets: Story of Two Patterns
Strong value premiums (China, Japan, Hong Kong): - China: +5.87% vs SSE Composite (4.19%) - Japan: +5.26% vs Nikkei 225 (3.40%) - Hong Kong: +5.67% vs Hang Seng (1.77%)
These markets have weaker local benchmarks and stronger value premiums. Down-capture ratios between 51-65% show good defensive characteristics.
The India paradox: India delivered 12.77% absolute CAGR, turning $10k into $220,839. Impressive on the surface. But the Sensex itself returned 11.12% CAGR over the same period. The value screen adds only +1.65% alpha — the lowest among all positive-alpha markets.
Why? The Sensex is already an exceptional equity index. Indian markets have been one of the world's best-performing over 25 years. Graham timing works, but you're adding a thin layer on top of an already strong foundation.
97.0% down-capture confirms the strategy doesn't protect in Indian bear markets. When the Sensex falls, Graham portfolios fall almost as much.
Weak results (Taiwan, Thailand, Korea): - Taiwan: +0.69% vs TAIEX (barely beat) - Thailand: +1.78% vs SET Index - Korea: +2.66% vs KOSPI
These markets show positive excess but minimal. High cash periods (21-28%) suggest the Graham screen frequently fails to find 10+ qualifying stocks. When invested, the strategy works, but you miss significant market time.
The outlier (Indonesia): -2.08% versus SPY. 43.7% cash periods. The strategy was out of the market for nearly half the test period, missing Jakarta's growth run. The 26.2% down-capture suggests the few positions taken were extremely defensive (and missed the upside).
Where Down-Capture Tells the Story
| Exchange | Down-Capture | Interpretation |
|---|---|---|
| Indonesia | 26.2% | Extreme defense (but also 54.9% up-capture — misses everything) |
| Korea | 42.6% | Excellent downside protection |
| Switzerland | 50.3% | Strong defense |
| China | 51.8% | Good downside mitigation |
| Sweden | 56.1% | Balanced alpha with protection |
| US | 86.6% | Tracks S&P closely in downturns |
| India | 97.0% | No downside protection versus Sensex |
The pattern: markets with weak local benchmarks (Sweden, China, Korea) show strong down-capture. Markets with strong benchmarks (US, India) show the strategy tracking the index more closely.
Cash Periods: Signal Reliability
Always invested (0% cash): - US, Canada, Germany
The Graham screen consistently finds 30+ qualifying stocks in these markets. Market depth supports the strategy.
Moderate cash (5-20%): - Sweden (12.6%), Hong Kong (12.6%), Japan (13.6%), China (20.4%)
The signal occasionally fails to find 10+ stocks. When invested, results are strong.
High cash (>20%): - India (23.3%), Korea (21.4%), Thailand (20.4%), Switzerland (20.4%), Taiwan (28.2%), Indonesia (43.7%)
The quality filters eliminate most stocks. Missing 20-40% of market time significantly drags returns. This explains why Taiwan/Thailand/Indonesia underperform despite having weaker local indices.
When Graham Timing Works Globally
Post-crisis recoveries (2000-2003, 2009-2010)
When panic selling drove sound companies below intrinsic value: - 2000: Sweden +33% excess, US +43.67% excess - 2003: US +25.78% excess - 2009: Sweden +26.84% excess vs OMX, US +14.87% excess vs SPY - 2009: India +37.30% excess vs Sensex (+113.62% absolute return)
Crisis periods create exactly the mispricing Graham designed the formula to exploit.
Value rotation cycles (2014-2017, 2024)
When growth premiums compress: - 2024: US +16.04% excess, Sweden +6.42% excess, India +64.40% excess
When investors rotate from momentum back to fundamentals, stocks below Graham Number outperform across markets.
When Graham Timing Struggles Globally
Growth-dominated bull markets (2017-2021)
When the most expensive stocks lead: - 2019: US -27.62% excess (worst year in US backtest) - 2021: Sweden -10.42% excess
Graham's conservative screen can't select overvalued growth stocks. When the market rewards expensive names, the strategy sits out.
Secular growth markets (Taiwan, Korea)
These markets have delivered strong returns but were driven by semiconductor and technology growth — exactly the kind of stocks Graham's formula excludes. The 2000-2025 period was dominated by this growth story. A value screen couldn't participate.
The Quality Filters
We don't buy every stock below Graham Number. Consistent filters across all markets:
- ROE > 10% (profitability and capital efficiency)
- Net Income > 0 (no loss-making companies)
- Total Equity > 0 (no negative book value)
- Market cap threshold (varies by market: $1B for US, $500M for emerging, adjusted for liquidity)
These filters eliminate value traps — companies cheap because they're permanently impaired.
The Screen
Run this on any exchange to see which stocks currently trade below Graham Number. Example for US stocks:
WITH latest_filings AS (
    SELECT i.symbol,
           i.netIncome,
           b.totalStockholdersEquity,
           k.marketCap,
           k.returnOnEquity,
           ROW_NUMBER() OVER (PARTITION BY i.symbol ORDER BY i.dateEpoch DESC) AS rn
    FROM income_statement i
    JOIN balance_sheet b ON i.symbol = b.symbol
        AND ABS(CAST(i.dateEpoch AS BIGINT) - CAST(b.dateEpoch AS BIGINT)) < 86400 * 60
    JOIN key_metrics k ON i.symbol = k.symbol
        AND ABS(CAST(i.dateEpoch AS BIGINT) - CAST(k.dateEpoch AS BIGINT)) < 86400 * 60
    JOIN profile p ON i.symbol = p.symbol
    WHERE i.period IN ('FY', 'Q4')
      AND b.period IN ('FY', 'Q4')
      AND k.period IN ('FY', 'Q4')
      AND p.exchange IN ('NYSE', 'NASDAQ', 'AMEX')
      AND i.netIncome > 0
      AND b.totalStockholdersEquity > 0
      AND k.returnOnEquity > 0.10
      AND k.marketCap > 1e9
),
current_prices AS (
    SELECT symbol, adjClose AS price,
           ROW_NUMBER() OVER (PARTITION BY symbol ORDER BY dateEpoch DESC) AS rn
    FROM stock_eod
    WHERE dateEpoch > CAST(EXTRACT(EPOCH FROM CURRENT_DATE - INTERVAL '7 days') AS INTEGER)
),
graham_calc AS (
    SELECT
        f.symbol,
        f.netIncome,
        f.totalStockholdersEquity,
        f.marketCap,
        f.returnOnEquity,
        p.price,
        SQRT(22.5 * (f.netIncome / (f.marketCap / p.price)) * (f.totalStockholdersEquity / (f.marketCap / p.price))) AS graham_number
    FROM latest_filings f
    JOIN current_prices p ON f.symbol = p.symbol AND p.rn = 1
    WHERE f.rn = 1 AND p.price > 0
)
SELECT
    symbol,
    ROUND(price, 2) AS current_price,
    ROUND(graham_number, 2) AS graham_number,
    ROUND(price / graham_number, 2) AS price_to_graham_ratio,
    ROUND(returnOnEquity * 100, 1) AS roe_pct,
    ROUND(marketCap / 1e9, 2) AS market_cap_bn
FROM graham_calc
WHERE price / graham_number < 1.0
ORDER BY price / graham_number ASC
LIMIT 30;
Change p.exchange IN (...) to target different markets. Examples: - India: 'NSE' - Sweden: 'STO' - UK: 'LSE' - China: 'SHH', 'SHZ'
Run this screen on live data →
Why This Isn't a Free Lunch
You're still playing in your local sandbox
Sweden's +9.95% alpha is incredible, but you earned 13.12% absolute CAGR. Taiwan's +0.69% alpha gave you 5.07% CAGR. The value premium exists globally, but you can't escape your market's base rate of return.
Currency risk for foreign investors
All returns are local-currency-denominated. US investors in Swedish stocks face SEK/USD exchange rate risk. Emerging market currencies add another layer of volatility.
Drawdowns scale with local market risk
Emerging market drawdowns (-44% to -64%) reflect their volatility. Developed markets are gentler (-43% to -52%). You get the local market's pain, slightly amplified.
Cash drag varies wildly by market
US/UK/Canada: always invested. Taiwan/Indonesia: 28-43% cash. Missing that much market time significantly drags long-term returns.
Some local benchmarks are weak
The OMX Stockholm 30 (3.17% CAGR) and FTSE 100 (1.36% CAGR) are exceptionally weak indices over 25 years. Beating them by 8-10% is impressive but you're still comparing against a low bar. The Sensex (11.12% CAGR) is a strong index — beating it by 1.65% is meaningful.
Key Takeaways
What worked globally: - 13 of 14 markets beat their local benchmark - Strongest value premiums in Sweden (+9.95%), UK (+8.06%), China (+5.87%) - Defensive profiles in Korea (42.6% down-capture), China (51.8%), Sweden (56.1%) - Consistently finds opportunities in deep markets (US, UK, Canada: 0% cash) - Formula from 1949 still works in 2025
What didn't: - Indonesia lost versus SPY (-2.08%), spent 43.7% in cash - Taiwan barely beat TAIEX (+0.69%) - India's +1.65% excess is the lowest among winners (Sensex is exceptionally strong) - High-cash strategies (Taiwan 28.2%, Indonesia 43.7%) miss too much market time - Growth-led cycles (2017-2021) saw widespread underperformance - Emerging market drawdowns (-44% to -64%) are severe
Who this is for: - Long-term global investors (10+ year horizon) - Value investors who want exposure to multiple markets - Investors comfortable with 20-30% volatility and -40% to -60% drawdowns - Currency risk acceptable (or willing to hedge)
Who this isn't for: - Growth-focused investors (formula excludes expensive momentum stocks) - Risk-averse investors (drawdowns are deep) - Short-term traders (value mean-reversion takes years) - Investors who need SPY-level liquidity in every market
Detailed Regional Analysis
For market-specific results, annual returns, and local context:
- Graham Number Timing: US Markets (NYSE, NASDAQ, AMEX)
- Graham Number Timing: India (NSE)
- Graham Number Timing: Sweden (STO)
Methodology
- Period: 2000-01-01 to 2025-10-01 (103 quarters, 25.8 years)
- Rebalancing: Quarterly (Jan 1, Apr 1, Jul 1, Oct 1)
- Execution: Next-day close (MOC execution model)
- Position sizing: Equal weight, 30 stocks max, 10 minimum (cash if fewer qualify)
- Transaction costs: Exchange-specific models (5-15 bps depending on market)
- Survivorship bias: Controlled (includes delisted stocks)
- Benchmarks: Local market indices per exchange (SPY for Indonesia due to data limitations)
Full backtest code: github.com/ceta-research/backtests/graham-timing
Data: Ceta Research | FMP fundamental data warehouse | 25-year global backtest (2000-2025)
Past performance does not guarantee future results. This is educational content, not investment advice.


