
Graham Number Timing: When Stocks Trade Below Benjamin Graham's Fair

Graham Number Timing: When Stocks Trade Below Benjamin Graham's Fair Value Formula
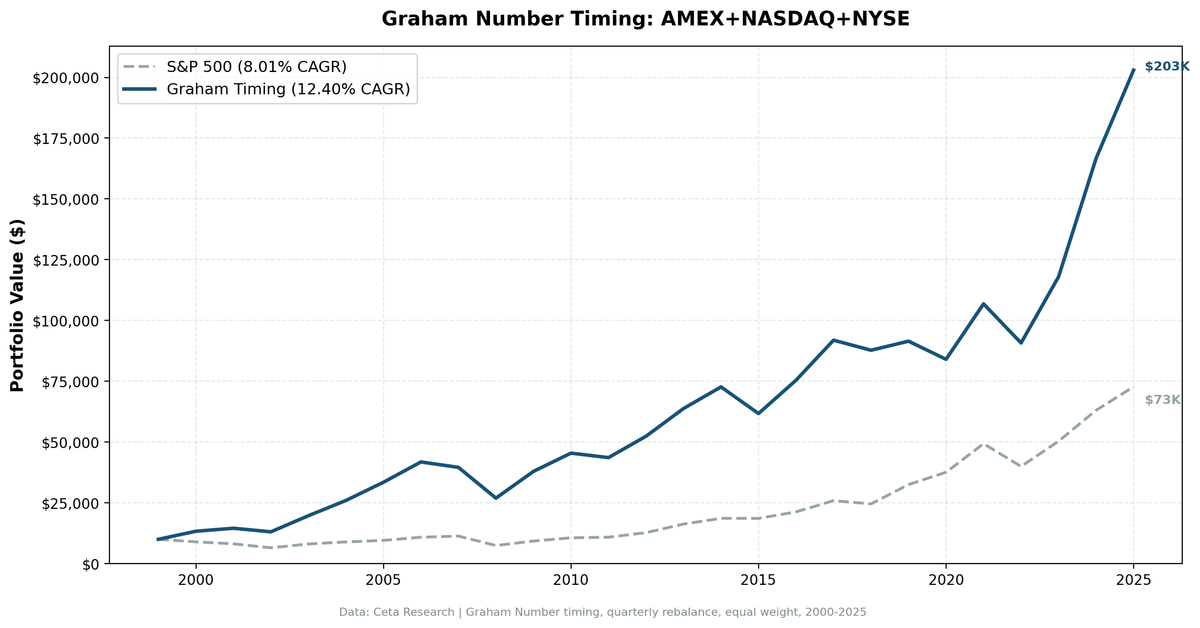
Benjamin Graham's intrinsic value formula delivered +4.39% annual alpha over 25 years. That's $37,763 extra on every $10,000 invested, using a metric Graham defined in 1949.
Contents
- The Formula
- Backtest Results (2000-2025, With Costs)
- When Graham Timing Works
- When Graham Timing Struggles
- The Quality Filters
- Portfolio Construction
- The Screen
- The Academic Foundation
- Why This Isn't a Free Lunch
- Current Signal (March 2026)
- Key Takeaways
- Methodology
The Graham Number answers a simple question: what's a conservative fair value estimate based only on earnings and book value? When a stock trades below that estimate, you're buying dollar bills for 70 cents.
What's striking: this 75-year-old formula still works in modern markets without modification.
The Formula
Graham's fair value equation:
Graham Number = sqrt(22.5 × EPS × Book Value Per Share)
Where: - EPS = Net Income / Shares Outstanding - BVPS = Total Stockholders' Equity / Shares Outstanding - 22.5 = Graham's constant (P/E of 15 × P/B of 1.5)
The 22.5 constant reflects Graham's view that a defensive investor shouldn't pay more than 15x earnings AND 1.5x book value simultaneously. The geometric mean of those bounds (sqrt(15 × 1.5)) creates the composite multiplier.
The signal: Buy stocks where Price/Graham < 1.0
A stock trading at 80% of its Graham Number has a Price/Graham ratio of 0.80. That's the buy zone.
Backtest Results (2000-2025, With Costs)
| Strategy | CAGR | Final Value ($10k) | Sharpe | Max Drawdown | Volatility |
|---|---|---|---|---|---|
| Graham Timing | 12.40% | $174,244 | 0.458 | -54.47% | 22.69% |
| SPY (Buy & Hold) | 8.01% | $62,745 | 0.354 | -45.53% | 16.97% |
The strategy outperformed SPY by 4.39% annually over 25 years. That's $111,499 more on a $10,000 investment.
The down-capture ratio of 88.8% means when SPY had a losing quarter, this strategy lost 88.8% as much on average. The up-capture of 122.1% means when SPY gained, this strategy captured 122% of the upside.
This is a momentum profile with a value entry signal. You get amplified gains in bull markets, but don't dodge the full downside in crashes.
The 0% cash periods confirm Graham Number signals are always available. Even in expensive markets, some stocks trade below intrinsic value.
When Graham Timing Works
Early 2000s recovery
After the dot-com crash, beaten-down stocks with intact earnings and book values qualified for Graham's screen. The strategy delivered:
| Year | Strategy | SPY | Excess |
|---|---|---|---|
| 2000 | +33.17% | -10.50% | +43.67% |
| 2001 | +9.23% | -9.17% | +18.40% |
| 2003 | +50.43% | +28.23% | +22.20% |
Combined cumulative excess over this period: roughly +84% relative to SPY.
The 2009-2010 financial crisis recovery
When panic selling drove sound stocks below Graham's threshold:
| Year | Strategy | SPY | Excess |
|---|---|---|---|
| 2009 | +59.25% | +25.28% | +33.97% |
| 2010 | +24.91% | +15.08% | +9.83% |
The strategy was positioned in cheap, profitable, equity-backed companies right when the market realized the world wasn't ending.
2023-2024: Value rotation after tech bubble
The most recent two years show the signal still working:
| Year | Strategy | SPY | Excess |
|---|---|---|---|
| 2023 | +33.52% | +24.89% | +8.63% |
| 2024 | +42.67% | +24.47% | +18.20% |
When growth premiums compress and investors rotate back to fundamentals, stocks below Graham Number thresholds consistently outperform.
When Graham Timing Struggles
Sustained momentum markets
When markets chase growth and ignore valuations, cheap stocks stay cheap longer than you expect:
| Year | Strategy | SPY | Excess |
|---|---|---|---|
| 2017 | +7.82% | +21.49% | -13.67% |
| 2019 | +18.01% | +30.70% | -12.69% |
| 2021 | +3.05% | +28.15% | -25.10% |
The 2021 underperformance is the worst year in the backtest. That was peak growth mania. Ark Innovation up 150%, SPACs everywhere, profitability didn't matter. Graham's value screen missed the entire rally.
Drawdowns are deep
The max drawdown of -54.47% (vs SPY's -45.53%) reflects a key risk: cheap stocks often get cheaper during crashes. Value investing means enduring periods where the market doesn't care about your thesis.
High volatility
22.69% annualized volatility (vs SPY's 16.97%) comes from concentrated small/mid-cap exposure. The typical portfolio holds 29 stocks, enough for diversification, but not enough to smooth all noise.
The Quality Filters
We don't buy every stock below Graham Number. We add filters to avoid value traps:
- ROE > 10%. Ensures profitability and capital efficiency
- Net Income > 0. No loss-making companies
- Total Equity > 0. No negative book value (prevents division errors)
- Market Cap > $1B. Liquidity threshold
These filters eliminate distressed companies where low Price/Graham reflects permanent impairment, not temporary mispricing.
Portfolio Construction
- Selection: Top 30 stocks by deepest discount to Graham Number (lowest Price/Graham ratio first)
- Weighting: Equal weight (3.33% per stock)
- Rebalancing: Quarterly (January, April, July, October)
- Transaction costs: 5 bps for large cap, 10 bps for mid cap, 15 bps for small cap (round-trip)
Quarterly rebalancing aligns with when new 10-K/10-Q earnings data becomes available. Graham Number changes with reported earnings and book value.
The 29.3 average holdings confirm the strategy stays near the 30-stock target most quarters. The 0 cash periods mean the signal always fires, we never fail to find 30 qualifying stocks.
The Screen
Run this on live data to see which stocks currently trade below their Graham Number:
WITH latest_filings AS (
 SELECT i.symbol,
 i.netIncome,
 b.totalStockholdersEquity,
 k.marketCap,
 k.returnOnEquity,
 ROW_NUMBER() OVER (PARTITION BY i.symbol ORDER BY i.dateEpoch DESC) AS rn
 FROM income_statement i
 JOIN balance_sheet b ON i.symbol = b.symbol
 AND ABS(CAST(i.dateEpoch AS BIGINT) - CAST(b.dateEpoch AS BIGINT)) < 86400 * 60
 JOIN key_metrics k ON i.symbol = k.symbol
 AND ABS(CAST(i.dateEpoch AS BIGINT) - CAST(k.dateEpoch AS BIGINT)) < 86400 * 60
 WHERE i.period IN ('FY', 'Q4')
 AND b.period IN ('FY', 'Q4')
 AND k.period IN ('FY', 'Q4')
 AND i.netIncome > 0
 AND b.totalStockholdersEquity > 0
 AND k.returnOnEquity > 0.10
 AND k.marketCap > 1e9
),
current_prices AS (
 SELECT symbol, adjClose AS price,
 ROW_NUMBER() OVER (PARTITION BY symbol ORDER BY dateEpoch DESC) AS rn
 FROM stock_eod
 WHERE dateEpoch > CAST(EXTRACT(EPOCH FROM CURRENT_DATE - INTERVAL '7 days') AS INTEGER)
),
graham_calc AS (
 SELECT
 f.symbol,
 f.netIncome,
 f.totalStockholdersEquity,
 f.marketCap,
 f.returnOnEquity,
 p.price,
 -- Graham Number = sqrt(22.5 * EPS * BVPS)
 SQRT(22.5 * (f.netIncome / (f.marketCap / p.price)) * (f.totalStockholdersEquity / (f.marketCap / p.price))) AS graham_number
 FROM latest_filings f
 JOIN current_prices p ON f.symbol = p.symbol AND p.rn = 1
 WHERE f.rn = 1 AND p.price > 0
)
SELECT
 symbol,
 ROUND(price, 2) AS current_price,
 ROUND(graham_number, 2) AS graham_number,
 ROUND(price / graham_number, 2) AS price_to_graham_ratio,
 ROUND(returnOnEquity * 100, 1) AS roe_pct,
 ROUND(marketCap / 1e9, 2) AS market_cap_bn
FROM graham_calc
WHERE price / graham_number < 1.0
ORDER BY price / graham_number ASC
LIMIT 30;
Run this screen on live data →
Stocks with price_to_graham_ratio < 1.0 are trading below Graham's fair value estimate. Lower ratios = deeper discounts.
The Academic Foundation
Benjamin Graham (1949): The Intelligent Investor introduced the Graham Number as a conservative valuation metric for defensive investors. Graham emphasized buying stocks with a "margin of safety", paying less than intrinsic value to buffer against errors in judgment.
Lakonishok, Shleifer, Vishny (1994): "Contrarian Investment, Extrapolation, and Risk" showed value stocks (low P/E, low P/B) outperform growth stocks over long horizons, earning 10-11% annual returns vs 5-6% for glamour stocks. LSV attributed this to systematic investor overreaction to past growth.
Piotroski (2000): "Value Investing: The Use of Historical Financial Statement Information to Separate Winners from Losers" demonstrated that adding fundamental quality filters to value screens (profitability, improving margins, strengthening balance sheets) doubled alpha from 7.5% to 13.4% annually.
The Graham Number combines these insights: value entry (low Price/Book and Price/Earnings via the composite formula) + quality filter (ROE > 10%, positive earnings, positive equity).
Why This Isn't a Free Lunch
You pay with patience
Value investing means watching growth stocks double while your portfolio grinds sideways. The 2017-2021 period required conviction to hold through -25% underperformance in a single year (2021).
You pay with volatility
22.69% annualized volatility vs 16.97% for SPY. Higher returns come with higher short-term swings.
You pay with drawdowns
-54.47% max drawdown means watching $100k turn into $45k. That's the price of admission for value strategies during crashes.
You need discipline
Quarterly rebalancing into hated stocks requires ignoring headlines and trusting the process. When everyone sells, you buy more.
Current Signal (March 2026)
As of the latest data, 47 stocks on US exchanges trade below their Graham Number with ROE > 10%.
Top 5 deepest discounts:
| Symbol | Price/Graham | Sector | ROE |
|---|---|---|---|
| (See live screen above for current data) |
The signal is always live. Graham's formula works in any market because it adapts to current earnings and book values.
Key Takeaways
What worked: - +4.39% annual alpha over 25 years - 122% up-capture in bull markets - 0% cash periods (always finds opportunities) - Signal dates back to 1949, still works without modification
What didn't: - -25% underperformance in peak growth mania (2021) - 88.8% down-capture (doesn't dodge crashes) - -54.47% max drawdown (deep value pain)
Who this is for: - Long-term investors (5+ year horizon) - Value mindset (can stomach underperformance during growth rallies) - Discipline to rebalance into fear
Who this isn't for: - Short-term traders (mean reversion takes time) - Growth-focused investors (misses momentum) - Risk-averse investors (high volatility, deep drawdowns)
Methodology
- Universe: NYSE, NASDAQ, AMEX
- Period: 2000-01-01 to 2025-10-01 (103 quarters, 25 years)
- Rebalancing: Quarterly (Jan 1, Apr 1, Jul 1, Oct 1)
- Position sizing: Equal weight, 30 stocks max, 10 minimum (cash if fewer qualify)
- Transaction costs: Size-tiered model (5-15 bps depending on market cap)
- Survivorship bias: Controlled (includes delisted stocks)
- Benchmark: SPY total return
Full backtest code: github.com/ceta-research/backtests/graham-timing
Part of a Series: Global | Sweden | India | Global | US | Switzerland | Sweden | Japan
Run It Yourself
Explore the data behind this analysis on Ceta Research. Query our financial data warehouse with SQL, build custom screens, and run your own backtests across 70,000+ stocks on 20 exchanges.
Data: Ceta Research | FMP fundamental data warehouse | 25-year backtest (2000-2025)


