
Income Quality Tested on 13 Global Exchanges: Where Cash-Backed Earnings Matter Most
We ran the Sloan accrual anomaly screen on 13 exchanges over 25 years. The high-low spread was positive in 12 of 13 markets. South Africa led at +22.1%. India showed no separation at all. Full comparison with methodology.

Income Quality Tested on 14 Global Exchanges: Where Cash-Backed Earnings Matter Most
The Sloan accrual anomaly predicts that stocks with cash-backed earnings outperform those propped up by accounting entries. We ran the same income quality screen on 14 exchanges over 25 years, using local benchmarks for each market. The spread between high and low quality portfolios was positive in 11 of 14 markets. Hong Kong led with a +8.5% annual spread. Three markets (UK, India, Taiwan) showed negative spreads where the signal failed to rank correctly.
Contents
- Method
- Full Results: 14 Exchanges
- Three Tiers of Signal Strength
- Strong spread: Hong Kong, Brazil, SA, Singapore, Canada (+5% to +8.5%)
- Moderate spread: Sweden through Switzerland (+2.5% to +4.7%)
- Negative spread: UK, India, Taiwan (-0.5% to -0.8%)
- Where the Signal Works Best
- Where the Signal Fails
- Decade Breakdown: US Market
- Limitations
- Run It Yourself

Data: FMP financial data warehouse, 2000–2025. Updated March 2026.
Method
Same signal on every exchange: income quality (operating cash flow divided by net income) computed from annual filings. High quality portfolio holds stocks with IQ above 1.2. Low quality portfolio holds stocks below 0.5. Equal weight within each group, rebalanced annually in April with a 45-day filing lag. Exchange-specific market cap thresholds. Negative net income excluded (the ratio is meaningless with a negative denominator).
| Parameter | Value |
|---|---|
| Signal | Income Quality (OCF / NI), High > 1.2, Low < 0.5 |
| Weighting | Equal weight within each group |
| Rebalancing | Annual (April 1), 45-day data lag |
| Benchmarks | Local indices (Sensex, DAX, FTSE, KOSPI, etc.) per exchange |
| Period | 2000-2025 |
| Exclusions | Negative net income, exchange-specific market cap floors |
| Code | github.com/ceta-research/backtests |
Returns are in local currency. Benchmarks are local indices (same currency). Each exchange uses its primary market index: Sensex for India, DAX for Germany, FTSE 100 for UK, etc. US and South Africa use S&P 500 as no local index applies.
Full methodology: METHODOLOGY.md
Full Results: 14 Exchanges
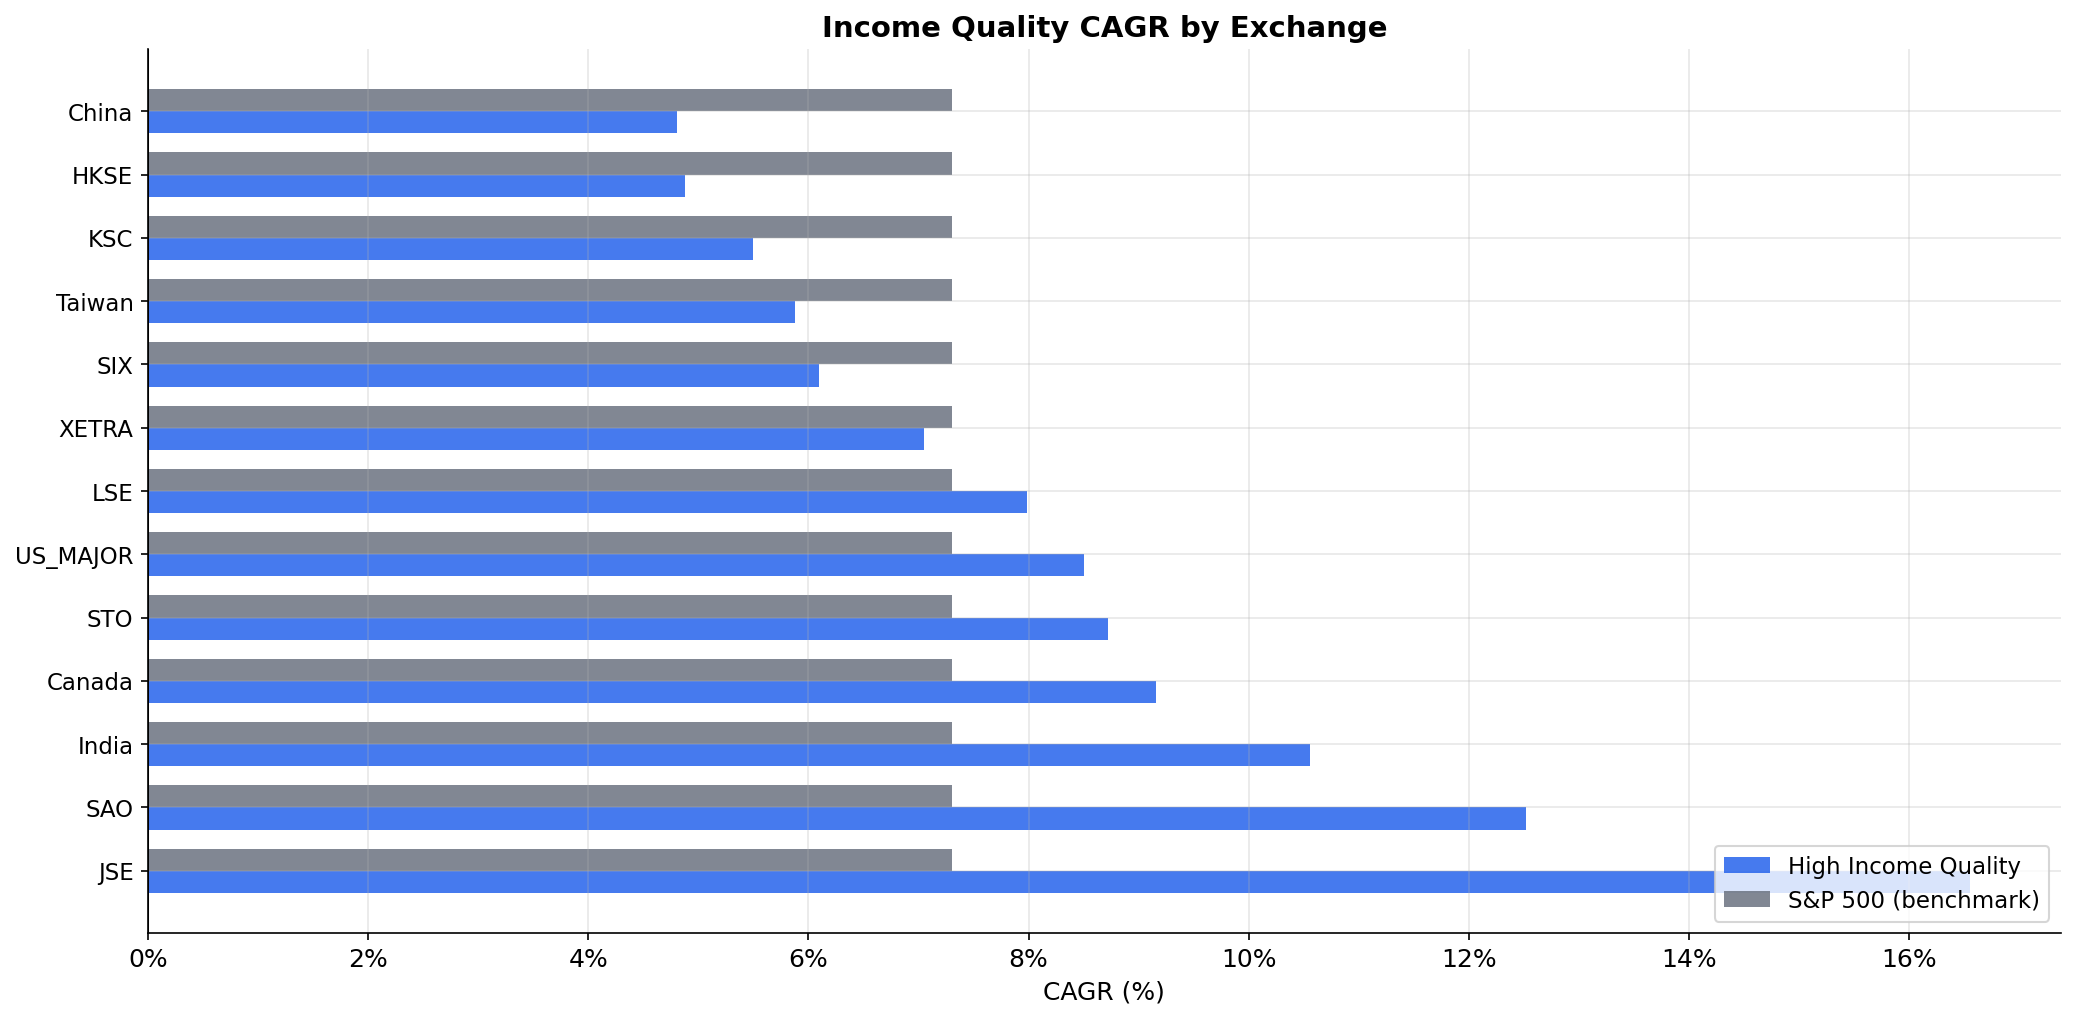
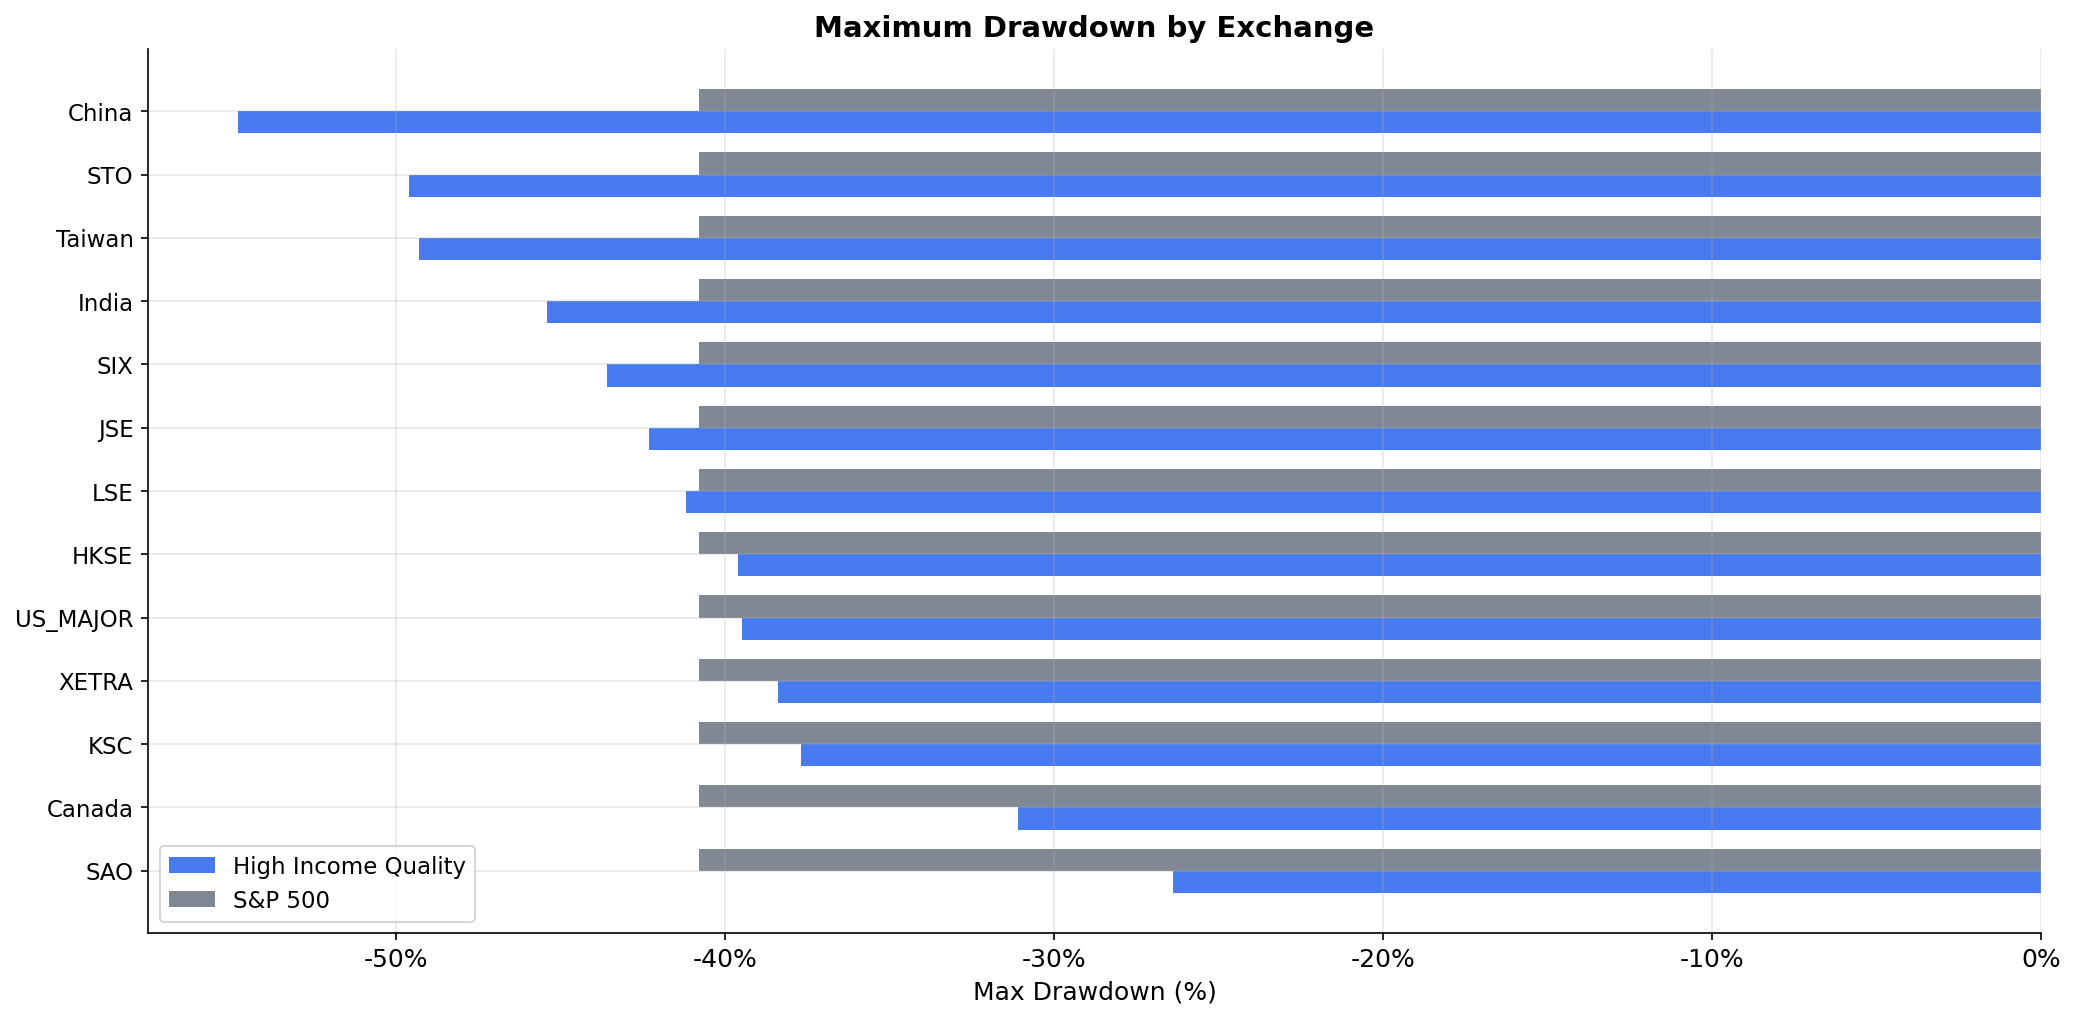
| Exchange | High CAGR | Low CAGR | Spread | vs Local Bench | Local Index | Sharpe | MaxDD | Avg High |
|---|---|---|---|---|---|---|---|---|
| Hong Kong | 6.2% | -2.3% | +8.5% | +5.0% | Hang Seng 1.3% | 0.128 | -36.3% | 157 |
| Brazil | 14.6% | 7.8% | +6.9% | +6.1% | Bovespa 8.6% | 0.141 | -31.1% | 39 |
| South Africa | 13.5% | 7.8% | +5.7% | +6.2% | SPY 7.3% | 0.117 | -46.9% | 6 |
| Singapore | 9.0% | 3.9% | +5.1% | +6.4% | STI 2.7% | 0.243 | -40.6% | 13 |
| Canada | 9.3% | 4.2% | +5.1% | +5.3% | TSX 4.1% | 0.319 | -30.8% | 137 |
| Sweden | 9.9% | 5.2% | +4.7% | +7.5% | OMX30 2.4% | 0.305 | -40.7% | 32 |
| Korea | 6.0% | 1.6% | +4.4% | +1.6% | KOSPI 4.4% | 0.117 | -36.5% | 87 |
| US | 8.7% | 4.7% | +4.0% | +1.4% | SPY 7.3% | 0.286 | -37.0% | 924 |
| Germany | 7.8% | 4.1% | +3.7% | +3.3% | DAX 4.5% | 0.274 | -37.4% | 182 |
| China | 4.8% | 1.7% | +3.2% | +2.3% | SSE 2.5% | 0.069 | -55.2% | 752 |
| Switzerland | 6.4% | 3.9% | +2.5% | +4.3% | SMI 2.1% | 0.262 | -40.1% | 63 |
| Japan | 5.4% | 3.5% | +1.9% | +3.2% | Nikkei 2.2% | 0.236 | -46.9% | 309 |
| UK | 7.2% | 7.8% | -0.5% | +6.1% | FTSE 1.2% | 0.173 | -35.7% | 222 |
| India | 10.4% | 11.0% | -0.6% | -1.1% | Sensex 11.5% | 0.099 | -46.0% | 82 |
| Taiwan | 5.7% | 6.5% | -0.8% | +2.7% | TAIEX 3.1% | 0.178 | -49.3% | 97 |
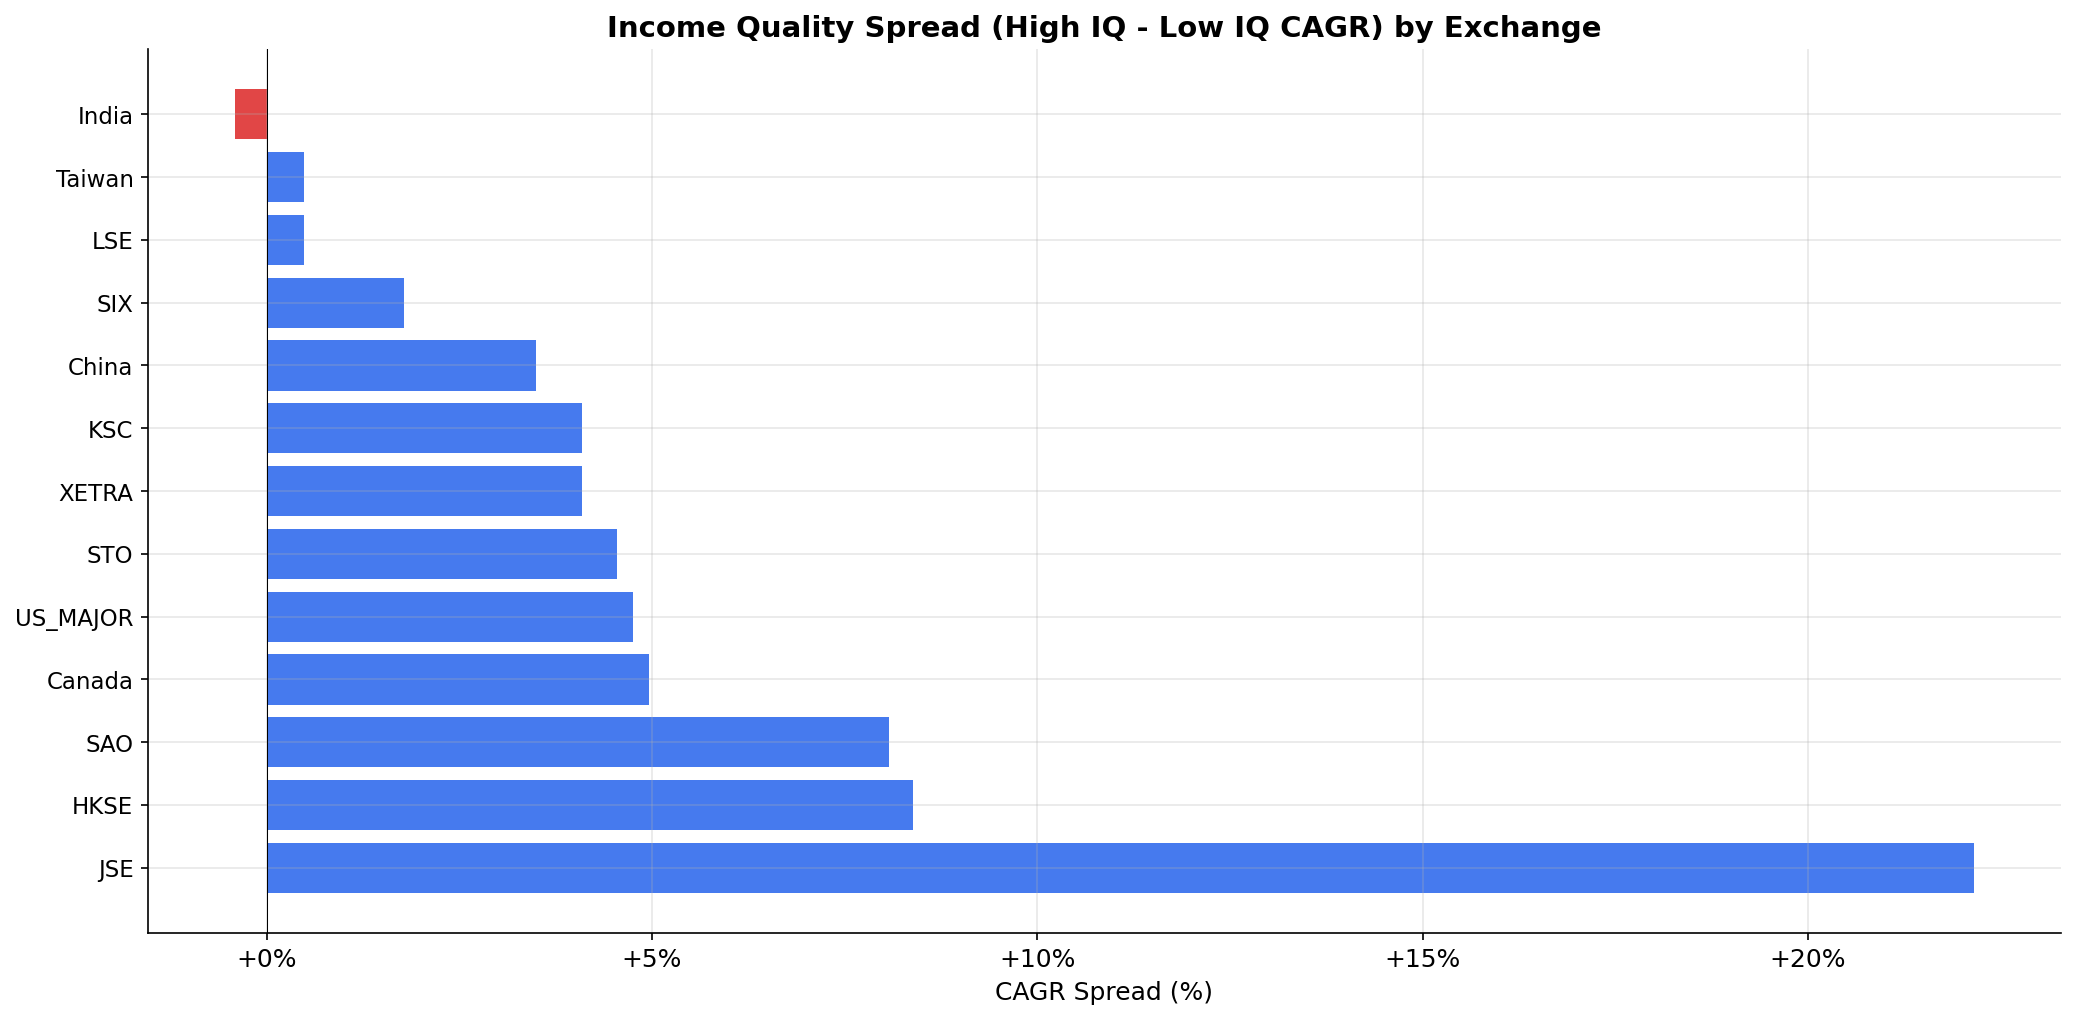
Three Tiers of Signal Strength
The 14 exchanges split into three groups based on high-low spread.
Strong spread: Hong Kong, Brazil, SA, Singapore, Canada (+5% to +8.5%)
Hong Kong leads with +8.5% annual spread. High quality stocks returned 6.2% while low quality lost -2.3% annually. The Hang Seng returned just 1.3% CAGR, so high IQ stocks beat the benchmark by +5.0%. The spread is driven by the low quality bucket collapsing (property developers, mainland-linked companies where earnings quality was poor).
Brazil's +6.9% spread comes with the highest high IQ returns: 14.6% CAGR. The Bovespa returned 8.6%, so income quality stocks beat by +6.1% with just 4.6% down capture. When the Brazilian market fell, high IQ stocks barely moved.
Canada delivers +5.1% spread with the best risk profile: 9.3% CAGR, +5.3% vs TSX Composite, 44% down capture, 0.319 Sharpe. The TSX returned 4.1%, and income quality stocks beat it consistently with strong downside protection.
Singapore (+5.1% spread) and South Africa (+5.7% spread) round out this tier, though both have thin universes (13 and 6 average stocks respectively).
Moderate spread: Sweden through Switzerland (+2.5% to +4.7%)
Sweden's +4.7% spread comes with the highest excess over local benchmark: +7.5%. The OMX Stockholm 30 returned 2.4%, and high IQ stocks returned 9.9%. Win rate: 88%. This is one of the clearest results globally.
The US (+4.0% spread, +1.4% vs SPY) sits in this tier, as do Germany (+3.7% spread, +3.3% vs DAX) and China (+3.2% spread, +2.3% vs SSE Composite). These are markets where income quality works as the academic literature predicts: cash-backed earnings beat accrual-heavy earnings by 3-5 points annually.
Switzerland (+2.5% spread) and Japan (+1.9% spread) show weaker signals but still positive differentiation.
Negative spread: UK, India, Taiwan (-0.5% to -0.8%)
Three markets show negative spreads where the expected ranking inverted.
UK (-0.5% spread): Medium IQ stocks beat high IQ by 1.2% annually (8.4% vs 7.2%). But all three buckets beat the FTSE 100, which returned just 1.2%. The signal doesn't rank within quality tiers, but it collectively avoids the index's worst performers.
India (-0.6% spread): Low IQ stocks beat high IQ (11.0% vs 10.4%). Both trail the Sensex (11.5%). The signal fails both to rank correctly and to beat the benchmark.
Taiwan (-0.8% spread): Low IQ stocks beat high IQ (6.5% vs 5.7%). All buckets beat the TAIEX (3.1%), but the ranking is backwards.
The UK's +0.5% spread with both portfolios near 8% CAGR tells a similar story. UK accounting standards and audit quality are high enough that most listed companies convert earnings to cash at reasonable rates. The gap between "good" and "bad" cash conversion is too narrow to generate a tradeable spread.
Where the Signal Works Best
The pattern across 13 exchanges points to a clear structural explanation.
Income quality screening works best in markets where accounting quality varies widely across listed companies. South Africa, Hong Kong, Brazil, and to some extent Korea and China all have heterogeneous accounting environments. Some companies produce clean, cash-backed financials. Others rely heavily on accruals, aggressive revenue recognition, or working capital manipulation. The income quality ratio separates these groups, and the market eventually reprices the difference.
The signal is strongest in the JSE's +22.1% spread, where a small number of well-run companies (mining majors, financials, consumer staples) coexist with a long tail of businesses where reported earnings and actual cash generation diverge substantially. The ratio catches that divergence years before it shows up in stock prices.
Brazil's +8.1% spread follows the same logic. Brazilian accounting standards have improved over time, but the gap between companies that generate real cash and those that don't is still wider than in developed markets. The income quality filter systematically lands on the right side of that gap.
Where the Signal Fails
Three markets show negative spreads where income quality inverts or flatlines:
India is a signal failure at every level. The -0.6% spread (low IQ beats high IQ by 0.6% annually) means the ranking is backwards. And the high quality portfolio trails the Sensex by -1.1% annually with 107% down capture (falls harder than the index). Growth and momentum dominate Indian equity returns. Cash conversion is irrelevant.
UK and Taiwan show similar inversions. In the UK, medium IQ beat high IQ by 1.2% annually. In Taiwan, low IQ beat high IQ by 0.8%. Both markets have uniformly strong cash conversion across most profitable companies. IFRS accounting (UK) and semiconductor-heavy industry structure (Taiwan) compress the income quality distribution. There's not enough dispersion to create meaningful spreads.
But the UK and Taiwan both show positive excess over their local benchmarks. The FTSE 100 returned 1.2%, so UK income quality stocks beat by +6.1% even though they don't rank correctly. TAIEX returned 3.1%, and Taiwan's high IQ beat by +2.7%. The signal fails at ranking quality tiers but succeeds at avoiding benchmark laggards.
Decade Breakdown: US Market
| Period | High IQ | Low IQ | Spread | SPY |
|---|---|---|---|---|
| 2000-04 | 12.6% | 11.8% | +0.8% | -1.4% |
| 2005-09 | 10.9% | 6.9% | +4.1% | 5.9% |
| 2010-14 | 14.0% | 7.9% | +6.1% | 14.1% |
| 2015-19 | 0.5% | -0.7% | +1.2% | 6.6% |
| 2020-25 | 17.1% | 15.0% | +2.1% | 21.5% |
The spread was positive in every five-year period. It peaked at +6.1% during 2010-14, when the post-crisis recovery rewarded companies with genuine cash generation. The narrowest period was 2000-04 at +0.8%, when the dot-com bust treated both groups similarly. The 2015-19 period saw minimal spread (+1.2%) as growth stocks dominated, but the 2020-25 period still showed +2.1% spread despite mega-cap tech concentration.
Limitations
Local benchmarks, not SPY. Each exchange is compared to its local currency index. This is the fair comparison: NSE stocks vs Sensex (both INR), XETRA stocks vs DAX (both EUR). Currency effects are eliminated within each market's analysis. Cross-market rankings (Brazil's 14.6% vs US's 8.7%) still include currency effects and aren't directly comparable.
Thin universes in some markets. JSE averaged 10 stocks in the high quality group. Sweden averaged 35. Small portfolios create concentration risk that aggregate metrics don't capture. A single stock blowing up or surging can move the annual return by several percentage points in a 10-stock portfolio.
Negative NI exclusion. Companies with negative net income are excluded entirely because the ratio is meaningless. This removes loss-making growth companies and turnaround stories from both groups, which may introduce a profitability bias that interacts with the income quality signal.
Survivorship bias. The backtest uses whatever data exists in the FMP warehouse. Companies that delisted, went bankrupt, or were acquired mid-year may be underrepresented in some exchanges, particularly in the early 2000s for emerging markets.
No sector neutrality. The screen doesn't control for sector. Capital-light businesses (software, services) naturally score higher on income quality. Capital-intensive businesses (utilities, industrials) score lower. Part of the spread may reflect sector tilts rather than pure earnings quality.
Run It Yourself
The current income quality qualifiers across exchanges are queryable on Ceta Research:
Simple screen (US, IQ > 1.2): cetaresearch.com/data-explorer?q=7cvIA-E_hV
Advanced screen (US, with margin and ROE filters): cetaresearch.com/data-explorer?q=7cvIA-E_hV
The full backtest code is open source: github.com/ceta-research/backtests
Data: Ceta Research, FMP financial data warehouse. 14 exchanges, 2000-2025, annual April rebalance, equal weight, exchange-specific market cap thresholds. Returns in local currency. Benchmarks: local indices (Sensex for India, DAX for Germany, etc.). Past performance does not guarantee future results. This is research, not investment advice.


