
Income Quality on US Stocks: The Cash Flow Ratio That Still Works After 30 Years
We tested the Sloan accrual anomaly on US stocks from 2000 to 2025. Companies generating 20%+ more cash than reported profit returned 8.5% annually vs 3.74% for accrual-heavy stocks. The 4.76% annual spread has survived 30 years of academic scrutiny.

Operating cash flow divided by net income. One ratio. Companies where cash exceeds reported profit returned 8.7% annually from 2000 to 2025. Companies where earnings were mostly accounting entries returned 4.7%. The 4.0% annual spread between high and low income quality has survived three decades of academic scrutiny, two financial crises, and a pandemic. Sloan documented it in 1996. The market still doesn't read the cash flow statement.
Contents
- Method
- What is Income Quality?
- The Screens
- Simple Screen
- Advanced Screen
- What We Found
- When It Works
- When It Struggles
- Run It Yourself
- Limitations
- References
Data: FMP financial data warehouse, 2000–2025. Updated March 2026.
Method
| Parameter | Value |
|---|---|
| Universe | NYSE, NASDAQ, AMEX, market cap > $1B |
| Signal | Income Quality = Operating Cash Flow / Net Income |
| Portfolios | High (IQ > 1.2), Medium (0.5-1.2), Low (IQ < 0.5) |
| Rebalancing | Annual (April 1) |
| Filing lag | 45 days (point-in-time) |
| Weighting | Equal weight within each group |
| Transaction costs | Size-tiered (0.1% large, 0.3% mid, 0.5% small) |
| Benchmark | S&P 500 (SPY) |
| Period | 2000-2025 (25 years) |
| Exclusions | Net income < 0 (ratio is meaningless) |
| Data source | FMP via Ceta Research warehouse |
What is Income Quality?
The formula: operating cash flow divided by net income.
A ratio above 1.0 means the company collects more cash from operations than it reports in profit. That's healthy. Depreciation, amortization, and other non-cash charges push net income below actual cash generation. A ratio of 1.3 means for every dollar of reported earnings, $1.30 showed up in the bank account.
A ratio below 1.0 means the company reports more profit than it collects in cash. The gap is accruals.
Accruals aren't automatically fraud. Revenue recognition timing creates them. So does capitalizing development costs instead of expensing them. A company ships product in December, books the revenue, but the customer pays in February. Net income goes up. Cash flow doesn't. Perfectly legal. Perfectly misleading if you only look at the income statement.
Richard Sloan published this observation in 1996. He split stocks into groups by accrual levels and found roughly a 10% annual spread. The market treats accrual-heavy earnings the same as cash-backed earnings. It shouldn't. Accruals reverse. Revenue pulled forward into Q4 means less revenue in Q1. Capitalized expenses eventually get written down. The earnings boost is temporary, but the stock price reacts as if it's permanent.
We tested three buckets:
- High IQ (> 1.2): Company generates 20%+ more cash than reported profit. Quality earnings.
- Medium IQ (0.5 to 1.2): Earnings roughly match cash. Neutral.
- Low IQ (< 0.5): Earnings not backed by cash. Accrual-heavy. Risk flag.
The Screens
Simple Screen
-- Income Quality: Simple US Screen
-- Run at: cetaresearch.com/data-explorer?q=7cvIA-E_hV

SELECT
    k.symbol,
    p.companyName,
    k.incomeQualityTTM,
    k.marketCap / 1e9 AS market_cap_b,
    p.sector
FROM key_metrics_ttm k
JOIN profile p ON k.symbol = p.symbol
WHERE k.incomeQualityTTM > 1.2
  AND k.marketCap > 1000000000
  AND p.exchange IN ('NYSE', 'NASDAQ', 'AMEX')
  AND p.isActivelyTrading = true
ORDER BY k.incomeQualityTTM DESC
LIMIT 50
incomeQualityTTM is pre-calculated in the Ceta Research warehouse. The 1.2 threshold targets companies generating at least 20% more cash than reported profit. The $1B market cap floor keeps results in tradeable territory.
Advanced Screen
-- Income Quality: Advanced US Screen
-- Run at: cetaresearch.com/data-explorer?q=qo6sh0NOoe

SELECT
    k.symbol,
    p.companyName,
    k.incomeQualityTTM,
    f.netProfitMarginTTM * 100 AS net_margin_pct,
    k.returnOnEquityTTM * 100 AS roe_pct,
    k.marketCap / 1e9 AS market_cap_b
FROM key_metrics_ttm k
JOIN financial_ratios_ttm f ON k.symbol = f.symbol
JOIN profile p ON k.symbol = p.symbol
WHERE k.incomeQualityTTM > 1.2
  AND f.netProfitMarginTTM > 0.05
  AND k.returnOnEquityTTM > 0.08
  AND k.marketCap > 1000000000
  AND p.exchange IN ('NYSE', 'NASDAQ', 'AMEX')
  AND p.isActivelyTrading = true
ORDER BY k.incomeQualityTTM DESC
LIMIT 30
Three extra filters. Net profit margin above 5% ensures we're looking at genuinely profitable companies, not marginal businesses where a small OCF surplus creates a misleadingly high ratio. ROE above 8% confirms the business earns a decent return on equity. These filters screen out the noise and leave companies that are both profitable and cash-generative.
What We Found
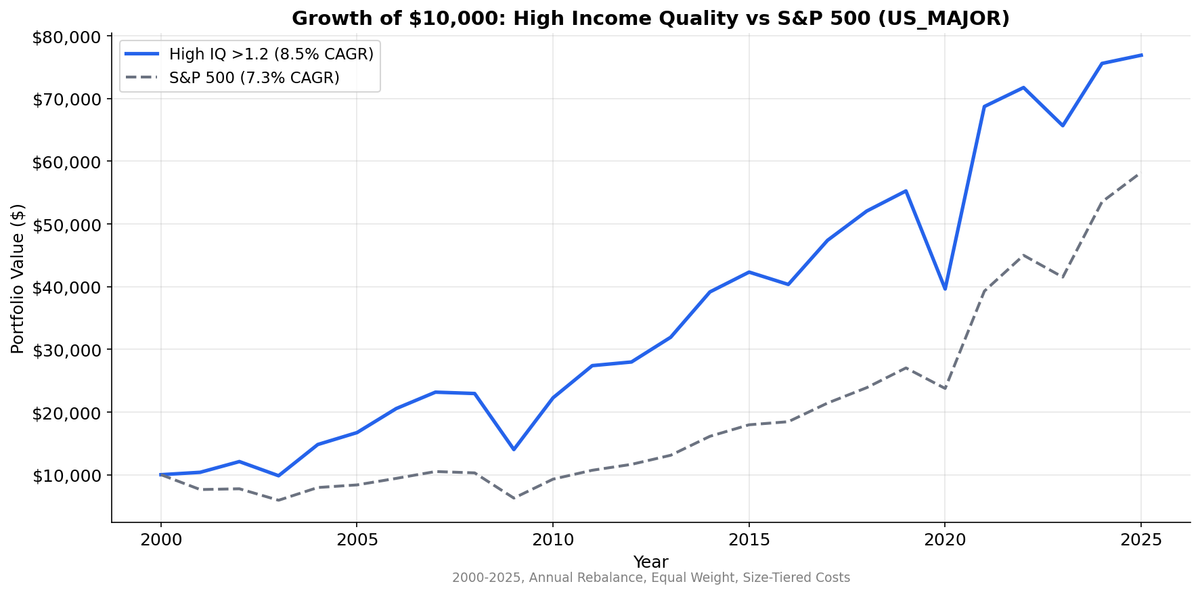
The high income quality portfolio beat the S&P 500 by 1.36% annually. That's a real edge, but the more compelling story is the spread between high and low quality: 4.0% per year, every year, for 25 years.
25-year summary (2000-2025):
| Metric | High IQ (>1.2) | Medium IQ (0.5-1.2) | Low IQ (<0.5) | S&P 500 (SPY) |
|---|---|---|---|---|
| CAGR | 8.69% | 7.88% | 4.70% | 7.33% |
| Total Return | 703.1% | 566.4% | 215.1% | 485.9% |
| Volatility | 23.40% | 24.04% | 28.04% | 21.07% |
| Sharpe Ratio | 0.286 | 0.245 | 0.096 | 0.253 |
| Sortino Ratio | 0.625 | — | — | — |
| Max Drawdown | -37.0% | -38.1% | -55.1% | -39.3% |
| Avg Stocks | 924 | 257 | 118 | — |
A few things stand out.
The pool is massive. High IQ stocks make up roughly 72% of the universe. This isn't a narrow anomaly that disappears once you try to trade it. Nearly 924 stocks pass the threshold at any given time. The signal works as a broad filter, not a concentrated bet.
Low quality gets destroyed. The low IQ portfolio returned 4.7% annually with 28% volatility and a -55.1% max drawdown. That's modestly above T-bills with equity-level risk. Companies reporting earnings that aren't backed by cash deliver exactly what you'd expect: temporary gains that reverse.
High quality has better downside. The -37.0% max drawdown beats both the medium portfolio (-38.1%) and SPY (-39.3%). Cash-backed earnings provide a cushion during market stress. When credit tightens and accounting gimmicks get exposed, high quality companies have actual cash to fall back on.
Capture ratios tell the real story. High IQ captured 107.3% of SPY's upside and only 82.6% of the downside. That asymmetry is the core of the strategy's value. It slightly amplifies gains while meaningfully dampening losses. The beta of 1.005 confirms this isn't just a higher-beta bet on the market.
The Sharpe is close to SPY's. High IQ's 0.286 Sharpe versus SPY's 0.253 is a modest improvement. The strategy won't look exceptional on a risk-adjusted basis in any single year. Its value is the compounding of that small edge: 8.69% vs 7.33% turns into 703.1% vs 485.9% over 25 years.
When It Works
The strategy's best periods coincide with market stress and recovery. When investors panic, the distinction between cash-backed earnings and accrual earnings gets tested. Cash wins.
| Period | High IQ | SPY | vs SPY | High-Low Spread |
|---|---|---|---|---|
| 2000-04 | 12.6% | -1.4% | +14.1% | +0.8% |
| 2005-09 | 10.9% | 5.9% | +5.0% | +4.1% |
The 2000-2004 standout. High IQ returned 12.6% annually while SPY lost -1.4% per year. After the dot-com crash, accrual-heavy tech companies that had inflated earnings with aggressive revenue recognition got punished. Cash-backed businesses held up. The strategy beat SPY by 14.1% per year during this stretch.
Best individual years:
| Year | High IQ | SPY | Spread |
|---|---|---|---|
| 2000 | +4.1% | -23.7% | +27.8% |
| 2003 | +47.7% | +32.1% | +15.6% |
| 2009 | +55.8% | +45.2% | +10.6% |
| 2020 | +72.0% | +64.0% | +8.0% |
The pattern is consistent: crash years and recovery years are when income quality earns its premium. Real cash flow matters most when the market is questioning everything.
When It Struggles
The strategy lags during sustained bull markets where valuations expand broadly and earnings quality takes a back seat to growth expectations.
| Period | High IQ | SPY | vs SPY | High-Low Spread |
|---|---|---|---|---|
| 2010-14 | 14.0% | 14.1% | -0.1% | +6.1% |
| 2015-19 | 0.5% | 6.6% | -6.1% | +1.2% |
| 2020-25 | 17.1% | 21.5% | -4.4% | +2.1% |
2015-2019 was the worst stretch. High IQ returned just 0.1% annually while SPY delivered 6.3%. The late-cycle bull market rewarded growth and momentum regardless of earnings quality. Low interest rates reduced the penalty for accrual-heavy companies because cheap capital kept papering over cash flow gaps.
Worst individual years:
| Year | High IQ | SPY | Spread |
|---|---|---|---|
| 2019 | -27.0% | -10.1% | -16.9% |
| 2014 | +8.3% | +11.4% | -3.2% |
| 2023 | +14.3% | +28.1% | -13.8% |
| 2024 | +3.8% | +10.2% | -6.4% |
2019 stands out. The strategy lost -27.0% against SPY's -10.1%. In broad market selloffs driven by macro factors (2019 had trade war fears and rate uncertainty), income quality doesn't protect you from sentiment-driven selling. Every stock falls.
2023-2024 underperformance. The strategy trailed SPY by 13.8% in 2023 and 6.4% in 2024. The AI and mega-cap tech rally concentrated returns in a narrow set of stocks. An equal-weighted portfolio of ~924 stocks can't keep pace when seven names drive most of the index return. That's not a flaw in the signal. It's a structural mismatch between equal-weight broad strategies and cap-weighted benchmarks during concentration regimes.
The win rate against SPY: 64.0%. Better than even odds. In most years, income quality beats the benchmark.
Run It Yourself
The full backtest code is open source:
github.com/ceta-research/backtests/tree/main/income-quality
# Run the US backtest
python3 income-quality/backtest.py --preset us --verbose

# Current screen
python3 income-quality/screen.py --preset us
The live screens run on Ceta Research:
- Simple: cetaresearch.com/data-explorer?q=7cvIA-E_hV
- Advanced: cetaresearch.com/data-explorer?q=qo6sh0NOoe
Limitations
The ratio breaks with negative net income. When NI is negative, OCF/NI produces a meaningless number. A company with $50M OCF and -$10M NI gets a ratio of -5.0. That's not "low quality." We exclude all negative-NI companies entirely.
Extreme ratios at the edges. A company earning $1M in net income with $50M in OCF gets a ratio of 50x. That's not 50x better than a company at 1.2x. The signal is noisy at the extremes.
One-time items distort OCF. Restructuring payments, lawsuit settlements, and large tax refunds all flow through operating cash flow. A company paying a $500M legal settlement has depressed OCF that has nothing to do with ongoing earnings quality. The distortion clears in a year, but it can cause false signals at the annual rebalance.
Equal weighting across ~947 stocks. The high IQ pool is large. Trading that many names annually creates turnover costs. The size-tiered cost model accounts for this, but real-world implementation at this breadth is impractical for most investors. A concentrated version (top 30 or top 50 by IQ) would be more tradeable but hasn't been tested here.
The high-low spread is more reliable than alpha vs SPY. The 4.76% spread between high and low quality has been positive in every five-year window. The 1.20% alpha over SPY has not. If you're using income quality as a standalone strategy, the edge is narrow. Its real value is as a quality filter layered on top of other signals.
References
- Sloan, R. (1996). "Do Stock Prices Fully Reflect Information in Accruals and Cash Flows About Future Earnings?" The Accounting Review, 71(3), 289-315.
- Richardson, S., Sloan, R., Soliman, M., & Tuna, I. (2005). "Accrual Reliability, Earnings Persistence and Stock Prices." Journal of Accounting and Economics, 39(3), 437-485.
- Dechow, P. & Dichev, I. (2002). "The Quality of Accruals and Earnings: The Role of Accrual Estimation Errors." The Accounting Review, 77(s-1), 35-59.
Data: Ceta Research, FMP financial data. Backtest: 2000-2025, annual rebalance, equal weight, all US stocks above $1B market cap. Full methodology at github.com/ceta-research/backtests.


