Low Volatility Quality on Taiwan Stocks: +2.3% vs TAIEX Over 25 Years
We backtested low-vol quality on the Taiwan Stock Exchange (TAI) from 2000 to 2025. It returned 6.68% CAGR with a 0.424 Sharpe, beating the TAIEX by +2.30% annually. Down capture 29% and beta 0.314 in a market dominated by TSMC and semiconductors. The boring-stock premium beats the local index.

Taiwan's stock market is dominated by semiconductors. TSMC alone accounts for a massive share of total market cap, and hundreds of listed companies sit in its supply chain: foundries, packaging, testing, equipment, materials. This is a high-beta, export-driven market that moves with the global tech cycle.
Contents
- Method
- The Screen
- Results
- Cash Periods
- When It Works
- When It Struggles
- Why Taiwan's Low-Vol Profile Is Unusual
- Limitations
- Part of a Series
- Run It Yourself
- Takeaway
- References
That makes it an interesting test for low-volatility quality. If the strategy works here, it's doing something genuinely useful: finding the non-cyclical corner of a cyclical market. Over 25 years, the screen returned 6.68% CAGR with a 0.424 Sharpe ratio, beating the TAIEX by +2.30% annually. It captured only 29% of market downside while participating in 53% of upside. The portfolio went to cash in 20% of periods, reflecting how few Taiwanese stocks pass both quality and low-vol filters simultaneously.
Data: FMP financial data warehouse, 2000–2025. Updated March 2026.
Method
Data source: Ceta Research (FMP financial data warehouse, 70K+ global stocks) Universe: All stocks on the Taiwan Stock Exchange (TAI) with market cap > NT$10B (~$312M USD) Period: January 2000 to March 2025 (25.8 years, 103 quarterly periods) Rebalancing: Quarterly (January, April, July, October) Benchmark: Taiwan Stock Exchange Capitalization Weighted Stock Index (TAIEX) Execution: Next-day close (MOC) Cash rule: Portfolio holds cash if fewer than 10 stocks qualify Transaction costs: Size-tiered model (0.1% for large caps, 0.3% for mid caps, 0.5% for small caps) Data quality guards: 45-day lag on annual filings, minimum 200 trading days for vol computation, max single return capped at 200%, penny stocks excluded
Signal filters:
| Filter | Threshold | Source |
|---|---|---|
| Return on equity | > 10% | key_metrics FY |
| Operating profit margin | > 10% | financial_ratios FY |
| Market cap | > NT$10B (~$312M USD) | key_metrics FY |
| 252-day realized volatility | Rank ASC, top 30 | stock_eod daily returns |
| Minimum trading days | >= 200 in 14-month window | stock_eod |
The Screen
SELECT
  k.symbol,
  p.companyName,
  ROUND(k.returnOnEquityTTM * 100, 2) AS roe_pct,
  ROUND(f.operatingProfitMarginTTM * 100, 2) AS opm_pct,
  ROUND(k.marketCap / 1e9, 2) AS mktcap_b
FROM key_metrics_ttm k
JOIN financial_ratios_ttm f ON k.symbol = f.symbol
JOIN profile p ON k.symbol = p.symbol
WHERE k.returnOnEquityTTM > 0.10
  AND f.operatingProfitMarginTTM > 0.10
  AND k.marketCap > 312000000
  AND p.exchange = 'TAI'
ORDER BY k.marketCap DESC
LIMIT 30
This produces the quality universe. The full strategy then ranks these candidates by trailing 252-day realized volatility (computed from daily returns) and selects the 30 lowest-volatility names.
Try the quality screen on Ceta Research
Results
| Metric | Low Vol + Quality | TAIEX |
|---|---|---|
| CAGR | 6.68% | 4.38% |
| Total Return | 428.11% | 201.24% |
| Max Drawdown | -42.63% | -65.25% |
| Annualized Volatility | 13.40% | 24.48% |
| Sharpe Ratio | 0.424 | 0.138 |
| Sortino Ratio | 0.699 | 0.215 |
| Calmar Ratio | 0.157 | 0.067 |
| VaR (95%) | -10.64% | -19.34% |
| Beta | 0.314 | 1.0 |
| Alpha | 4.62% | -- |
| Up Capture | 53.44% | -- |
| Down Capture | 29.11% | -- |
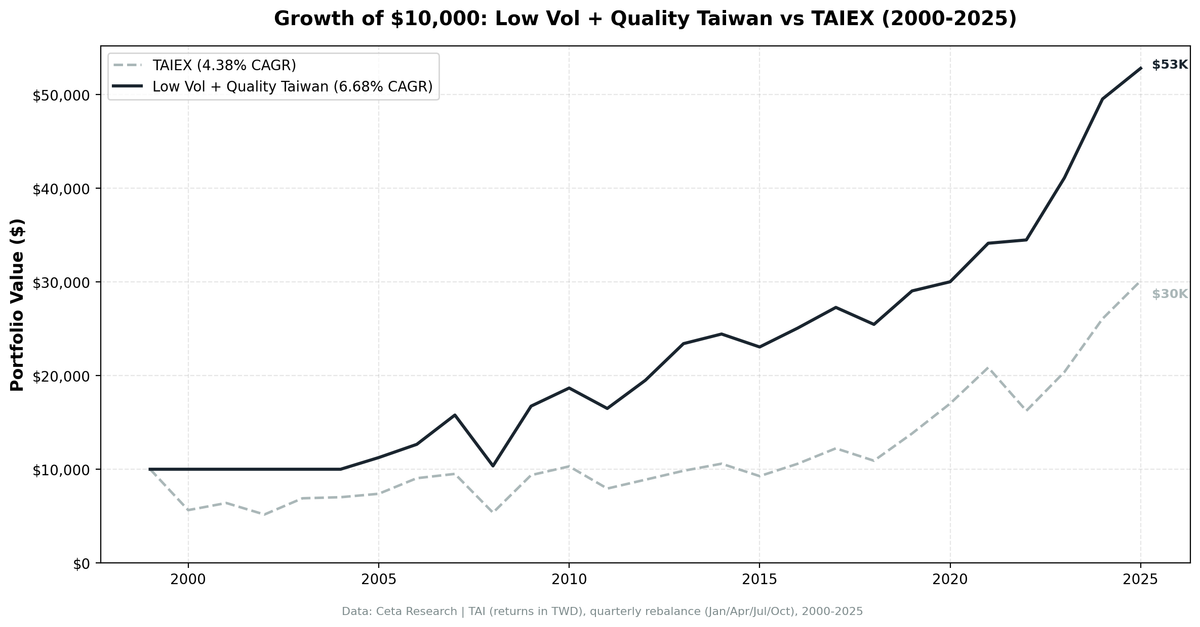
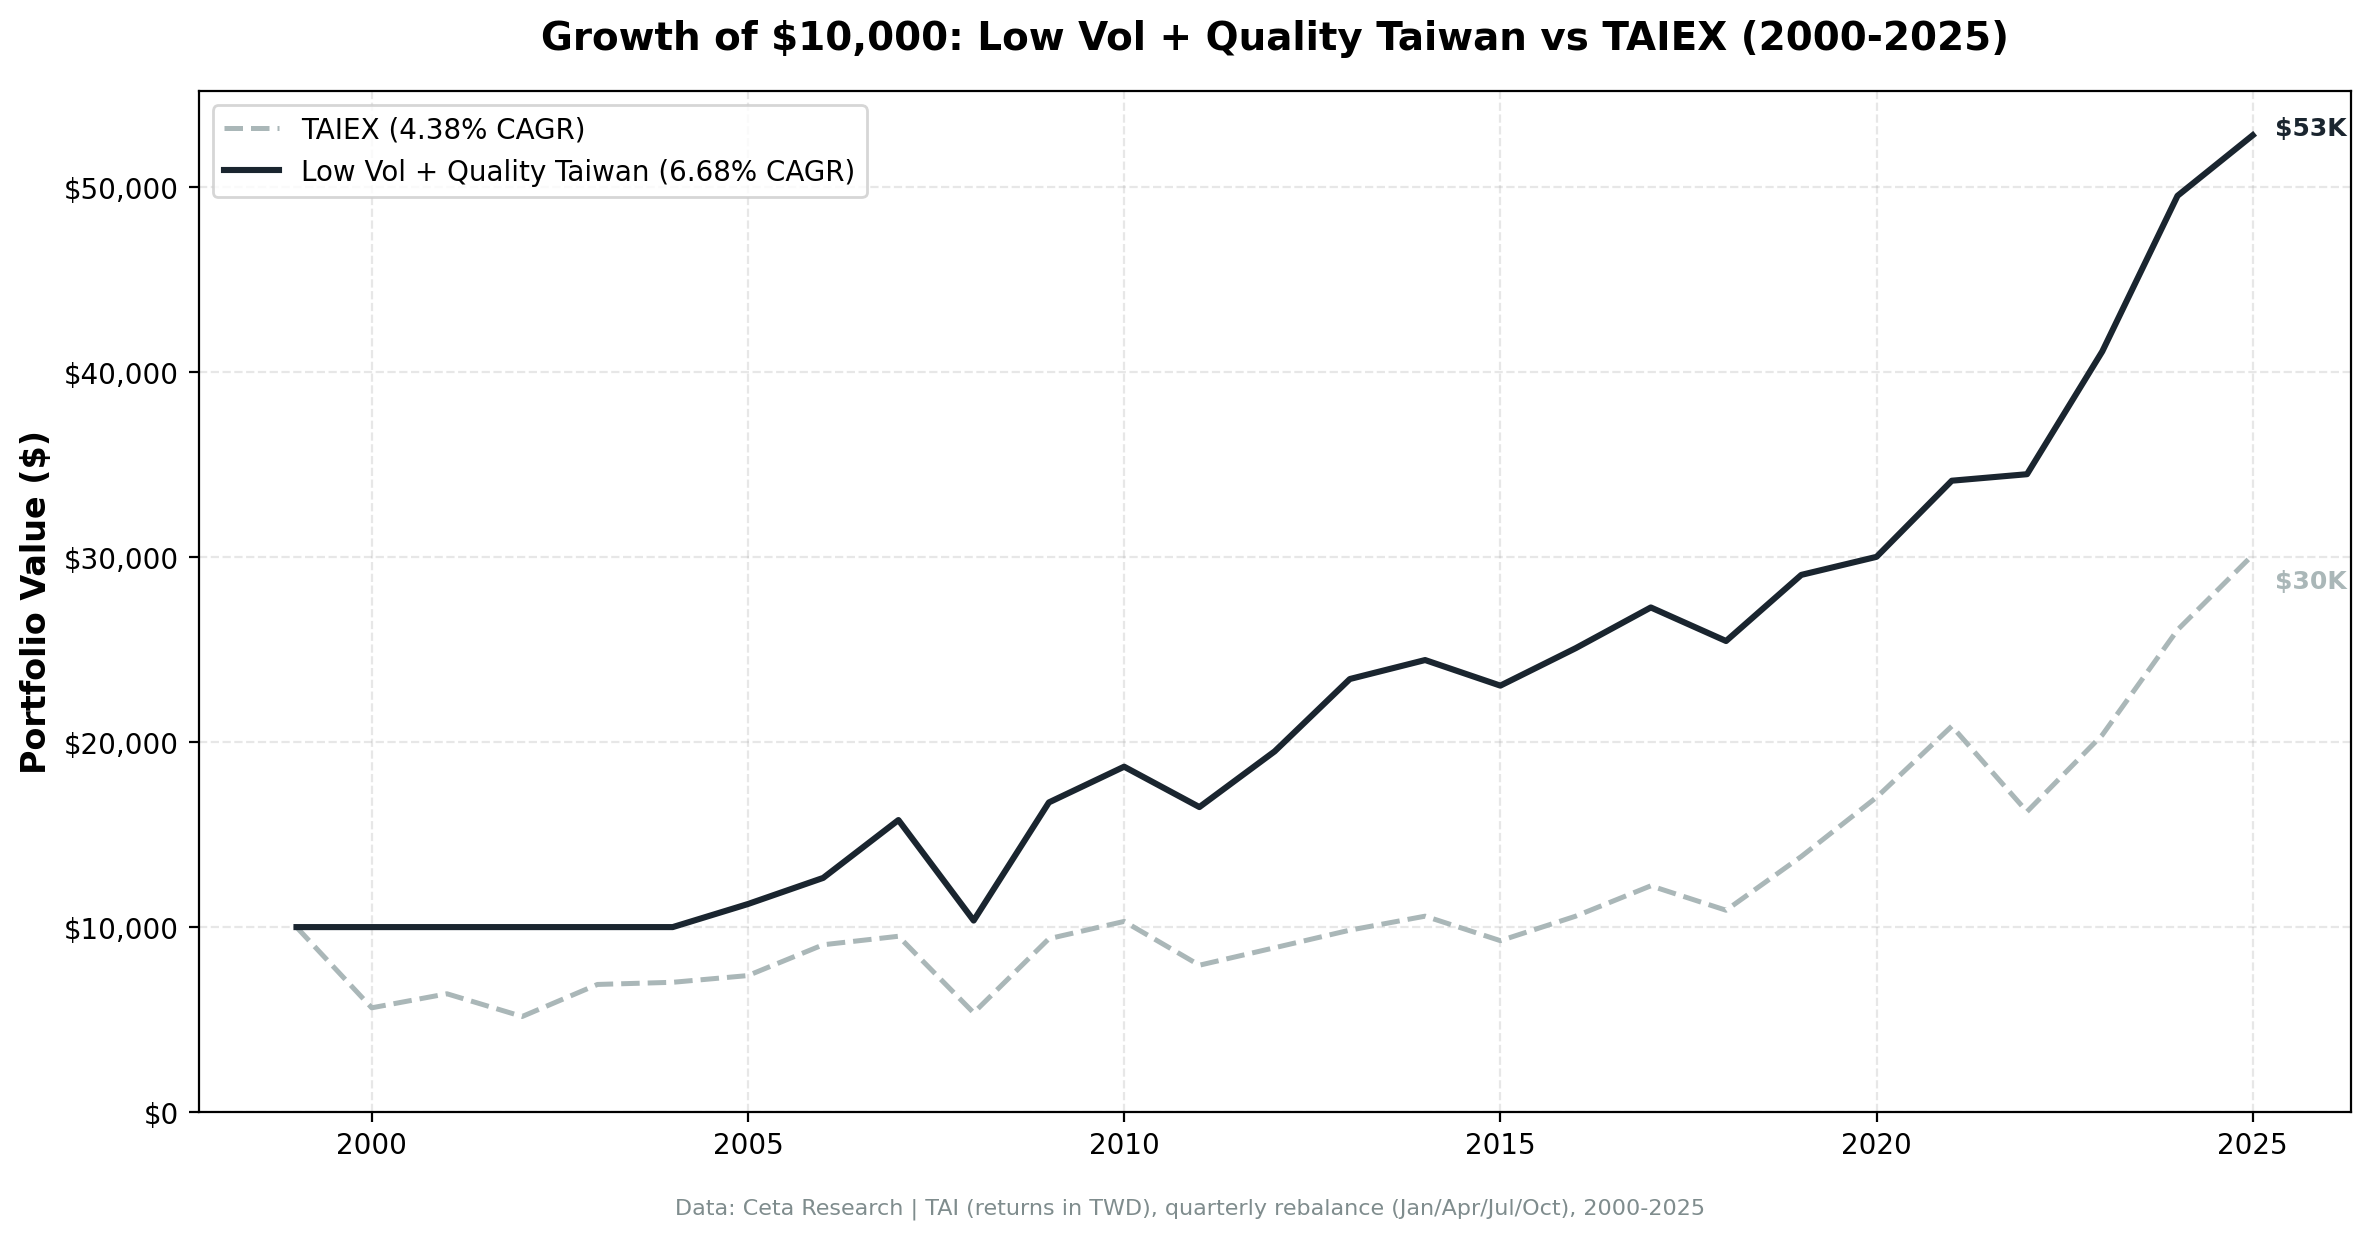
$10,000 invested in 2000 grew to $52,811 in the low-vol quality portfolio vs $30,124 in the TAIEX.
The Sharpe ratio tells the story. At 0.424, Taiwan's low-vol quality screen massively outperforms the TAIEX's 0.138. The Sortino ratio is even more striking: 0.699 vs 0.215, meaning the portfolio's downside volatility is proportionally much lower than its total volatility. It captures 53% of market upside but only 29% of downside. That asymmetry, persistent across 25 years, is the core value proposition.
The beta of 0.314 is notable in a market known for high-beta semiconductor stocks. The strategy effectively builds a portfolio that behaves like one-third the market's risk but keeps most of the quality exposure.
Cash Periods
The portfolio went to cash in 21 of 103 quarters (20%). Taiwan's market is smaller than the US, Japan, or India. When tech cycles drive volatility up across most listed companies, there simply aren't 10 stocks that pass both quality and low-vol filters. This isn't a flaw. The strategy is doing what it should: refusing to own stocks when the low-vol universe is too thin.
Average stocks held when invested: 28.3 out of a maximum 30.
When It Works
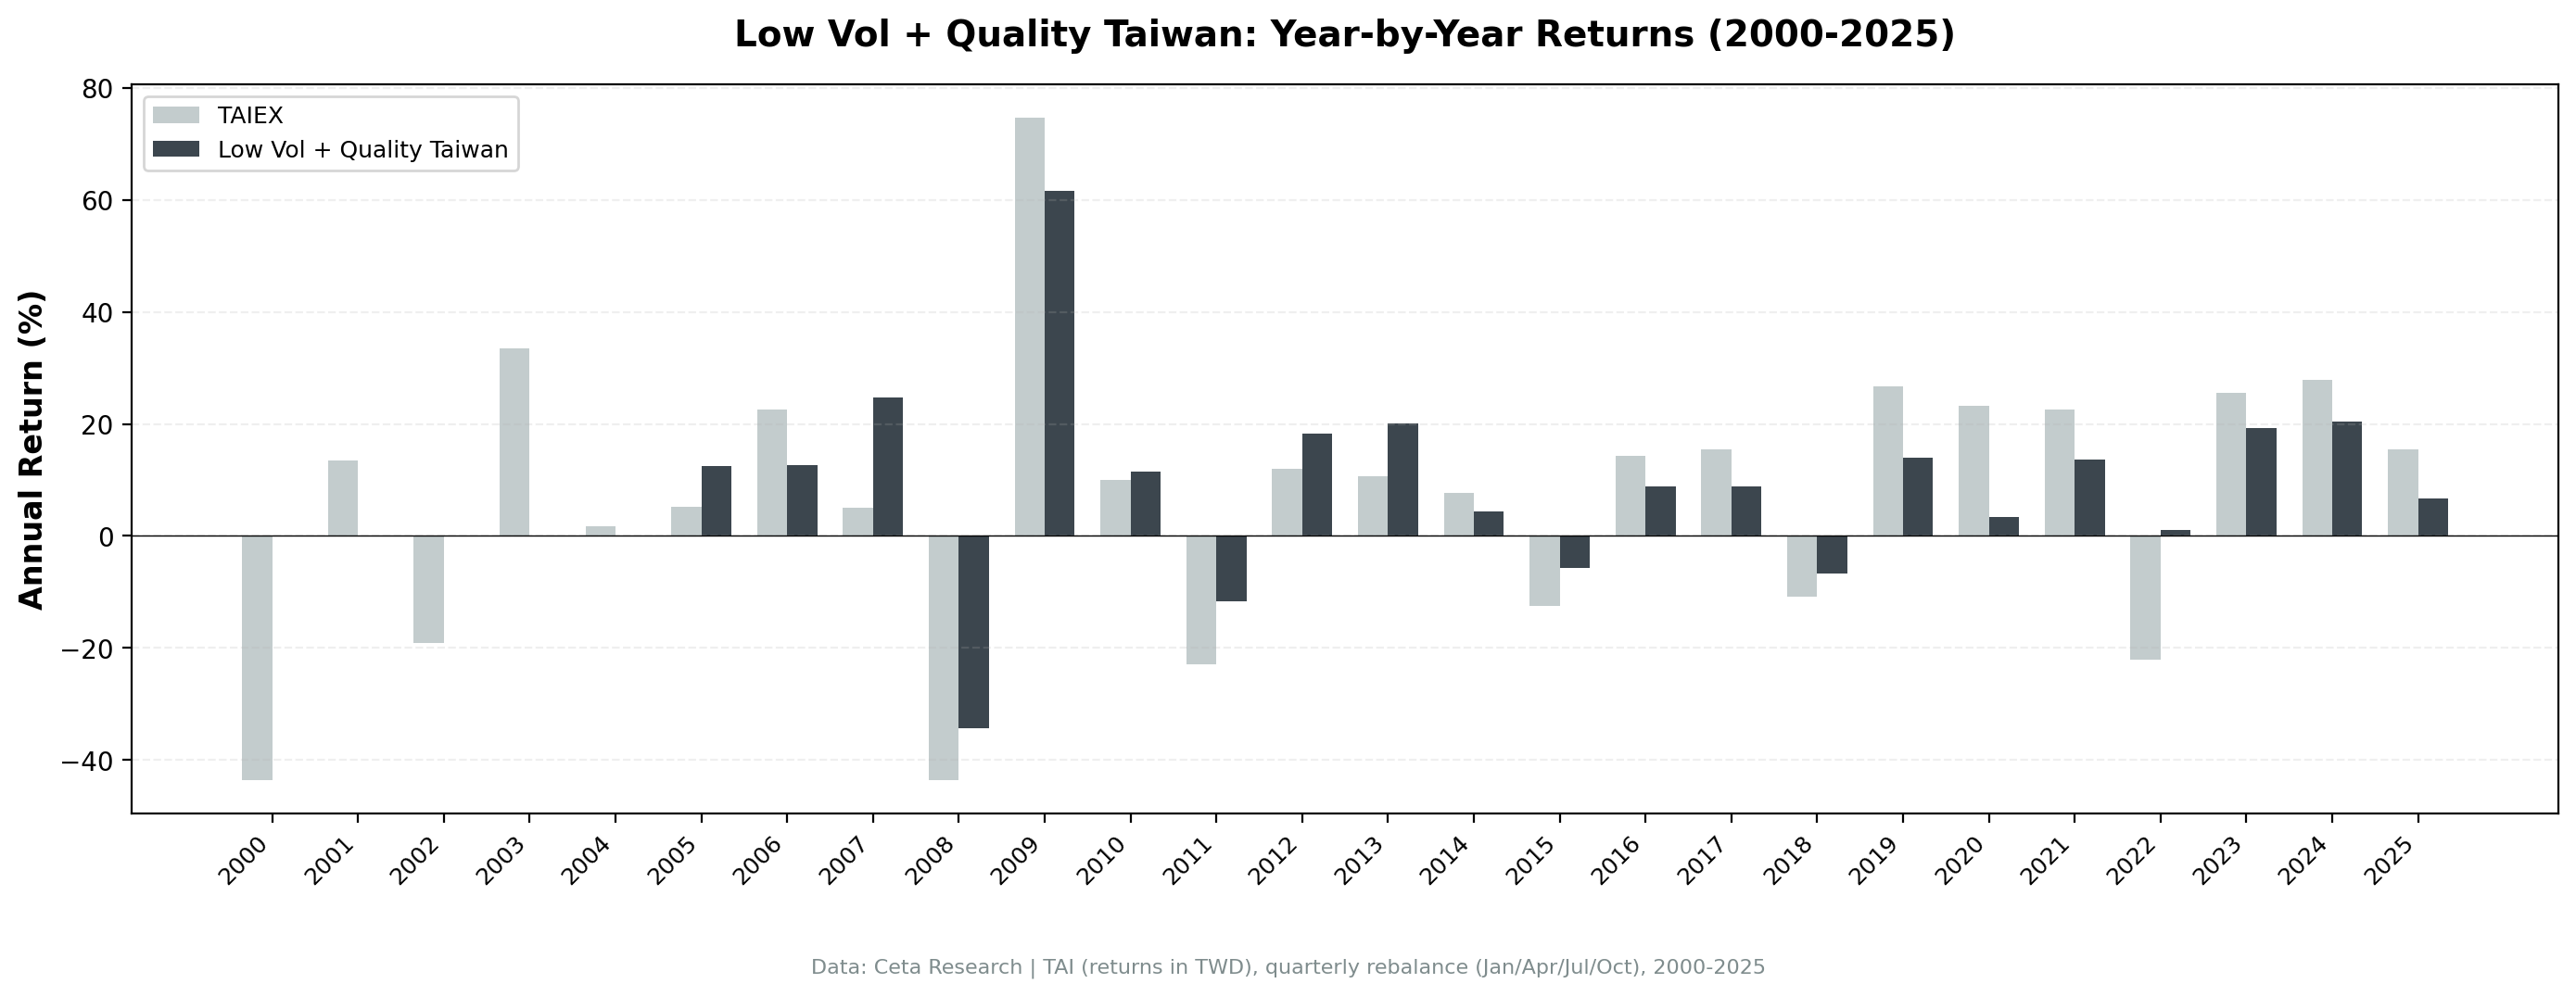
The strategy's best years come when Taiwan's broad market falls or stagnates, and the low-vol portfolio holds up.
| Year | Excess vs TAIEX |
|---|---|
| 2000 | +43.6% |
| 2022 | +23.2% |
| 2007 | +19.6% |
2000 leads the list. The TAIEX crashed 43.6% as the dot-com bubble burst, and the portfolio held cash and lost nothing. That was an early period when Taiwan's investable universe was too thin for 10 names to pass both filters, so dodging the crash was as much a coverage artifact as a strategy call. 2022 is the cleaner example, with the portfolio fully invested. Taiwan's semiconductor-heavy index fell 22% while the low-vol quality portfolio gained 1%. The portfolio's defensive positioning (telecoms, utilities, food) avoided the tech selloff. 2007 was similar: TAIEX gained only 5% while the portfolio rallied 25%.
When It Struggles
| Year | Excess vs TAIEX |
|---|---|
| 2003 | -33.5% |
| 2020 | -19.8% |
| 2001 | -13.5% |
2003 tops the list, but it isn't a real loss. The portfolio held cash at 0.0% while the TAIEX surged 33.5%. That's a data-coverage artifact, not a strategy call. In the early years (2000 through 2004) Taiwan's investable universe was thin and too few stocks passed both filters, so the strategy sat in cash. It missed the 2003 rebound the same way it missed the 2001 recovery (+13.5% for the TAIEX). Those early cash years cut both ways: the portfolio also dodged the 2000 crash entirely, which is why 2000 tops the "when it works" table.
2020 was the semiconductor super-cycle, and here the portfolio was fully invested. Taiwan's chip stocks rallied 23% as pandemic demand for electronics exploded. The low-vol portfolio gained only 3%. The strategy deliberately avoids high-beta tech stocks, so it missed that rally. The same pattern in 2021 (+14% vs TAIEX +23%) and 2019 (+14% vs TAIEX +27%). Low-vol quality doesn't participate in tech surges. That's the trade-off.
Why Taiwan's Low-Vol Profile Is Unusual
Taiwan is a tech-dominated market where low-vol quality dramatically outperforms the local index on risk-adjusted returns (0.424 Sharpe vs 0.138 for TAIEX). The reason is structural.
Taiwan's listed company universe has a clear split. On one side: semiconductor and tech supply chain companies with high earnings cyclicality, tight analyst coverage, and high beta to global demand cycles. On the other: a smaller group of domestic-facing companies in telecoms, financials, food, and infrastructure. These companies have stable earnings, consistent margins, and genuinely low price volatility.
The quality filters (ROE > 10%, operating margin > 10%) don't eliminate one group or the other. Both tech and non-tech companies pass. But the volatility rank filter does the real work. It pulls the portfolio toward the domestic, non-cyclical cluster. The result is a portfolio that looks nothing like Taiwan's market cap-weighted index (which is overwhelmingly semiconductor stocks) but captures Taiwan's domestic economic stability.
This creates a genuine diversification benefit for global investors. You get Taiwan's corporate quality without Taiwan's tech-cycle risk.
Limitations
Cash drag. 20% cash periods reduce compounding. The 6.68% CAGR includes these periods. An investor could deploy capital elsewhere during cash quarters, but that requires a separate allocation decision.
Max drawdown was still -42.63%. Better than TAIEX's -65.25%, but still a large decline. The low-vol filter reduced volatility and improved risk-adjusted returns, but it didn't prevent deep drawdowns during market-wide panics.
Sector concentration risk. The low-vol filter concentrates the portfolio in non-tech sectors. Regulatory changes, domestic policy shifts, or sector-specific issues could hit these names disproportionately.
Currency effects. Returns are in TWD. TWD appreciation or depreciation against USD/EUR/etc. affects what a non-Taiwan investor actually receives.
Absolute return beats local market. The portfolio's 6.68% CAGR beats TAIEX's 4.38% by +2.30% annually. For investors seeking Taiwan exposure, this is a genuine improvement over the index.
Part of a Series
This is part of a global study testing low volatility + quality across 14 exchanges using local benchmarks. Taiwan beats its local benchmark by +2.30% annually.
- US flagship: 0.484 Sharpe over 25 years
- India: 16.9% CAGR, +5.8% vs Sensex
- Full 14-exchange comparison
Run It Yourself
Live screen:
python3 low-vol-quality/screen.py --preset taiwan
Backtest:
python3 low-vol-quality/backtest.py --preset taiwan --output results/returns_TAI.json --verbose
Code: github.com/ceta-research/backtests/tree/main/low-vol-quality
Takeaway
Taiwan's stock market is built around semiconductors. The low-vol quality strategy ignores that. It finds the 30 quietest, most profitable stocks on the exchange and holds them. The result: a portfolio that behaves like one-third the market's risk (beta 0.314), delivers a 0.424 Sharpe vs TAIEX's 0.138, and beats the local market by +2.30% annually with only 29% down capture.
The 20% cash rate shows the strategy is frequently starved for qualifying names. But when it's invested, the risk-adjusted performance is strong. Taiwan's non-cyclical companies, hidden behind the semiconductor headlines, provide genuine low-vol quality exposure that beats the local index.
For investors who want Taiwan exposure without the semiconductor roller coaster, this is what the data supports.
References
- Baker, M., Bradley, B. & Wurgler, J. (2011). "Benchmarks as Limits to Arbitrage: Understanding the Low-Volatility Anomaly." Financial Analysts Journal, 67(1), 40-54.
- Ang, A., Hodrick, R., Xing, Y. & Zhang, X. (2006). "The Cross-Section of Volatility and Expected Returns." Journal of Finance, 61(1), 259-299.
- Frazzini, A. & Pedersen, L. (2014). "Betting Against Beta." Journal of Financial Economics, 111(1), 1-25.
- Novy-Marx, R. (2013). "The Other Side of Value: The Gross Profitability Premium." Journal of Financial Economics, 108(1), 1-28.
Data: Ceta Research, 2000-2025. Full methodology: Methodology
Past performance does not guarantee future results. This is educational content, not investment advice.