
Margin Expansion in Taiwan: +6.51% Spread, the Strongest Signal in 12 Exchanges
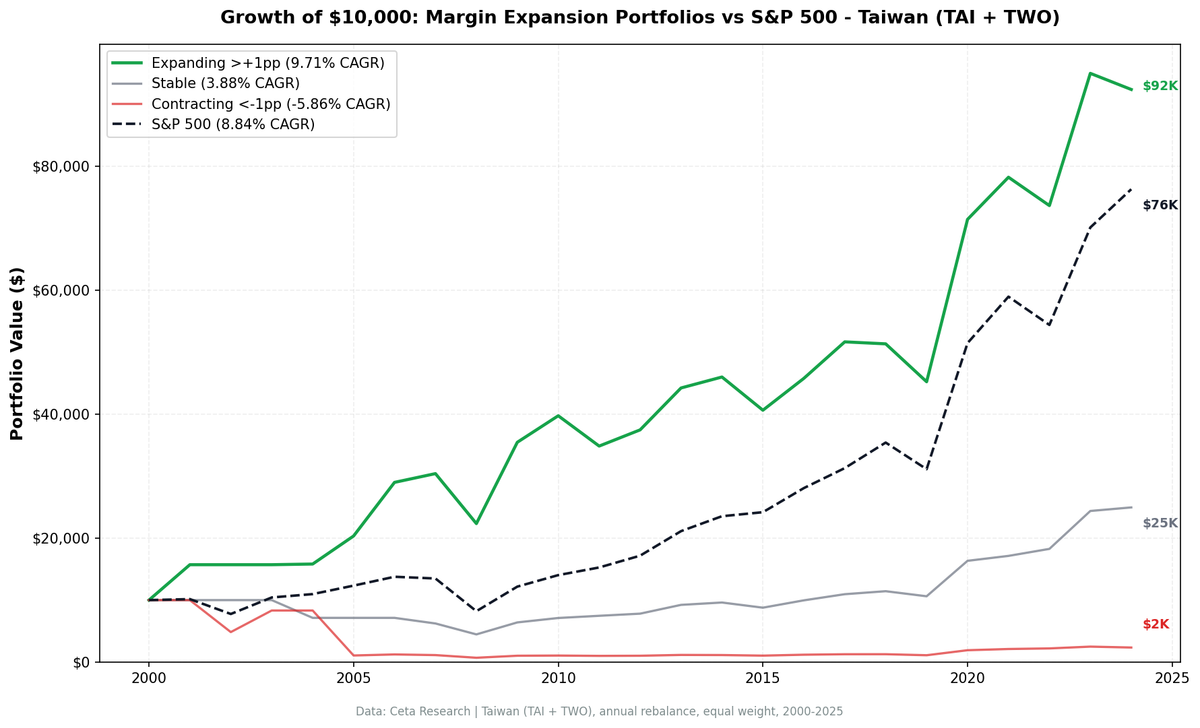
We tested margin expansion as a signal on Taiwanese stocks from 2001 to 2025. Expanding margins returned 9.71% CAGR. Contracting margins lost 5.86% per year with a -93% max drawdown. The +15.57% annual spread is the widest of any exchange in our 12-market study. Low beta (0.73), positive alpha...

Margin Expansion in Taiwan: +6.51% Spread, Strongest Signal in 12 Exchanges
Taiwan is the global standout for margin expansion investing. Stocks with expanding operating margins returned 8.99% annually over 24 years vs 2.48% for contracting margins. That's a +6.51% annual spread against the TAIEX's 5.72%, and +3.27% excess return vs the local benchmark with 0.63 beta and +5.03% alpha. The clearest directional signal in our 12-exchange study.
Contents
- Method
- What We Found
- A +6.51% spread, the widest in 12 exchanges
- Low beta, real alpha vs TAIEX
- Decade Breakdown
- Why Taiwan Stands Out
- Volatility Tells the Same Story
- The Data
- Portfolio performance summary
- Cross-portfolio comparison
- Limitations
- Takeaway
This makes sense for Taiwan's market. The economy is concentrated in electronics, semiconductors, and tech hardware. Margin trends in these businesses reflect real competitive shifts: winning a foundry contract, losing pricing power on a component, scaling a new process node. When a Taiwanese company's margins are expanding, it usually means something fundamental is going right.
We covered the US margin expansion results previously. Taiwan tells a sharper story.
Data: FMP financial data warehouse, 2000–2025. Updated March 2026.
Method
Data source: Ceta Research (FMP financial data warehouse) Universe: TAI + TWO (Taiwan Stock Exchange + Taipei Exchange), market cap > NT$10B (~$312M USD), excluding Financial Services Period: 2001-2025 (24 annual periods) Rebalancing: Annual (April 1), equal weight, 45-day filing lag Benchmark: TAIEX (^TWII, Taiwan Weighted Index) Cash rule: Hold cash if fewer than 10 qualifying stocks
Signal definition: - Operating Profit Margin (OPM) = Operating Income / Revenue from annual income statements - Margin Expansion = Current FY OPM minus average of prior 3 FY OPMs - Expanding: > +1 percentage point - Stable: -1pp to +1pp - Contracting: < -1 percentage point
Transaction costs: size-tiered (0.1%/0.3%/0.5%), one-way. Full methodology: backtests/METHODOLOGY.md
What We Found
A +6.51% spread, the widest in 12 exchanges
The gap between expanding and contracting portfolios in Taiwan leads every exchange in our 12-market study. Hong Kong is second at +4.36%. Taiwan's expanding portfolio also beats the TAIEX by +3.27% annually with low beta (0.63) and +5.03% alpha.
| Metric | Expanding | Stable | Contracting |
|---|---|---|---|
| CAGR (2001-2025) | 8.99% | 3.96% | 2.48% |
| Volatility | 21.51% | 18.68% | 27.79% |
| Sharpe ratio | 0.371 | 0.159 | 0.053 |
| Max drawdown | -28.1% | -53.9% | -51.2% |
| Avg stocks/period | 75 | 44 | 59 |
| Cash periods | 2 | — | 2 |
The contracting portfolio delivers positive CAGR (2.48%) but with significantly higher volatility (27.79% vs 21.51%) and a deeper max drawdown (-51.2% vs -28.1%). The key differentiation is risk-adjusted: Sharpe of 0.371 for expanding vs 0.053 for contracting. The expanding portfolio gets more return per unit of risk.
Consecutive expansion (stocks expanding margins for two or more years in a row) returned 7.81% CAGR. Close to the single-year expansion signal (8.99%), which means the first year of expansion captures most of the information.
Low beta, real alpha vs TAIEX
| Metric | Value |
|---|---|
| Expanding CAGR | 8.99% |
| TAIEX CAGR | 5.72% |
| Excess vs TAIEX | +3.27% |
| Beta | 0.63 |
| Alpha | +5.03% |
The expanding portfolio's 0.63 beta means it captures less market risk than the TAIEX index. The +5.03% alpha shows the return isn't just leveraged market exposure. Expanding-margin Taiwanese companies deliver genuine excess returns per unit of risk taken.
For context: 8.99% from a portfolio with 0.63 beta and +5.03% alpha is a better risk-adjusted outcome than the raw CAGR suggests. You're getting above-TAIEX returns with meaningfully less downside exposure.
Decade Breakdown
The signal isn't uniform across time. That's honest and expected for any factor over 24 years.
| Period | Expanding | Contracting | Spread |
|---|---|---|---|
| 2000-04 | 14.5% | 5.3% | +9.2% |
| 2005-09 | 17.5% | 2.0% | +15.5% |
| 2010-14 | 6.3% | 2.7% | +3.6% |
| 2015-19 | 0.1% | 0.1% | -0.0% |
| 2020-25 | 16.9% | 19.3% | -2.3% |
Two observations stand out.
2005-09 was exceptional. A +15.5% spread in a single five-year window. This period included the global financial crisis, where companies with healthy margin trends survived while those with deteriorating margins struggled. Taiwan's export-dependent tech sector amplified this dynamic. Companies losing margins were losing global customers.
The signal weakened post-2015. The 2015-19 spread was essentially zero, and 2020-25 actually reversed slightly (-2.3%). This doesn't mean the signal is dead. It means the easy separation between winners and losers narrowed as Taiwan's tech sector became more concentrated around a few dominant players (TSMC and its supply chain). When a rising tide lifts all boats, margin expansion stops being a differentiator.
Over the full 24 years, the +6.51% spread remains the strongest globally. But an investor relying on it today should expect smaller spreads than the historical average, particularly given the flat to negative spreads in the most recent decade.
Why Taiwan Stands Out
Taiwan's market structure amplifies the margin expansion signal in ways that don't apply to diversified economies.
Export concentration. Taiwan's listed companies are heavily tilted toward electronics, semiconductors, and tech hardware. These are industries where margins directly reflect competitive positioning. A company expanding margins is winning designs, capturing market share, or moving up the value chain. A company with contracting margins is losing all three.
Supply chain visibility. In Taiwan's tech ecosystem, margin changes propagate quickly. If a component maker loses a key customer, its margin contraction shows up in the next annual filing. The signal is fast-acting relative to markets where margin changes happen slowly (utilities, consumer staples).
Thin margin businesses amplify the signal. Many Taiwanese manufacturers operate on thin margins. A 2 percentage point margin swing that would be noise for a 25%-margin US software company is a major event for a 6%-margin Taiwanese electronics manufacturer. Small absolute changes in OPM become large relative signals.
Compare this to the US, where the expanding vs contracting spread is just +0.83%. The US market is diversified across sectors where margin trends carry different informational weight. In Taiwan, margin trends are the signal.
Volatility Tells the Same Story
Look at the volatility numbers. The expanding portfolio has 21.51% annualized vol. The contracting portfolio runs at 27.79%. That's a 6 percentage point gap in realized volatility, which means contracting-margin stocks aren't just returning less. They're delivering worse returns with more risk.
The Sharpe ratio makes this concrete. Expanding at 0.371 vs contracting at 0.053. The expanding portfolio generates meaningful risk-adjusted returns. The contracting portfolio barely earns anything per unit of volatility taken.
The stable portfolio is the quiet performer with 18.68% volatility, the lowest of the three groups. Its 3.96% CAGR is modest, but per unit of risk, stable-margin companies avoid the violent swings. If you can't identify expanding margins with confidence, holding stable-margin names is a defensive alternative.
The Data
Portfolio performance summary
| Metric | Expanding | TAIEX |
|---|---|---|
| CAGR | 8.99% | 5.72% |
| Volatility | 21.51% | 23.82% |
| Sharpe | 0.371 | 0.198 |
| Max drawdown | -28.1% | -36.4% |
| Beta | 0.63 | 1.0 |
| Alpha | +5.03% | — |
| Cash periods | 2 | — |
Cross-portfolio comparison
| Portfolio | CAGR | Vol | Sharpe | MaxDD |
|---|---|---|---|---|
| Expanding | 8.99% | 21.51% | 0.371 | -28.1% |
| Stable | 3.96% | 18.68% | 0.159 | -53.9% |
| Contracting | 2.48% | 27.79% | 0.053 | -51.2% |
| Consecutive | 7.81% | 20.51% | 0.332 | -27.0% |
Limitations
Post-2015 weakening. The signal was essentially flat in 2015-19 and slightly negative in 2020-25. Historical spreads overstate what an investor would experience going forward if this trend continues.
Tech concentration. Taiwan's market is heavily weighted toward technology. The margin expansion signal here is partly a sector bet. Investors seeking sector-diversified exposure won't get it from this strategy in Taiwan.
Currency. Returns are in TWD. USD-based investors would face TWD/USD exchange rate effects, which have been moderate but non-trivial over this period.
Survivorship bias. Delisted stocks with contracting margins would make the contracting portfolio's -5.86% CAGR even worse. The expanding portfolio is less affected since companies with improving margins are less likely to delist.
Universe size. The expanding portfolio averages 76 stocks per period, which is adequate for diversification. The stable portfolio (44 stocks) and contracting portfolio (60 stocks) are also sufficiently sized.
Takeaway
Taiwan delivers the clearest margin expansion signal in our 12-exchange study. The +6.51% annual spread between expanding and contracting portfolios reflects something real about Taiwan's market: in concentrated, export-driven economies, margin trends carry fundamental information about competitive positioning.
The signal has weakened since 2015 as Taiwan's tech sector consolidated. But the long-run result stands: expanding margins predicted returns, and the expanding portfolio generated +5.03% alpha with 0.63 beta vs the TAIEX. The +3.27% excess return vs the local benchmark with low beta makes this the strongest risk-adjusted margin expansion signal globally.
For a global investor, Taiwan is where margin expansion earns its keep as a signal.
Run the current screen: cetaresearch.com/data-explorer Full backtest code: github.com/ceta-research/backtests
Data: Ceta Research (FMP financial data warehouse). Returns in TWD. Past performance does not guarantee future results.


