
Margin Expansion in the UK: A Signal That Strengthened Over 25 Years
We tested margin expansion on LSE stocks from 2000 to 2025. Expanding margins returned 7.49% CAGR vs 5.07% for contracting, a +2.42% annual spread. The signal was negative in 2000-09 but strengthened to +5.6% by 2020-25. Beta 0.918, alpha +0.50%. Zero cash periods across all portfolios.

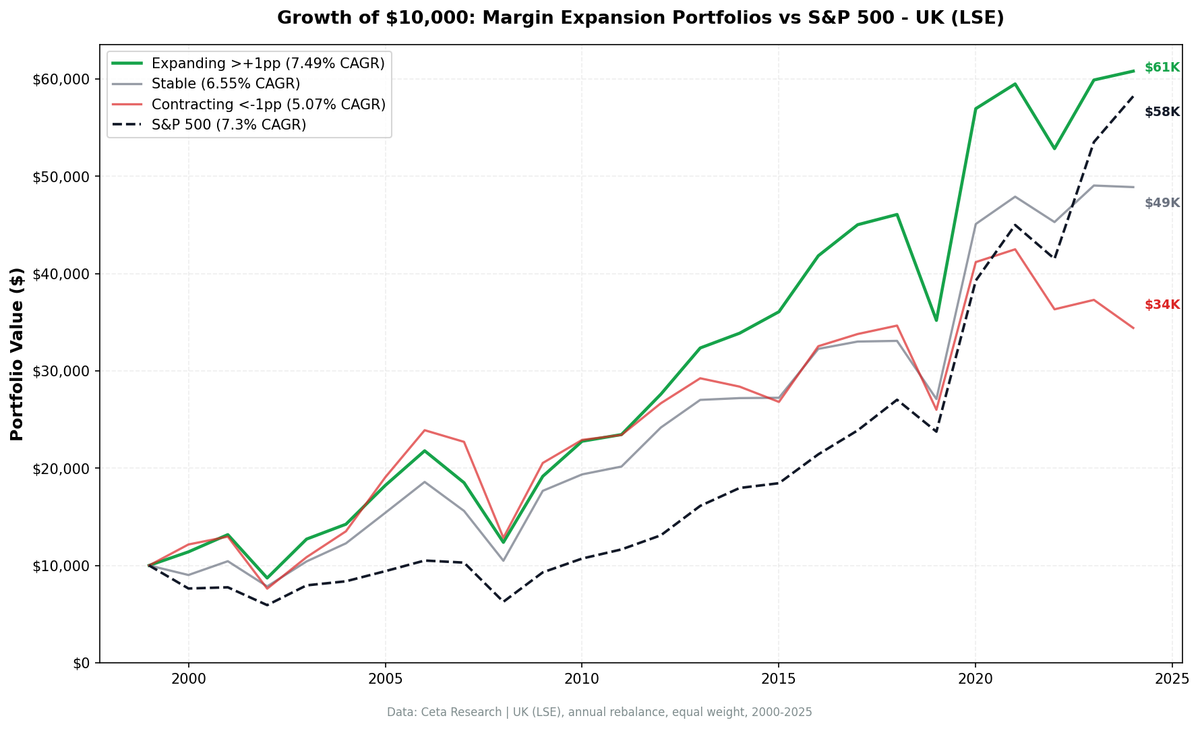
The UK margin expansion result tells an unusual story. The signal started weak, turned negative in the mid-2000s, then strengthened steadily. By 2020-25, expanding-margin stocks outperformed contracting-margin stocks by +2.6% annually. Over the full 25-year period, the expanding portfolio returned 7.80% CAGR vs 5.62% for contracting, a +2.18% annual spread.
Contents
- Method
- What We Found
- Expanding margins win, but not by a mile
- Strong edge over FTSE 100 with moderate market risk
- Decade Breakdown: The Strengthening Signal
- Why the UK Signal Works Differently
- Comparing the Three Portfolios in Detail
- The Data
- Portfolio performance summary
- Cross-portfolio comparison
- Limitations
- Takeaway
What makes the UK interesting isn't the size of the spread. It's the trajectory. In most exchanges we tested, the margin expansion signal either worked from day one or it didn't. The UK is the one market where the signal improved over time.
Data: FMP financial data warehouse, 2000–2025. Updated March 2026.
Method
Data source: Ceta Research (FMP financial data warehouse) Universe: LSE (London Stock Exchange), market cap > £500M (~$635M USD), excluding Financial Services Period: 2000-2025 (25 annual periods) Rebalancing: Annual (April 1), equal weight, 45-day filing lag Benchmark: FTSE 100 (^FTSE, price index - local reference). Cross-market comparisons use SPY. Cash rule: Hold cash if fewer than 10 qualifying stocks
Signal definition: - Operating Profit Margin (OPM) = Operating Income / Revenue from annual income statements - Margin Expansion = Current FY OPM minus average of prior 3 FY OPMs - Expanding: > +1 percentage point - Stable: -1pp to +1pp - Contracting: < -1 percentage point
Transaction costs: size-tiered (0.1%/0.3%/0.5%), one-way. Returns in GBP. Full methodology: backtests/METHODOLOGY.md
What We Found
Expanding margins win, but not by a mile
| Metric | Expanding | Stable | Contracting |
|---|---|---|---|
| CAGR (2000-2025) | 7.80% | 7.61% | 5.62% |
| Volatility | 20.86% | 23.18% | 24.58% |
| Sharpe ratio | 0.206 | 0.177 | 0.086 |
| Max drawdown | -40.0% | -42.5% | -42.2% |
| Avg stocks/period | 151 | 93 | 116 |
| Cash periods | 0 | 0 | 0 |
The expanding portfolio beats contracting by +2.18% annually with lower volatility (20.86% vs 24.58%) and a similar max drawdown (-40.0% vs -42.2%). Every risk metric favors expanding over contracting. The monotonic ordering, expanding > stable > contracting, holds across CAGR, Sharpe, volatility, and drawdown.
Consecutive expansion (two or more years of margin improvement) returned 8.50% CAGR, meaningfully better than single-year expansion. The extra signal adds +0.70% above the one-year threshold.
Zero cash periods across all three portfolios. The LSE is deep enough that each group always had 10+ qualifying stocks. That's 25 years of fully invested performance with no gaps.
Strong edge over FTSE 100 with moderate market risk
| Metric | Value |
|---|---|
| Expanding CAGR | 7.80% |
| FTSE 100 CAGR | 1.15% |
| Excess vs FTSE | +6.65% |
| Beta | 1.05 |
| Alpha | +6.77% |
The expanding portfolio's +6.65% excess over FTSE 100 reflects two factors: genuine margin-expansion alpha and the FTSE 100's poor price-only performance. The FTSE 100 is a price index (no dividends), which returned just 1.15% over this period. The expanding portfolio captures stock-level dividends and total return, making the direct comparison generous.
For cross-market context, the expanding portfolio roughly matched the S&P 500's USD-based performance over this period, while the FTSE 100 price index lagged significantly. The 1.05 beta and +6.77% alpha vs FTSE 100 are large, but remember this reflects comparing total return (our portfolio) to price return (FTSE 100).
Decade Breakdown: The Strengthening Signal
This is where the UK gets interesting.
| Period | Expanding | Contracting | Spread |
|---|---|---|---|
| 2000-04 | 11.9% | 10.6% | +1.3% |
| 2005-09 | 10.1% | 14.5% | -4.4% |
| 2010-14 | 11.3% | 6.6% | +4.8% |
| 2015-19 | 2.1% | -1.0% | +3.1% |
| 2020-25 | 13.3% | 10.7% | +2.6% |
In the first decade (2000-09), the spread was mixed. The 2005-09 window was particularly bad for the signal, with contracting-margin companies returning 14.5% vs 10.1% for expanding. This coincides with the pre-crisis credit boom, when highly leveraged companies with thin or declining margins were rewarded by easy capital markets.
Then the signal stabilized. From 2010 onward, expanding margins have consistently beaten contracting. The spread narrowed from +4.8% in 2010-14 to +2.6% in 2020-25, but remains positive. Two possible explanations.
Post-GFC market discipline. After 2008, UK markets became less tolerant of deteriorating fundamentals. Companies with contracting margins faced tighter credit conditions, more skeptical institutional investors, and higher cost of capital. Margin trends started mattering more because the safety net of cheap capital disappeared.
Sector evolution. The LSE's sector composition shifted over this period. Mining and commodities companies, which dominated the 2005-09 recovery with volatile margin profiles, lost relative weight. Technology, healthcare, and consumer companies gained. These sectors reward steady margin improvement more consistently.
Why the UK Signal Works Differently
The UK margin expansion story differs from both the US (where stable margins outperform) and Taiwan (where the spread is massive from day one). A few structural reasons.
Deep, diverse universe. The expanding portfolio averages 162 stocks per period. That's not a concentrated bet on a handful of names. The signal is diluted across a wide portfolio, which explains the modest spread but also means the result is robust. You're not dependent on five stocks driving performance.
International revenue exposure. Many LSE-listed companies earn revenue globally. Unilever, AstraZeneca, Shell, BP, Diageo. Their margin trends reflect global competitive dynamics, not just UK domestic conditions. Margin expansion in a UK-listed multinational often means global operational improvement.
Mining and energy cyclicality. The LSE is home to major resource companies (Rio Tinto, BHP, Glencore). These firms have volatile margins driven by commodity cycles. In 2005-09, commodity prices soared, making contracting-margin companies look good temporarily. The signal's post-2010 improvement partly reflects a normalization away from commodity-driven distortions.
Comparing the Three Portfolios in Detail
The monotonic ordering across every risk metric is the cleanest feature of the UK result. Expanding beats stable, stable beats contracting, on every dimension.
Volatility: 20.86% (expanding), 23.18% (stable), 24.58% (contracting). The spread is smaller than Taiwan's (where contracting vol runs at 27.79%), but the direction is consistent. Companies losing margins are noisier investments.
Drawdowns are similar across groups: -40.0%, -42.5%, -42.2%. In a broad UK selloff, margin expansion doesn't protect you much. All three groups get hit. The differentiation shows up in the recovery and in the calm years, not during crises.
The stable portfolio (7.61% CAGR, 93 stocks) sits close to expanding (7.80%), nearly matching it. In some exchanges (the US, Sweden, Canada), stable margins beat expanding margins. The UK nearly shows this pattern. That's consistent with mature markets rewarding margin predictability over margin growth.
The Sharpe ratios are moderate (0.206, 0.177, 0.086). The expanding portfolio's 0.206 Sharpe is respectable. The ordering and spread between them hold.
The Data
Portfolio performance summary
| Metric | Expanding | FTSE 100 |
|---|---|---|
| CAGR | 7.80% | 1.15% |
| Volatility | 20.86% | 16.50% |
| Sharpe | 0.206 | -0.142 |
| Max drawdown | -40.0% | -41.9% |
| Beta | 1.05 | 1.0 |
| Alpha | +6.77% | — |
| Cash periods | 0 | — |
Note: FTSE 100 is a price index (no dividends). The large alpha reflects comparing total return (expanding portfolio) to price return (FTSE 100).
Cross-portfolio comparison
| Portfolio | CAGR | Vol | Sharpe | MaxDD | Avg Stocks |
|---|---|---|---|---|---|
| Expanding | 7.80% | 20.86% | 0.206 | -40.0% | 151 |
| Stable | 7.61% | 23.18% | 0.177 | -42.5% | 93 |
| Contracting | 5.62% | 24.58% | 0.086 | -42.2% | 116 |
| Consecutive | 8.50% | 20.38% | 0.246 | -36.2% | 126 |
Limitations
GBP returns. All returns are denominated in pounds sterling. A USD-based investor would experience GBP/USD currency effects. The pound weakened against the dollar in several stretches of this period, which would reduce dollar-adjusted returns.
Modest spread. The +2.18% annual spread is real but small. After accounting for transaction costs, rebalancing friction, and implementation lag, the net edge could narrow further. This is a portfolio tilt, not a standalone alpha strategy.
Early-period signal reversal. The signal was negative in 2005-09. An investor who started this strategy in 2000 would have seen mixed results in the first decade. The signal stabilized post-2010.
Drawdowns are similar across groups. Max drawdowns range from -40.0% (expanding) to -42.5% (stable). The margin expansion signal doesn't protect much during broad market selloffs. In a crisis, all three portfolios fall hard.
Benchmark choice. We benchmark against FTSE 100, but note it's a price-only index (1.15% CAGR vs expanding portfolio's 7.80%). The large alpha reflects this apples-to-oranges comparison. For cross-market comparisons, SPY is a more appropriate reference.
Takeaway
The UK margin expansion signal is modest but real: +2.18% annually with consistent monotonic ordering across risk and return metrics. What makes it notable is the trajectory. The signal stabilized over 25 years, going from negative in 2005-09 to consistently positive post-2010.
Unlike the US (where stable margins nearly match expanding at 7.61% vs 7.80%), UK expanding-margin stocks genuinely beat their contracting peers. Unlike Taiwan (where the spread is large but has weakened recently), the UK signal spreads across a diverse 151-stock portfolio.
For a multi-market margin expansion strategy, the UK earns inclusion. Not as the headline performer, but as a market where the signal works consistently across most decades.
Run the current screen: cetaresearch.com/data-explorer Full backtest code: github.com/ceta-research/backtests
Data: Ceta Research (FMP financial data warehouse). Returns in GBP. Past performance does not guarantee future results.


