
12-Month Price Momentum Across 18 Markets: Where the Factor Actually Works
We ran pure 12-month price momentum on 18 exchanges worldwide. 8 of 17 comparable exchanges outperform SPY. India (NSE) leads at 17.33% CAGR with +9.56% excess. Germany has the best Sharpe (0.588). US trails SPY by 0.62% with 159% down capture. The pattern is geographic.

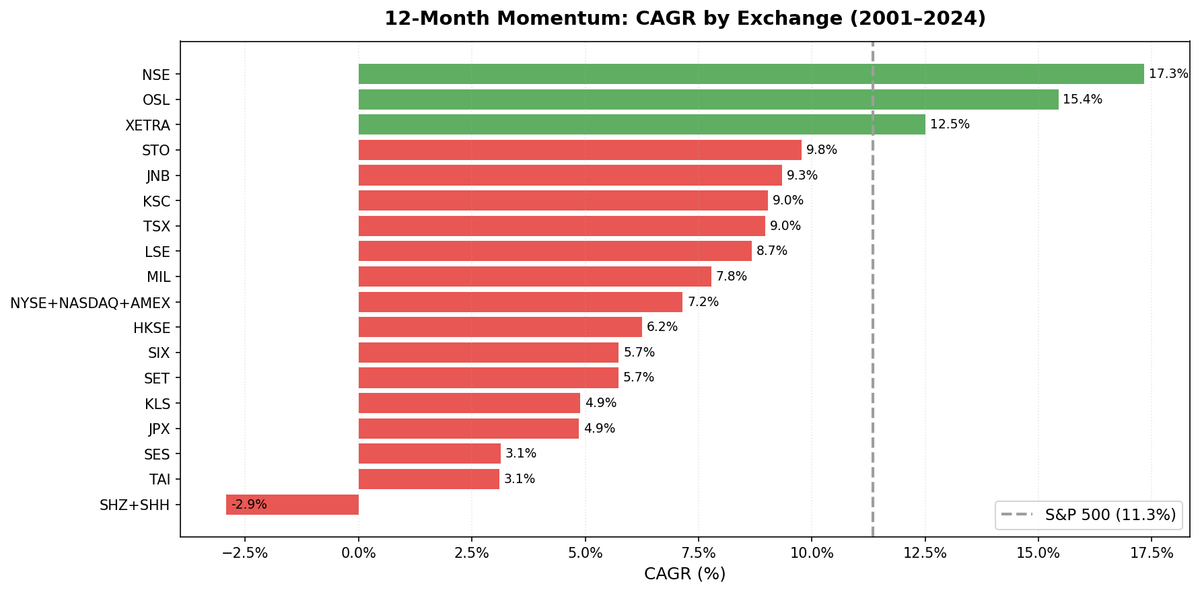
The academic literature says momentum works everywhere. The data from 18 exchanges says it's more complicated. Pure 12-month price momentum (top 30 by 12M-1M return, semi-annual, no quality filters) was backtested across 18 exchanges covering every major equity market from 2000 to 2025. 8 exchanges outperform the S&P 500, with Italy right at parity. 9 underperform (Norway counted separately due to shorter data history). The pattern is geographic: India and Europe deliver genuine alpha; US, China, and most of developed Asia do not.
Contents
- Method
- What We Found
- The Geographic Pattern
- Down Capture: The Risk Dimension
- The 2008 Test
- What the Academic Literature Predicts
- Backtest Methodology
- Limitations
- Takeaway
- References
- Run This Screen Yourself
Data: FMP financial data warehouse, 2000–2025. Updated May 2026.
Method
| Parameter | Value |
|---|---|
| Signal | 12-month return, skip last month (12M-1M) |
| Selection | Top 30 by momentum, equal weight |
| Rebalancing | Semi-annual (January, July) |
| Execution | Next-day close (market-on-close) |
| Cash rule | Fewer than 10 qualifying stocks |
| Data source | FMP via Ceta Research warehouse |
| Benchmark | S&P 500 (SPY) for cross-market table; local indexes for down capture |
| Period | 2000–2025 (varies by exchange) |
| Market cap filter | Exchange-specific thresholds (point-in-time, 45-day lag) |
| Exchanges | 18: NYSE+NASDAQ+AMEX, NSE, XETRA, LSE, JPX, SHZ+SHH, HKSE, KSC, TAI, TSX, SIX, STO, SET, JNB, OSL, MIL, KLS, SES |
The signal is the canonical Jegadeesh-Titman (1993) implementation: price return from 12 months ago to 1 month ago, skipping the most recent month to avoid short-term reversal noise. This study uses no financial quality filters: pure price signal only. Market cap thresholds are exchange-specific (e.g., $1B USD for US, ₹20B for India, ¥100B for Japan) to maintain consistent universe quality across different market sizes. An oscillation filter removes phantom holiday rows from FMP's adjClose data, and a $1 floor plus 500% return cap remove split-adjustment artifacts.
What We Found
Full 18-exchange results:
| Exchange | CAGR | Excess vs SPY | Sharpe | Max DD | Down Cap (local)* | Cash% |
|---|---|---|---|---|---|---|
| India (NSE) | 17.33% | +9.56% | 0.370 | -68.13% | 62.5% | 18% |
| Germany (XETRA) | 12.51% | +4.74% | 0.588 | -39.69% | 35.7% | 0% |
| Sweden (STO) | 9.78% | +2.01% | 0.368 | -48.65% | 59.9% | 4% |
| South Africa (JNB) | 9.34% | +1.57% | 0.022** | -23.67% | 36.7% | 18% |
| Korea (KSC) | 9.03% | +1.26% | 0.245 | -44.13% | 48.5% | 22% |
| Canada (TSX) | 8.97% | +1.20% | 0.369 | -40.06% | 42.9% | 0% |
| UK (LSE) | 8.67% | +0.90% | 0.270 | -47.50% | 57.9% | 0% |
| Italy (MIL) | 7.78% | +0.01% | 0.245 | -55.19% | 108.8% | 18% |
| S&P 500 (SPY) | 7.77% | benchmark | 0.376 | -38.01% | 100% | |
| US (NYSE+NASDAQ+AMEX) | 7.15% | -0.62% | 0.188 | -65.98% | 158.9% | 0% |
| HKSE | 6.25% | -1.52% | 0.110 | -68.47% | 80.8% | 4% |
| Switzerland (SIX) | 5.74% | -2.03% | 0.273 | -47.14% | 104.5% | 0% |
| Thailand (SET) | 5.73% | -2.04% | 0.153 | -42.09% | 60.0% | 16% |
| Malaysia (KLS) | 4.89% | -2.88% | 0.214 | -35.51% | 30.3% | 24% |
| Japan (JPX) | 4.86% | -2.91% | 0.205 | -59.35% | 80.2% | 4% |
| Singapore (SES) | 3.14% | -4.63% | 0.038 | -51.60% | 67.9% | 16% |
| Taiwan (TAI) | 3.11% | -4.66% | 0.101 | -50.85% | 83.4% | 22% |
| China (SHZ+SHH) | -2.92% | -10.69% | -0.112 | -82.75% | 106.9% | 0% |
*Down capture measured vs local benchmark for each exchange (Sensex for India, DAX for Germany, FTSE 100 for UK, etc.). SPY row is 100% by definition. JNB, MIL, KLS local benchmarks unavailable in FMP, fall back to SPY. Norway omitted from main table (data starts 2013; over ~12 years: 15.44% CAGR, 1.070 Sharpe, +4.24% vs Oslo All Share).
**JNB Sharpe is low because South Africa's 9% risk-free rate nearly matches the strategy's return. Use absolute return and down capture instead.
The Geographic Pattern
Where it works: India, Germany, Sweden, South Africa, Korea, Canada, UK, and Italy at parity. These markets share structural characteristics: less systematic momentum trading penetration, deeper mid-cap universes, and real business cycle-driven momentum (commodity cycles, infrastructure cycles, consumer cycles) rather than tech-sentiment cycles.
Where it fails: China, Taiwan, Singapore, Japan, Malaysia, Thailand, Switzerland, Hong Kong, and the US. The US result is closer to break-even than in the prior version of this study, but it still trails SPY with much worse risk. China is the worst overall at -2.92% CAGR with a -82.75% max drawdown.
The crowding hypothesis. US momentum is heavily traded by quantitative funds. Every major factor investor, from AQR to Two Sigma, runs systematic momentum. The premium gets arbitraged toward zero and the crash risk increases as crowded positions unwind simultaneously. The Daniel-Moskowitz (2016) momentum crash mechanism is most acute in the US.
The emerging market pattern. India outperforms massively; China doesn't. This isn't simply "emerging markets = momentum works." Market structure matters. India has domestic-focused growth sectors (consumer, financial, infrastructure) with genuine multi-year earnings trends. China has significant state ownership, policy-driven price movements, and a different market microstructure where momentum signals are contaminated by political and regulatory events.
Down Capture: The Risk Dimension
Down capture is measured against each exchange's local benchmark (Sensex for India, DAX for Germany, FTSE 100 for UK, etc.), which gives a more accurate picture of how momentum behaves relative to the market it trades in. Values below 100% mean the strategy fell less than the local market during downturns. Above 100% means it fell more.
The range across exchanges:
- Malaysia: 30.3% (portfolio fell 70% less than local benchmark in downturns)
- Germany: 35.7% (fell 64% less)
- South Africa: 36.7% (fell 63% less)
- Canada: 42.9% (fell 57% less)
- Korea: 48.5% (fell 52% less)
- UK: 57.9% (fell 42% less)
- Sweden: 59.9% (fell 40% less)
- Thailand: 60.0% (fell 40% less)
- India: 62.5% (fell 37% less)
- Singapore: 67.9% (fell 32% less)
- HKSE: 80.8% (fell 19% less)
- Japan: 80.2% (fell 20% less)
- Taiwan: 83.4% (fell 17% less)
- Switzerland: 104.5% (close to local benchmark)
- China: 106.9% (slightly worse than Shanghai Composite)
- Italy: 108.8% (slightly worse than local benchmark)
- US: 158.9% (fell 59% MORE than SPY)
The US has the worst down capture by far. The most crowded momentum market amplifies crashes the most. In contrast, Germany, Malaysia, and South Africa show strong downside protection relative to their local markets.
South Africa's unusual profile. JNB's 9.34% CAGR with just 36.7% down capture is one of the cleanest risk profiles in the study. The Sharpe is only 0.022 because South Africa's 9% risk-free rate absorbs most of the return. But the combination of equity-like returns with strong downside protection makes this a genuine diversification asset for a global portfolio.
The 2008 Test
Every exchange was hit in 2008. The question is how hard:
| Exchange | 2008 Return | vs SPY (-34.3%) |
|---|---|---|
| Germany | -35.4% | -1 pp |
| UK | -42.8% | -8 pp |
| US | -60.5% | -26 pp |
| India | -68.1% | -34 pp |
| China | -68.4% | -34 pp |
2008 was a globally synchronized crisis driven by forced deleveraging. No exchange was immune. The exchanges with better long-term down capture (Germany, UK) held up best in 2008. India and the US were hit hardest. The US momentum loss (-60.5%) reflects the crowded-factor unwind specific to US quant exposure.
The 2022 crisis showed a different pattern. Rate-shock-driven downturns are more regional and sector-specific. Germany (-14.5% vs -19% SPY), UK (-11.7% vs -19%), and India NSE (+4.7% vs -19%) all performed well relative to SPY in 2022. The down capture numbers in the table above reflect the average across all crisis types, including 2008.
What the Academic Literature Predicts
Asness, Moskowitz, and Pedersen (2013) documented momentum across four equity regions (US, UK, continental Europe, Japan) plus government bonds, currencies, and commodities. Subsequent global replication studies extended the finding across dozens of country markets. The premium is positive and statistically significant in most equity markets globally. This study replicates that finding for most exchanges, but the magnitude varies enormously.
The academic prediction is correct in direction: more exchanges than not show positive excess returns. But the US result (-0.62% annual drag) and the 159% down capture challenge the straightforward "momentum works everywhere equally" interpretation.
The heterogeneity is consistent with the rational-learning interpretation of momentum (Hong and Stein, 1999): when information diffuses slowly through institutional ownership chains, momentum persists longer. Less institutionally penetrated markets see slower information diffusion and stronger momentum. That describes India and Germany better than the US or Japan.
Backtest Methodology
- Data: FMP financial data via Ceta Research warehouse. Price data from
stock_eod(adjusted closes). - Execution: Next-day close (MOC model). Entry at the close following the rebalance signal. No same-bar entry.
- Point-in-time: Market cap filter uses annual
key_metricsfilings with 45-day lag per exchange. - Exchange-specific thresholds: $1B USD (US), ₹20B (India), €500M (Germany), £500M (UK), ¥100B (Japan), etc.
- Cash rule: Fewer than 10 qualifying stocks → hold cash for that semi-annual period.
- Data quality: Oscillation filter removes phantom holiday rows from adjClose. Stocks with adjusted close < $1 excluded. Momentum capped at 500% per stock. Exchanges ASX and SAO excluded (historical adjusted close artifacts too severe for reliable momentum calculation).
- RFR: Exchange-specific risk-free rates for Sharpe calculation (e.g., US 2%, India 6.5%, SA 9%).
- Benchmark: SPY total return used for cross-exchange comparison in the main table. Individual exchange results also include local benchmark comparisons (Sensex for India, DAX for Germany, FTSE 100 for UK, etc.). Down capture is measured vs local benchmarks.
- Annual returns: Compounded from the strategy's semi-annual rebalance windows (Jan 1 / Jul 1 anchored). For years where the year-edge days saw large moves (e.g. 2013), benchmark calendar-year totals reported on public sources can differ by a few percentage points from the period-aligned values shown here. The CAGR, max drawdown, and Sharpe figures are unaffected.
Limitations
SPY as benchmark. The main table uses SPY for cross-exchange comparison. Local investors would measure against local benchmarks and local risk-free rates. The "excess CAGR" figures are vs SPY, which inflates the apparent advantage of non-US exchanges that have historically delivered higher absolute returns. Down capture is measured vs local benchmarks for a more accurate risk picture.
Currency effects. Every non-USD exchange has embedded currency exposure. INR, EUR, GBP, JPY, and others all moved significantly vs USD from 2000 to 2025. The CAGR figures include these currency movements. Local-currency returns would differ.
Data coverage differences. FMP's historical coverage is deeper for some exchanges (US, UK, Germany) than others (India pre-2003, Korea, Southeast Asia). Earlier data gaps mean some exchanges have fewer observations and higher uncertainty in the metrics.
Survivorship and delisting. FMP includes delisted companies in some periods but may not be complete for all exchanges. This could slightly inflate returns by missing the worst outcomes for companies that were removed from exchanges.
Takeaway
12-month price momentum works in most markets. 8 of 17 comparable exchanges outperform SPY, with Italy right at parity. 9 underperform. But the premium is not uniform. Geography and market structure determine whether the signal translates into investable alpha.
The US is among the worst-performing developed markets in this study by risk-adjusted return. The most studied, most systematically traded factor market has competed away most of the excess return and retained the crash risk. India (NSE) is the strongest performer at 17.33% CAGR, a less crowded market with genuine domestic growth cycles where momentum captures real economic trends.
Germany's risk-adjusted profile (Sharpe 0.588) is the best in the study and often overlooked. South Africa delivers 9.34% CAGR with just 36.7% down capture vs its local benchmark. These markets represent the clearest case for adding international momentum exposure to a portfolio that already has US equity coverage.
Data: Ceta Research (FMP financial data warehouse), 2000–2025. Universe: 18 global exchanges, exchange-specific market cap thresholds (point-in-time, 45-day lag). Full methodology: METHODOLOGY.md. Past performance does not guarantee future results. This is educational content, not investment advice.
References
- Jegadeesh, N. & Titman, S. (1993). Returns to Buying Winners and Selling Losers. Journal of Finance, 48(1), 65-91.
- Asness, C., Moskowitz, T. & Pedersen, L. (2013). Value and Momentum Everywhere. Journal of Finance.
- Daniel, K. & Moskowitz, T. (2016). Momentum Crashes. Journal of Financial Economics.
- Hong, H. & Stein, J. (1999). A Unified Theory of Underreaction, Momentum Trading, and Overreaction in Asset Markets. Journal of Finance.
Run This Screen Yourself
Global 12-month momentum screen across all exchanges:


