
NCAV in Japan: Where Balance Sheets Still Set the Floor
We ran the NCAV screen on Japan from 2007 to 2024. CAGR of 8.85% matched SPY with lower drawdown (-33.7% vs -40.3%) and a Sortino of 1.167. Japan's cash-heavy balance sheets make NCAV a better predictor of liquidation value than in any other developed market.

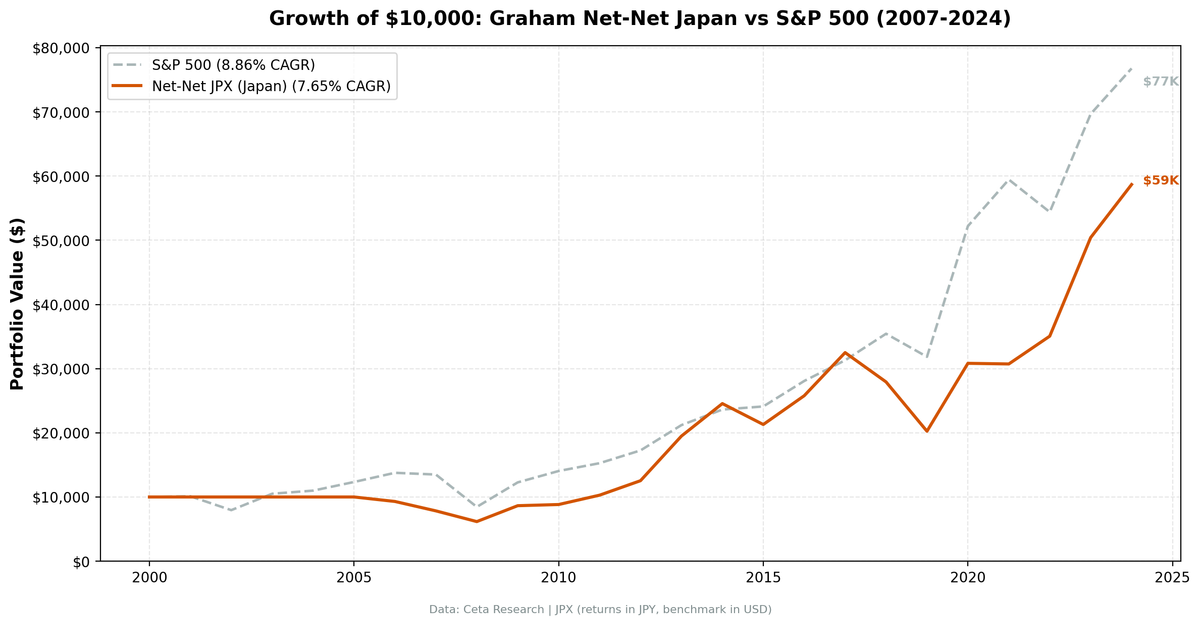
We ran the NCAV screen on Japan's JPX exchange from 2001 to 2024. The strategy returned 7.70% CAGR vs the Nikkei's 4.32%, delivering +3.37% excess return with a max drawdown of -39.9% vs -49.7% for the benchmark. The Sharpe ratio of 0.345 more than doubled the Nikkei's 0.159. Down capture was 41.4%, meaning the strategy absorbed less than half of market declines.
Contents
- Part of a Series
- Why Japan's Balance Sheets Are Different
- Method
- Results
- Year-by-Year Returns
- Why Japan's Down Capture Is So Low
- Limitations
- Takeaway
Japan is the one developed market where buying stocks below their net current asset value produces significant alpha. The reason comes down to balance sheet structure.
Data: FMP financial data warehouse, 2000–2025. Updated April 2026.
Part of a Series
This post focuses on the balance sheet mechanics of NCAV as applied to Japanese stocks. For the US analysis and a full explanation of how NCAV is computed from current assets and total liabilities, see NCAV: What the Balance Sheet Actually Tells You About Liquidation Value.
Why Japan's Balance Sheets Are Different
NCAV = Total Current Assets - Total Liabilities.
The formula is the same everywhere. The difference is what sits inside "total current assets" on Japanese balance sheets.
Japanese companies have historically held enormous cash positions relative to their market caps. This isn't a bug in corporate strategy. It reflects decades of deflationary expectations, a banking crisis in the 1990s that made companies distrust external financing, and a corporate culture that prioritized stability over capital return.
The result: when a Japanese company qualifies as a net-net, its current assets are disproportionately cash and short-term investments. These are the highest-quality current assets on the NCAV hierarchy. Cash recovers at 100% in liquidation. Receivables at 60-90%. Inventory at 30-70%.
Compare that to the US, where net-net stocks tend to be distressed retailers with inventory-heavy balance sheets or energy companies with commodity-linked receivables. Same NCAV formula, very different asset quality underneath.
Method
Data source: Ceta Research (FMP financial data warehouse) Universe: JPX (Japan Exchange Group), market cap > ¥5B (~$33M USD) Period: 2001-2024 (5 cash years 2001-2005, 19 active years 2006-2024) Rebalancing: Annual (April), equal weight Signal: Price < NCAV per share Benchmark: Nikkei 225 ETF (JPY-denominated) Cash rule: Hold cash if fewer than 5 qualify Costs: Size-tiered transaction cost model
The ¥5B market cap floor is necessary because Japanese net-nets are smaller companies. Using the standard US threshold of $1B would eliminate virtually all candidates.
The 5 cash years from 2001-2005 reflect data coverage. FMP's Japanese financial data starts populating reliably from 2006. Japan had hundreds of net-nets during those early years, but the warehouse didn't have sufficient symbol coverage to run the backtest.
Results
| Metric | NCAV Japan | Nikkei 225 |
|---|---|---|
| CAGR | 7.70% | 4.32% |
| Total Return (24 yr) | 493% | 176% |
| Max Drawdown | -39.9% | -49.7% |
| Annualized Volatility | 22.0% | 26.5% |
| Sharpe Ratio | 0.345 | 0.159 |
| Sortino Ratio | 0.869 | 0.347 |
| Calmar Ratio | 0.193 | 0.087 |
| Down Capture | 41.4% | 100% |
| Up Capture | 88.7% | 100% |
| Alpha | +5.1% | -- |
| Beta | 0.591 | 1.00 |
| Avg Stocks per Active Year | 27.2 | -- |
| Cash Periods | 5 of 24 | -- |

The excess CAGR of +3.37% is consistent alpha over 24 years. The Sharpe ratio of 0.345 more than doubles the Nikkei's 0.159, reflecting both higher returns and lower volatility.
Down capture of 41.4% confirms this: when the Nikkei fell, Japan NCAV stocks fell by less than half on average. The beta of 0.591 shows these small-cap balance-sheet stocks move independently of the large-cap Nikkei index.
Year-by-Year Returns
| Year | NCAV Japan | Nikkei 225 | Excess |
|---|---|---|---|
| 2001 | 0.0% (cash) | -14.0% | +14.0% |
| 2002 | 0.0% (cash) | -27.4% | +27.4% |
| 2003 | 0.0% (cash) | +46.4% | -46.4% |
| 2004 | 0.0% (cash) | -1.3% | +1.3% |
| 2005 | 0.0% (cash) | +48.6% | -48.6% |
| 2006 | -6.5% | -1.8% | -4.8% |
| 2007 | -17.9% | -22.6% | +4.7% |
| 2008 | -21.7% | -33.9% | +12.2% |
| 2009 | +41.1% | +29.4% | +11.6% |
| 2010 | +1.5% | -13.9% | +15.4% |
| 2011 | +18.9% | +4.0% | +14.9% |
| 2012 | +22.7% | +18.7% | +4.0% |
| 2013 | +44.8% | +24.5% | +20.3% |
| 2014 | +27.2% | +29.2% | -2.1% |
| 2015 | -10.8% | -16.5% | +5.7% |
| 2016 | +19.6% | +17.7% | +1.9% |
| 2017 | +31.0% | +12.7% | +18.4% |
| 2018 | -13.9% | +0.6% | -14.4% |
| 2019 | -25.9% | -17.1% | -8.8% |
| 2020 | +53.7% | +67.5% | -13.8% |
| 2021 | +0.8% | -7.1% | +7.9% |
| 2022 | +17.9% | +1.6% | +16.2% |
| 2023 | +40.6% | +41.3% | -0.8% |
| 2024 | +11.9% | -10.3% | +22.2% |
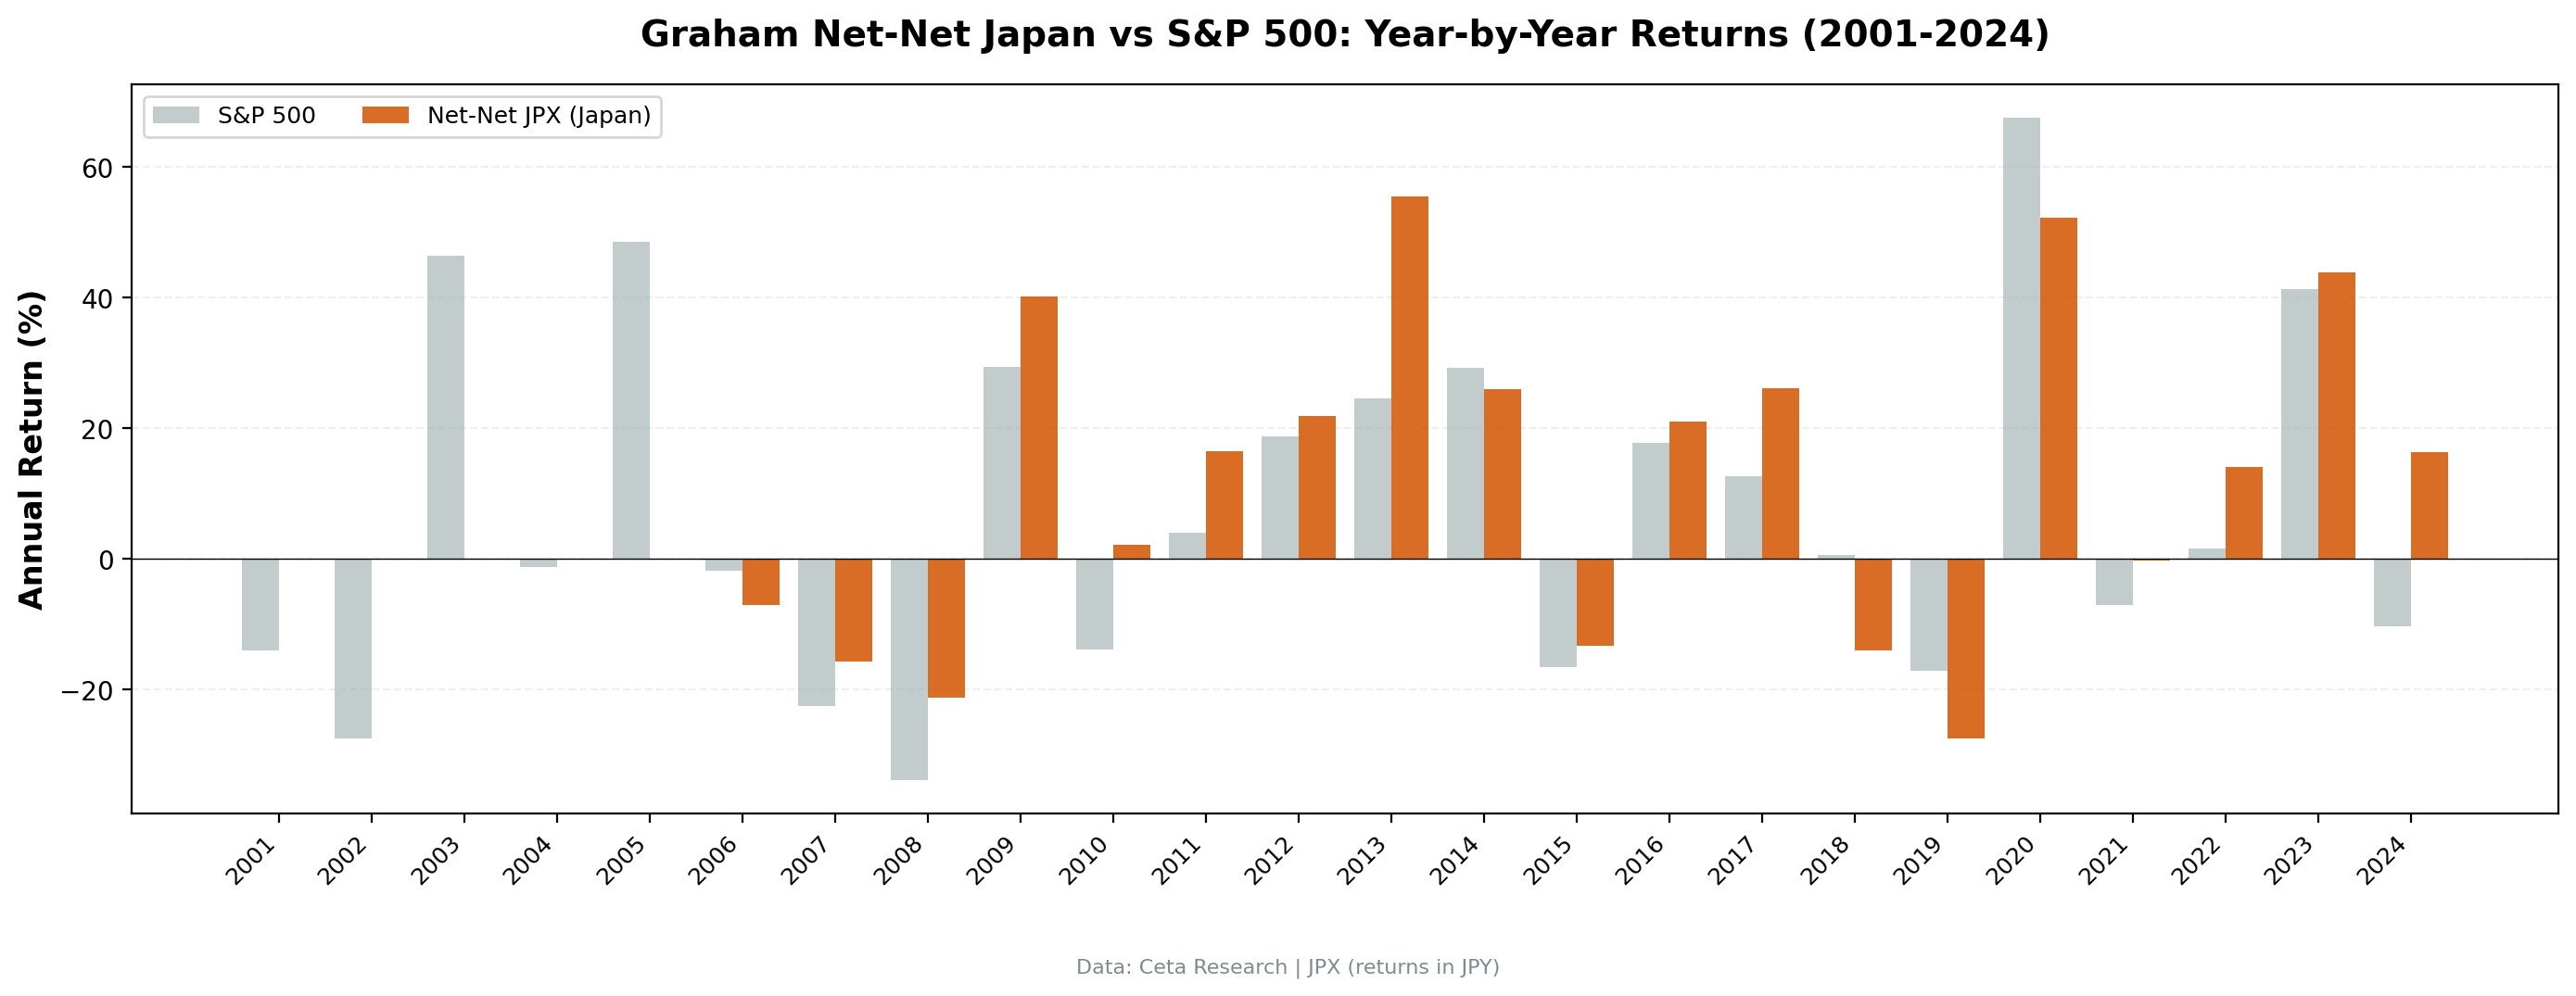
Two periods stand out.
2011-2014: The governance reform era. Abenomics pushed Japanese companies to improve capital efficiency and return cash. Net-net stocks were direct beneficiaries. The four-year run produced +18.9%, +22.7%, +44.8%, +27.2%. When companies started unwinding excess cash positions, the NCAV gap closed, and shareholders got paid.
2022-2024: The TSE reform push. Tokyo Stock Exchange issued explicit guidance requiring listed companies to address price-to-book ratios below 1.0. This is governance pressure applied directly to the balance sheet metric that creates net-nets. Returns of +17.9%, +40.6%, +11.9% followed.
The balance sheet floor holds because there's a credible catalyst for resolution. In Japan, that catalyst is regulatory pressure on corporate governance.
Why Japan's Down Capture Is So Low
Down capture of 41.4% means that in years when the Nikkei 225 declined, Japan NCAV stocks declined by less than half. Three reasons:
Small-cap vs large-cap divergence. The Nikkei 225 is a large-cap index. NCAV stocks are small caps trading below liquidation value. They move independently during market stress.
Cash-heavy balance sheets absorb shocks. When a company holds more cash than its market cap, a market selloff doesn't destroy its liquidation floor. The balance sheet provides a real anchor.
Small-cap domestic orientation. Japanese net-net stocks tend to be domestic businesses (regional retailers, manufacturers, service companies) with little exposure to global macro shocks. They fell less during the 2008 crisis and the 2020 selloff than globally-connected companies.
Limitations
Data coverage before 2006. The 5 cash years (2001-2005) bias the 24-year CAGR. Over the 19 active years (2006-2024), the invested CAGR is higher than the headline 7.70% because cash years contribute zero return.
Benchmark mismatch. The Nikkei 225 is a large-cap index. NCAV stocks are small-cap value. A more appropriate comparison would be against a JPX small-cap index, but data availability is limited.
Governance reforms may reduce the opportunity set. TSE's 2022-2024 reforms are explicitly pushing companies to trade above book value. If reforms succeed, fewer net-nets will exist. The strategy's supply of candidates could shrink.
Liquidity in Japanese small caps. Average daily volume can be thin for sub-¥10B market cap stocks. Our cost model accounts for this, but real-world slippage on a 30-stock portfolio could be meaningful.
Takeaway
NCAV works better in Japan than anywhere else we've tested. The reason maps directly to balance sheet composition: Japanese net-nets have current assets dominated by cash, while US net-nets have current assets dominated by inventory and receivables. Same formula, different inputs, different outcomes.
The +3.37% CAGR excess return vs the Nikkei, combined with lower drawdown (-39.9% vs -49.7%) and better Sharpe ratio (0.345 vs 0.159), demonstrates that NCAV works as a strategy in Japan. The ongoing governance reforms are both an opportunity (existing net-nets resolving) and a risk (fewer new net-nets forming).
For the US analysis and a detailed breakdown of how NCAV is computed from balance sheet line items, see the US post.
Data: FMP financial data warehouse via Ceta Research. JPX, annual rebalance April, equal weight, 2001-2024 (19 active years from 2006). Backtest code: github.com/ceta-research/backtests
Past performance does not guarantee future results. This is educational content, not investment advice.


