
NCAV: What the Balance Sheet Actually Tells You About Liquidation Value
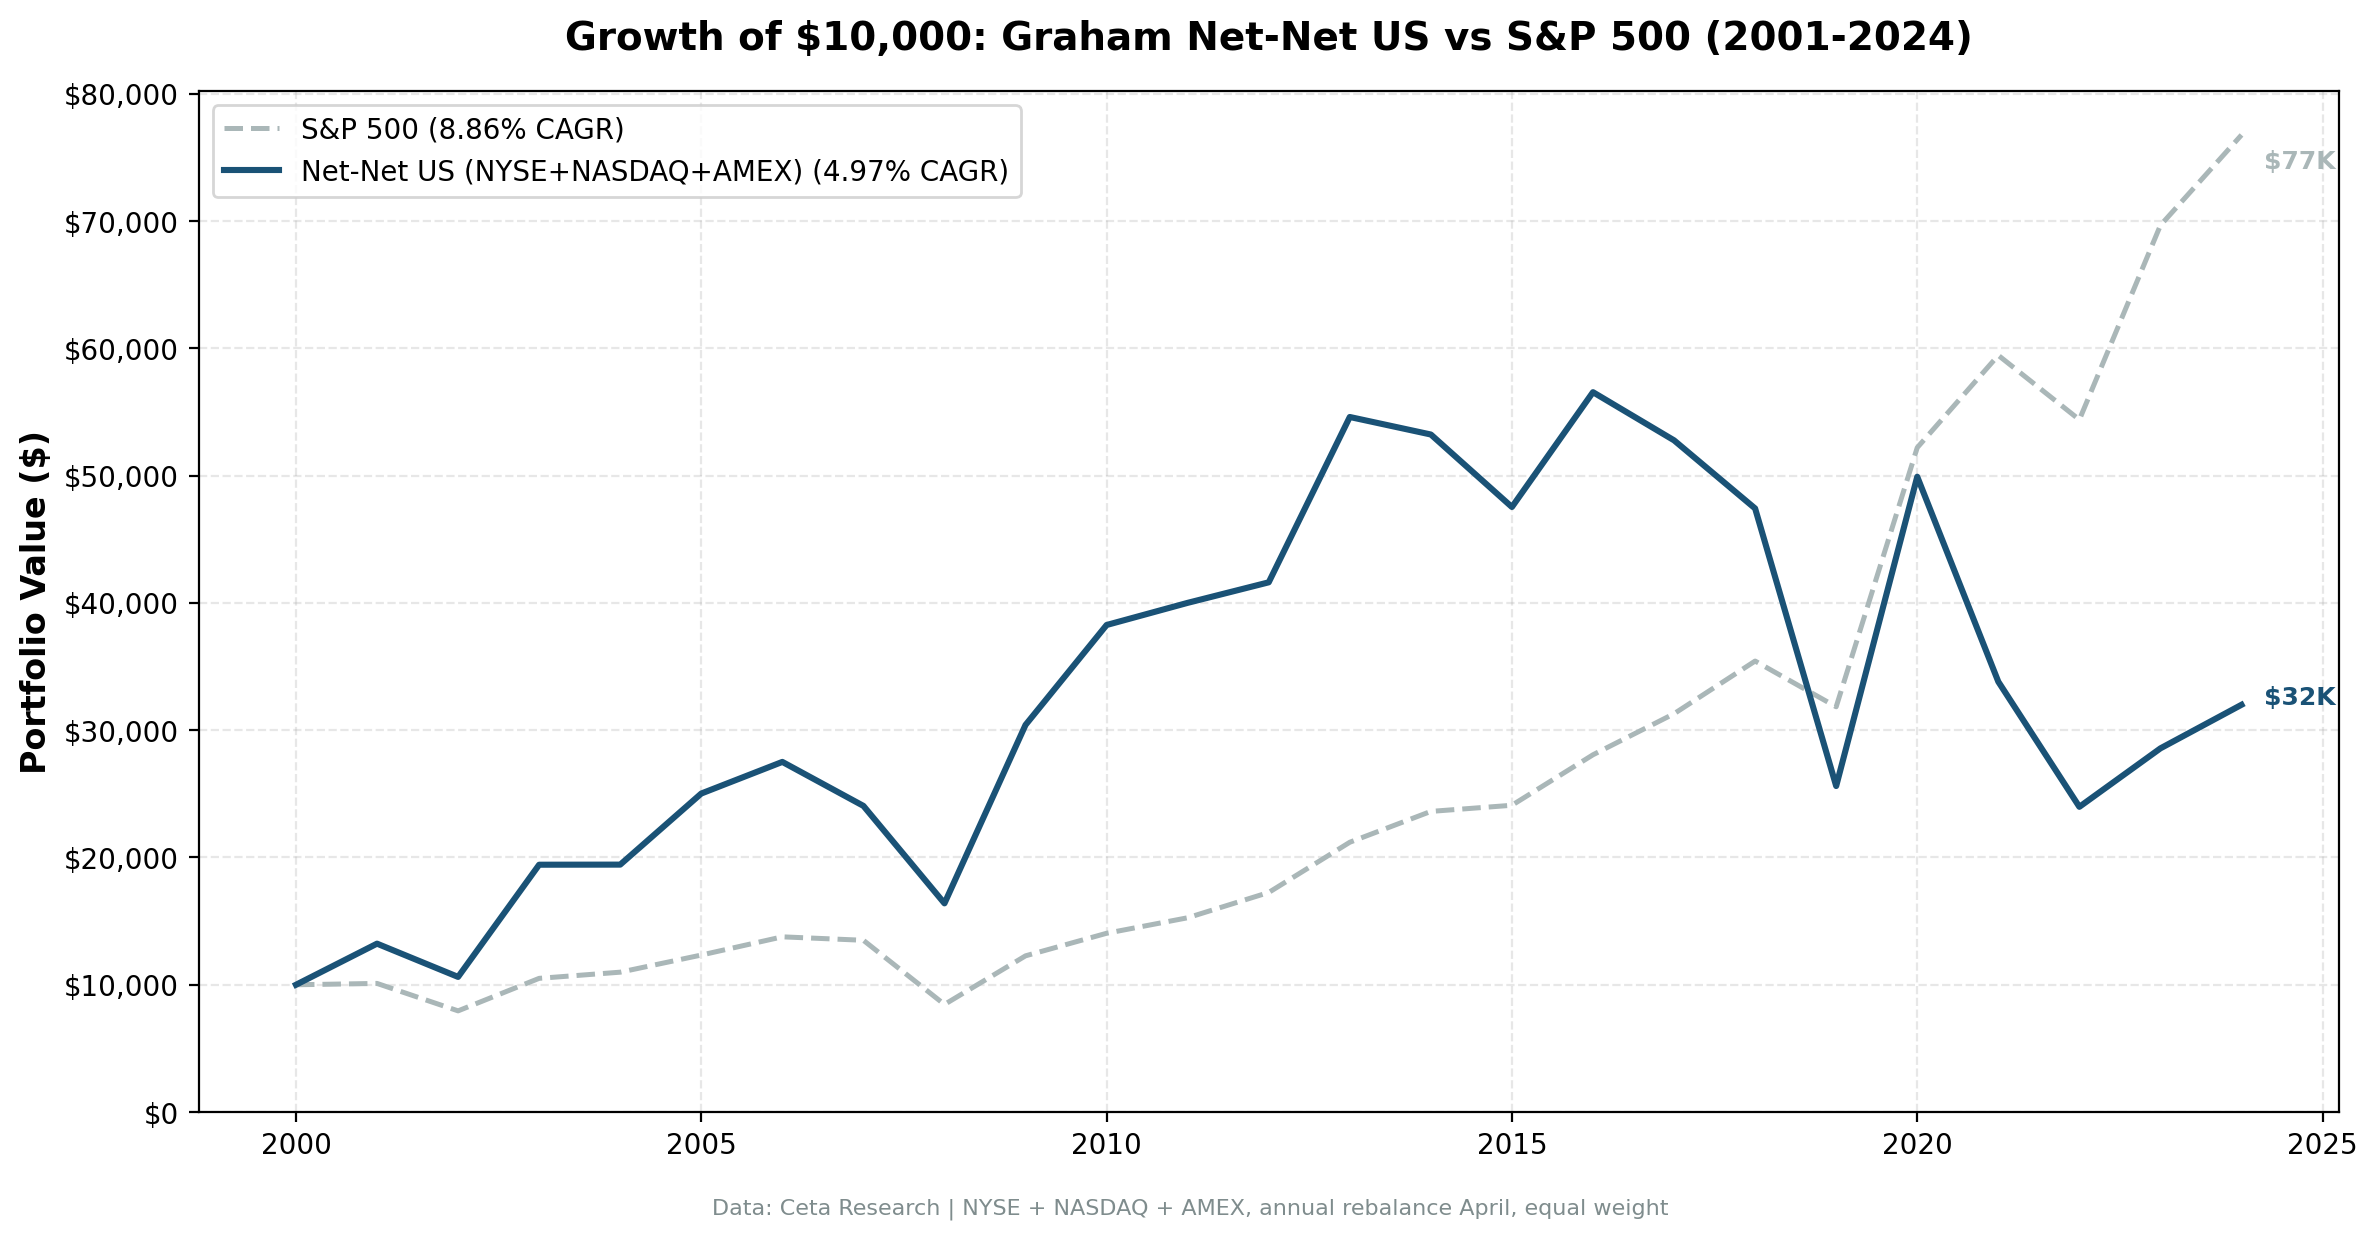
We computed NCAV for every US stock from 2001 to 2024 and bought the ones trading below liquidation value. CAGR was 5.02% vs 8.84% for SPY. The real finding is what NCAV reveals as a balance sheet tool, which current assets matter, and why the formula uses them instead of total assets.

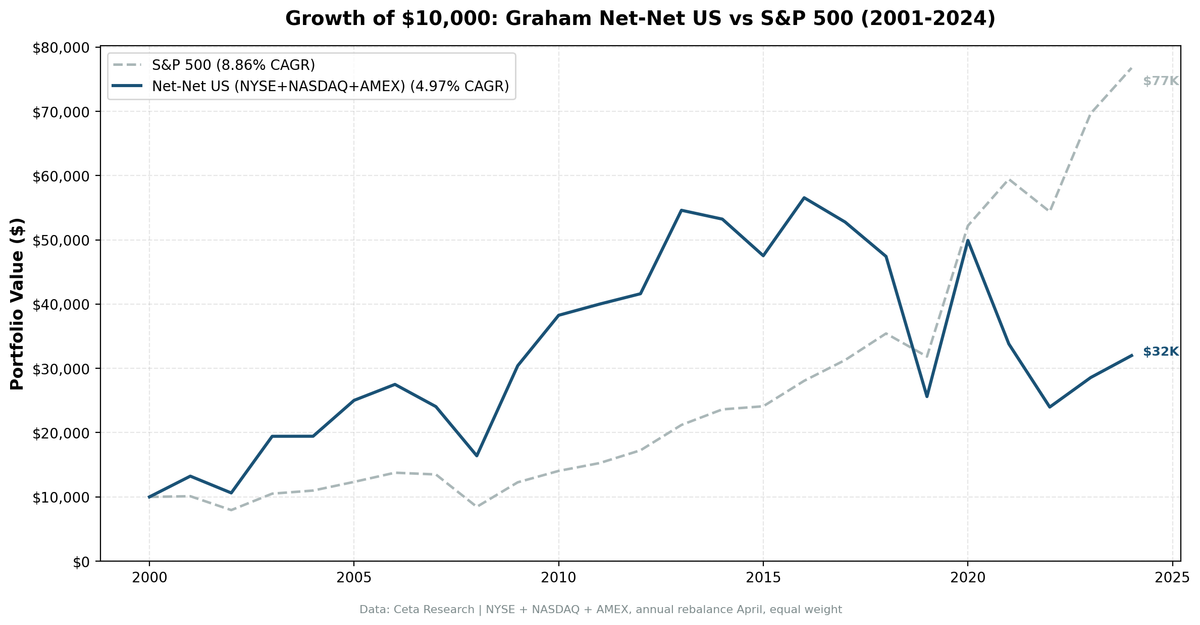
We computed Net Current Asset Value (NCAV) for every US stock from 2001 to 2024, then bought the ones trading below it. The CAGR was 5.62% vs 8.86% for the S&P 500. The strategy underperformed, but the real finding is about what NCAV reveals as a balance sheet analysis tool: which companies have a liquidation floor built into their financial statements, and why current assets matter more than total assets for that calculation.
Contents
- What NCAV Measures
- How FMP Computes It
- Method
- Results
- Year-by-Year Returns
- When It Works: The Crash-Recovery Pattern
- When It Struggles: Post-2014 Collapse
- The Balance Sheet Decomposition
- Run the Screen Yourself
- Limitations
- Takeaway
Data: FMP financial data warehouse, 2000–2025. Updated March 2026.
What NCAV Measures
NCAV strips a balance sheet down to one question: if this company stopped operating tomorrow and sold off only its most liquid assets, could it cover all its obligations and still have value left over?
The formula:
NCAV = Total Current Assets - Total Liabilities
Not total assets. Current assets only. That's the key design choice. Here's why it matters.
Total assets include property, equipment, goodwill, patents, long-term investments. These are hard to sell quickly. A factory might be worth $200M on the books but fetch $40M in a forced sale. Goodwill is worth nothing in liquidation. Long-term receivables might take years to collect.
Current assets are different. They're expected to convert to cash within 12 months under normal operations:
| Current Asset | Liquidation Recovery | Why |
|---|---|---|
| Cash & equivalents | ~100% | Already liquid |
| Short-term investments | 90-100% | Marketable securities |
| Accounts receivable | 60-90% | Some customers won't pay, especially if the company is closing |
| Inventory | 30-70% | Depends on type: finished goods recover more than raw materials or work-in-progress |
| Prepaid expenses | 0-20% | Usually non-recoverable |
The formula subtracts total liabilities (not just current liabilities) from current assets. This is deliberately conservative. Even if a company's long-term debt isn't due for five years, NCAV assumes you'd need to settle it from liquid assets. The result is an estimate of what shareholders would get back in a worst-case liquidation where only short-term assets are sold.
When a stock trades below its NCAV per share, the market is pricing the company's equity at less than this conservative liquidation estimate. That's the signal.
How FMP Computes It
The grahamNetNet field in FMP's key_metrics table gives NCAV per share. The underlying calculation uses totalCurrentAssets and totalLiabilities from the balance sheet, minus any preferred stock.
In our backtest, the signal is: stock price < NCAV per share. If the closing price is below the per-share liquidation floor, the stock qualifies.
Method
Data source: Ceta Research (FMP financial data warehouse) Universe: NYSE + NASDAQ + AMEX, market cap > $50M USD Period: 2001-2024 (24 years) Rebalancing: Annual (April), after December fiscal year filings + 45-day lag Signal: adjClose < grahamNetNet (price below NCAV per share) Portfolio: Equal weight, max 30 stocks, hold cash if fewer than 5 qualify Costs: Size-tiered transaction cost model (0.5%+ for micro-caps) Filters: Entry price > $0.50, max single-year return capped at 300%
The $50M market cap floor is much lower than we use for most strategies (typically $1B+). Net-net stocks are almost exclusively micro-caps. A higher threshold would eliminate most candidates.
Results
| Metric | NCAV Strategy | S&P 500 |
|---|---|---|
| CAGR | 5.62% | 8.86% |
| Total Return (24 yr) | 272% | 668% |
| Max Drawdown | -57.4% | -38.6% |
| Annualized Volatility | 39.2% | 20.3% |
| Sharpe Ratio | 0.092 | 0.337 |
| Sortino Ratio | 0.217 | 0.691 |
| Calmar Ratio | 0.098 | 0.230 |
| Alpha | -7.42% | -- |
| Beta | 1.61 | 1.00 |
| Avg Stocks per Year | 28.6 | -- |
| Cash Periods | 0 of 24 | -- |
| Win Rate | 45.8% | -- |
The strategy trailed by 3.24 percentage points per year. Volatility was nearly double. The beta of 1.61 means the portfolio moved 60% more than the market on average, and the down capture of 182.8% confirms it: when the S&P fell, NCAV stocks fell harder.
Zero cash periods tells us there were always enough qualifying stocks. The underperformance isn't from lack of candidates. It's a genuine strategy result.
Year-by-Year Returns
| Year | NCAV | SPY | Excess |
|---|---|---|---|
| 2001 | +27.8% | +1.1% | +26.7% |
| 2002 | -16.2% | -21.3% | +5.1% |
| 2003 | +97.5% | +32.1% | +65.3% |
| 2004 | +3.1% | +4.6% | -1.5% |
| 2005 | +32.9% | +12.2% | +20.7% |
| 2006 | +8.4% | +11.6% | -3.2% |
| 2007 | -16.3% | -2.0% | -14.3% |
| 2008 | -37.9% | -37.4% | -0.5% |
| 2009 | +91.8% | +45.2% | +46.6% |
| 2010 | +18.8% | +14.4% | +4.4% |
| 2011 | -1.4% | +8.7% | -10.1% |
| 2012 | +13.2% | +13.0% | +0.2% |
| 2013 | +36.5% | +22.9% | +13.6% |
| 2014 | -6.8% | +11.4% | -18.3% |
| 2015 | -13.3% | +2.0% | -15.4% |
| 2016 | +24.3% | +16.5% | +7.8% |
| 2017 | -8.2% | +11.5% | -19.7% |
| 2018 | -6.5% | +13.2% | -19.8% |
| 2019 | -50.4% | -10.1% | -40.3% |
| 2020 | +100.4% | +63.9% | +36.4% |
| 2021 | -19.9% | +13.9% | -33.8% |
| 2022 | -24.2% | -8.5% | -15.7% |
| 2023 | +9.8% | +28.1% | -18.3% |
| 2024 | +14.9% | +10.2% | +4.7% |
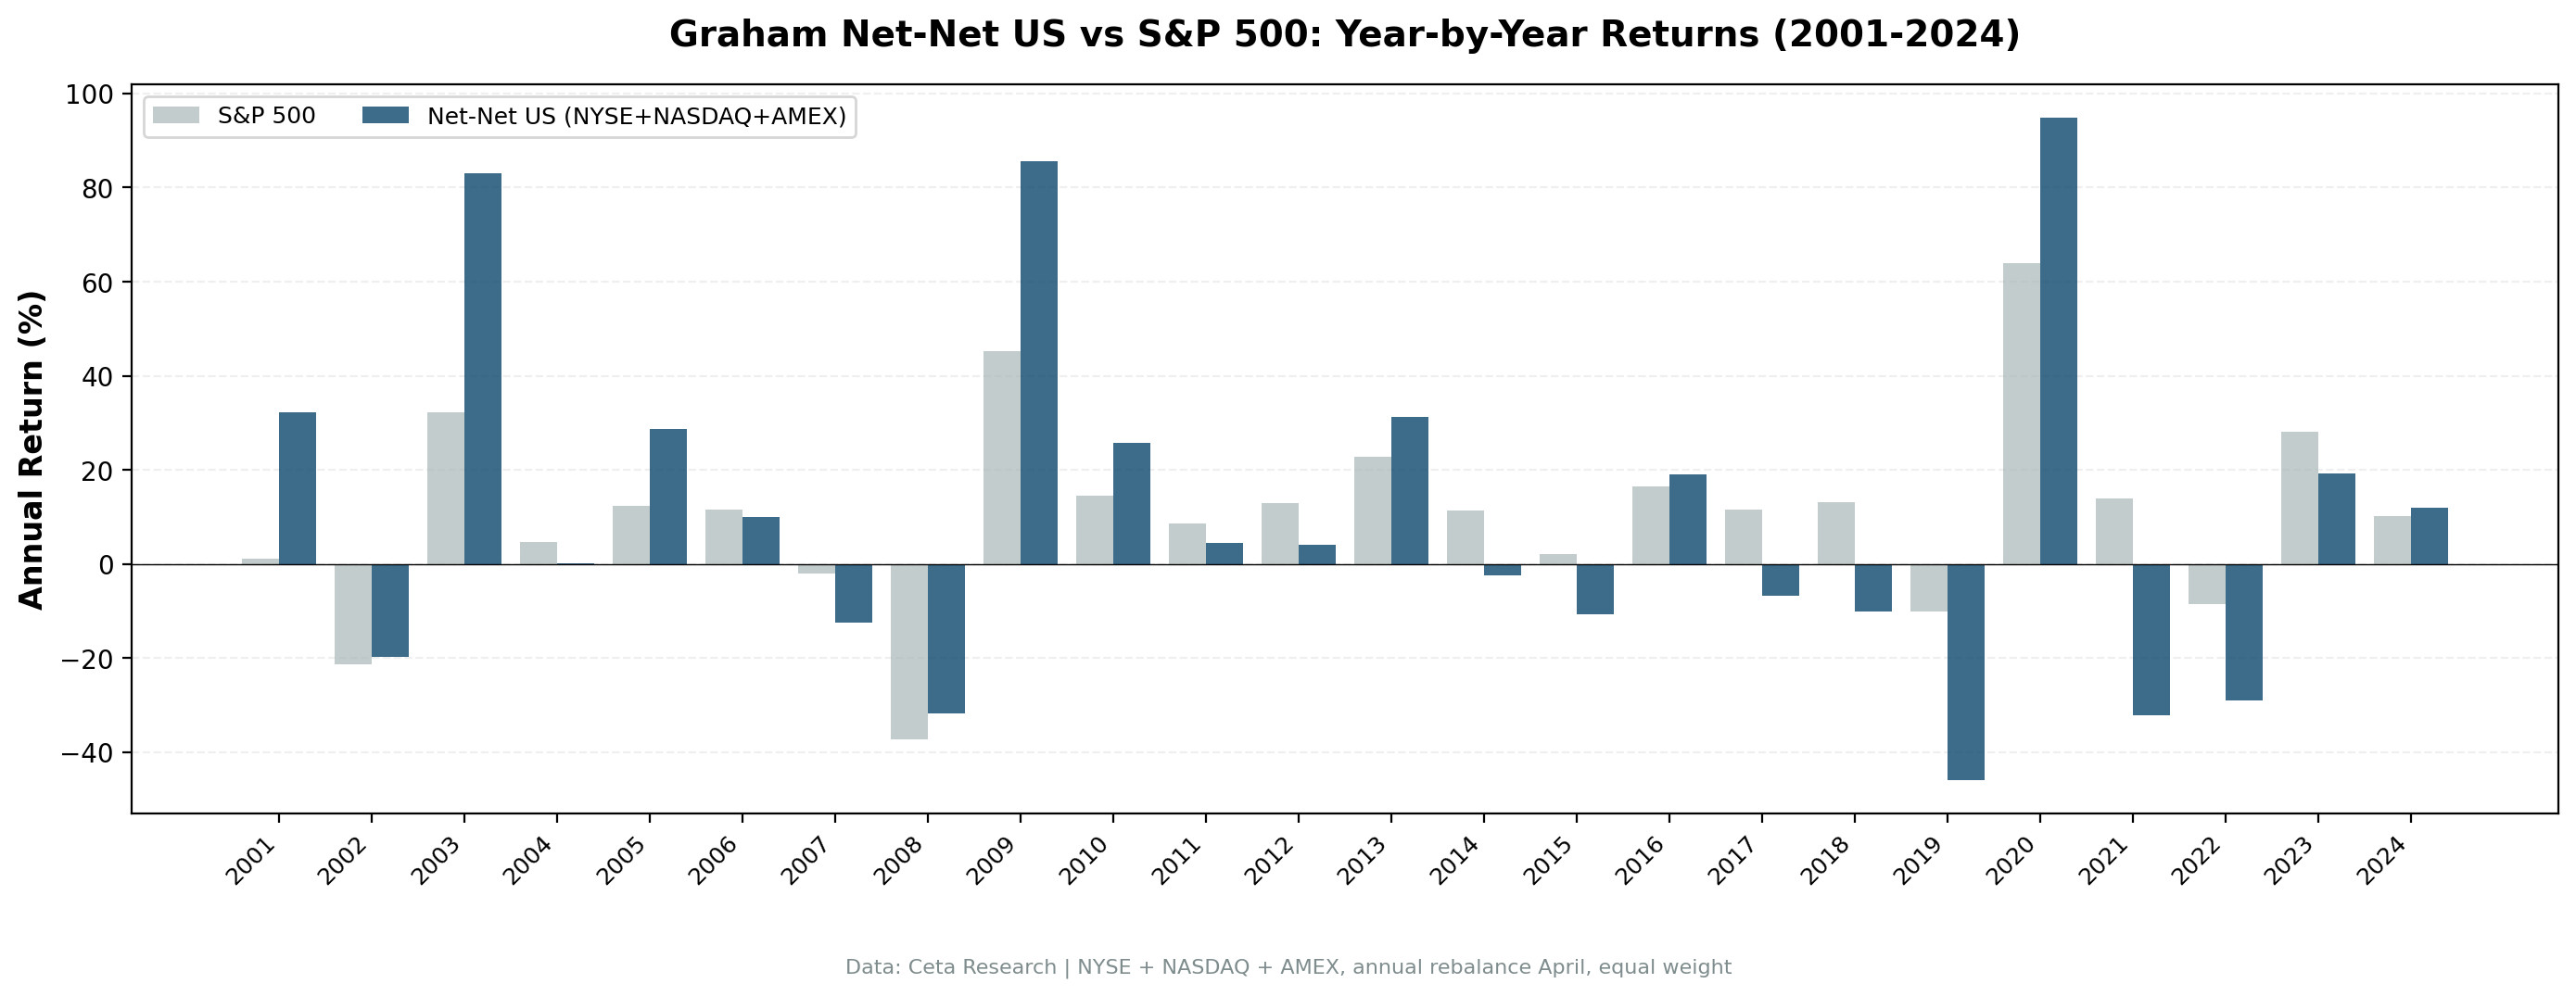
When It Works: The Crash-Recovery Pattern
The strategy's best years all share one trait: they follow a market crash.
2001-2003: Dot-com bust. Net-net stocks returned +30.8%, then +82.4% in the recovery. These were companies whose stock prices had been beaten down below liquidation value during the panic. When the market stabilized, prices snapped back toward asset values.
2009: Financial crisis recovery. +97.3% vs +48.2% for SPY. Balance sheets that were intact through the crisis became the floor. Companies with real cash and receivables on their books recovered faster than the market expected.
2020: COVID recovery. +103.8%. Same pattern. Stocks that were priced for bankruptcy but had solid current assets bounced hard.
The logic tracks. NCAV is a liquidation floor. In a panic, the market prices many stocks below that floor. When the panic ends, the gap closes. This is the balance sheet acting as a price anchor.
When It Struggles: Post-2014 Collapse
The second half of the backtest is painful. From 2014 to 2024, the NCAV strategy averaged roughly -7% excess return per year. It lost money in absolute terms in 6 of those 11 years.
Three forces explain this:
Current asset quality degradation. The companies qualifying as net-nets in 2014+ are different from the ones in 2003. Many of the later names are retail chains with inventory that depreciates fast, or energy companies with receivables tied to volatile commodity prices. The balance sheet says "current assets > total liabilities" but the real liquidation value of those current assets is lower than the book number.
Too few stocks for proper diversification. With 28.5 stocks on average and a $50M market cap floor, the portfolio is concentrated in a thin slice of the market. A few bad picks dominate. In 2019, the portfolio lost 45.7% because several holdings were distressed micro-caps that collapsed before the broader COVID selloff even started.
Market efficiency in micro-caps improved. More screeners, more data access, more quantitative funds scanning the same space. The pricing gap that NCAV exploits closes faster now. By the time an annual rebalance picks up a net-net, the easy money is already made.
The Balance Sheet Decomposition
To understand why some NCAV stocks recover and others don't, look at the composition of current assets.
A company with NCAV driven primarily by cash is a better bet than one whose NCAV comes from inventory. Consider two hypothetical net-net stocks:
Company A: $100M current assets = $80M cash + $15M receivables + $5M inventory. Total liabilities = $60M. NCAV = $40M. This company can literally write a check to cover its debts and return the rest.
Company B: $100M current assets = $5M cash + $25M receivables + $70M inventory. Total liabilities = $60M. NCAV = $40M. Same NCAV, but the actual liquidation recovery is far lower. Inventory might sell at 40 cents on the dollar. Receivables from a distressed company's customers might come in at 70 cents.
The NCAV formula treats both equally. The market doesn't. Company B's stock might trade below NCAV for good reason.
Run the Screen Yourself
SELECT b.symbol,
  ROUND((b.totalCurrentAssets - b.totalLiabilities) / 1e6, 1) AS ncav_m,
  ROUND(k.marketCapTTM / 1e6, 1) AS mktcap_m,
  ROUND(k.marketCapTTM / NULLIF(b.totalCurrentAssets - b.totalLiabilities, 0), 2) AS price_to_ncav
FROM balance_sheet_annual b
JOIN key_metrics_ttm k ON b.symbol = k.symbol
WHERE (b.totalCurrentAssets - b.totalLiabilities) > 0
  AND k.marketCapTTM < (b.totalCurrentAssets - b.totalLiabilities)
  AND k.marketCapTTM > 50000000
ORDER BY price_to_ncav ASC
LIMIT 50
Try this screen on Ceta Research
This query computes NCAV directly from balance sheet line items rather than using the pre-computed grahamNetNet field. It lets you see the dollar amounts: how large is the NCAV, how does it compare to market cap, and what's the discount.
Limitations
Current asset quality isn't captured. NCAV treats all current assets the same. A dollar of cash and a dollar of slow-moving inventory get equal weight. In practice, the liquidation value of inventory varies enormously by industry.
Annual rebalance misses resolution events. Some net-nets resolve quickly (buyout, cash return to shareholders). An annual rebalance in April might miss a stock that qualified in June and was bought out by October. More frequent rebalancing could capture these, but increases transaction costs in illiquid micro-caps.
Survivorship bias in exchange membership. Our universe uses current exchange listings. Companies that were fully delisted and removed from the database before our data period aren't included. This can bias results in either direction.
Transaction costs in micro-caps are high. We apply a size-tiered cost model, but real-world execution in stocks under $100M market cap involves wide bid-ask spreads, thin order books, and market impact. Actual returns would likely be lower.
The strategy needs crashes to generate alpha. The best years (2001, 2003, 2009, 2020) all follow major selloffs. In the steady bull market of 2014-2024, the strategy consistently lagged. If you believe crashes will keep happening (they will), the strategy has an occasional payoff. If you need steady compounding, this isn't it.
Takeaway
NCAV is more useful as a balance sheet analysis framework than as a standalone trading signal. The formula itself, subtracting total liabilities from current assets only, is a clean way to estimate a conservative liquidation floor. It forces you to think about which assets actually convert to cash and which don't.
As a systematic strategy on US stocks, the evidence from 24 years is clear: 5.62% CAGR vs 8.86% for the benchmark. The crash-recovery pattern is real but not frequent enough to overcome the drag in normal markets. The approach shows stronger results in Japan and Taiwan, where structural factors create a deeper pool of net-net candidates with higher-quality balance sheets.
Data: FMP financial data warehouse via Ceta Research. NYSE + NASDAQ + AMEX, annual rebalance April, equal weight, max 30 stocks, 2001-2024. Full methodology: METHODOLOGY.md. Backtest code: github.com/ceta-research/backtests
Past performance does not guarantee future results. This is educational content, not investment advice.


