
Net Debt/EBITDA Screen in India: 25 Years, 17.6% CAGR, +6.5% vs Sensex
The same signal that underperforms on the full US market produced 17.62% CAGR on Indian stocks (NSE) over 25 years, +6.50% above the Sensex annually. Here's what the data shows and why.

Net Debt/EBITDA Screen on NSE: 25 Years, 17.6% CAGR, +6.5% vs Sensex
The Net Debt/EBITDA screen that underperforms on the full US market produced 17.62% CAGR on Indian stocks (NSE) over 25 years, 6.50 percentage points above the Sensex annually. We tested it on NSE from 2000 to 2025, with full transaction costs and next-day execution. Here's what the data shows and why the same signal behaves so differently depending on which market you're in.
Contents
- Method
- What We Found
- Year-by-Year
- Why the Signal Works in India
- The Benchmark Context
- Run It Yourself
- Limitations
Data: FMP financial data warehouse, 2000–2025. Updated March 2026.
Method
Signal: Net Debt/EBITDA < 2x and > -5x, ROE > 10%, Market Cap > ₹20B (~$240M USD). Top 30 stocks by lowest ratio, equal weight. Universe: NSE (National Stock Exchange). Full exchange, not index-constrained. NSE only is used to avoid double-counting stocks that list on both NSE and BSE (~38% overlap). Period: 2000-2025 (103 quarterly periods). Rebalancing: Quarterly (January, April, July, October). 45-day filing lag for point-in-time data. Execution: Market-on-close next trading day (signal generated at close, executed at next close). Transaction costs: Size-tiered model applied. Benchmark: BSE Sensex. The correct local-currency benchmark for measuring alpha in Indian equities. Data: Ceta Research (FMP financial data warehouse).
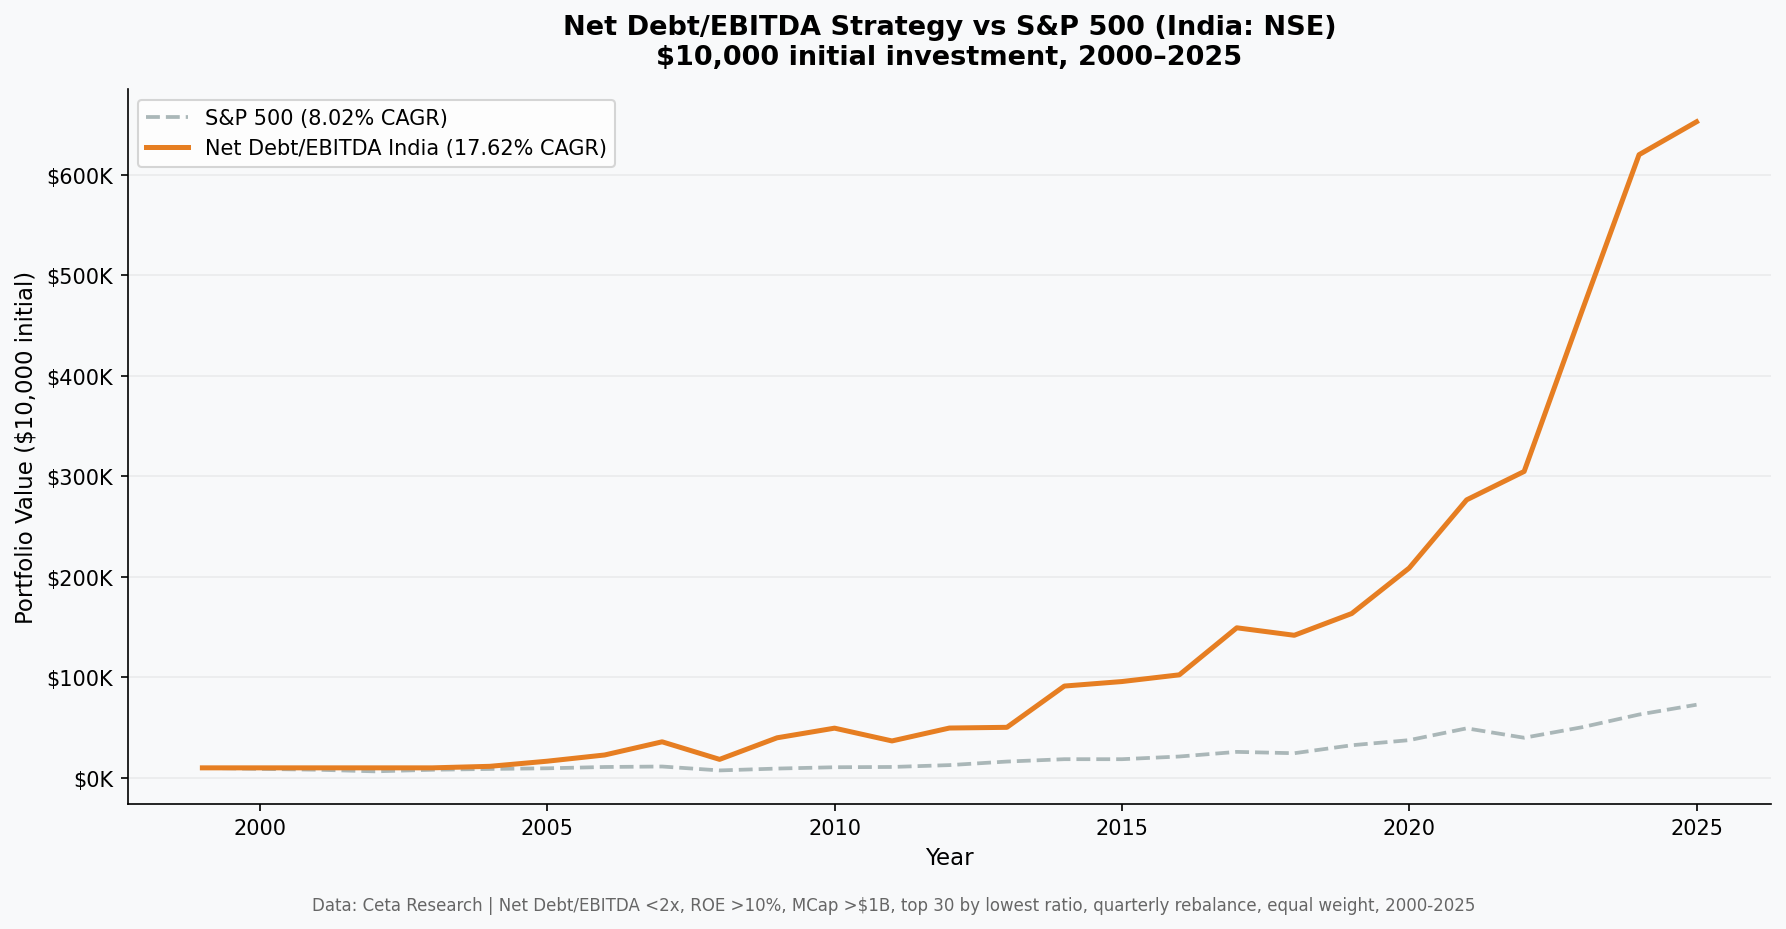
What We Found
Strategy: 17.62% CAGR. Sensex: 11.12% CAGR. Excess return: +6.50% per year over 25 years.
A $10,000 investment grew to $654,068. The same money tracking the Sensex grew to $141,080.
| Metric | Strategy | Sensex |
|---|---|---|
| CAGR | 17.62% | 11.12% |
| Total Return | 6,431% | 1,410.8% |
| Max Drawdown | -50.0% | -51.3% |
| Annualized Volatility | 26.1% | — |
| Sharpe Ratio | 0.426 | — |
| Sortino Ratio | 0.848 | — |
| Beta (vs Sensex) | 0.829 | 1.0 |
| Alpha (annualized) | +7.29% | — |
| Up Capture | 108.6% | — |
| Down Capture | 65.9% | — |
The up/down capture ratio tells the story: the strategy captures 108.6% of the Sensex's gains and only 65.9% of its losses. The portfolio participates more than proportionally in bull markets and meaningfully less in downturns. The max drawdown of -50.0% is slightly better than the Sensex's own -51.3%.

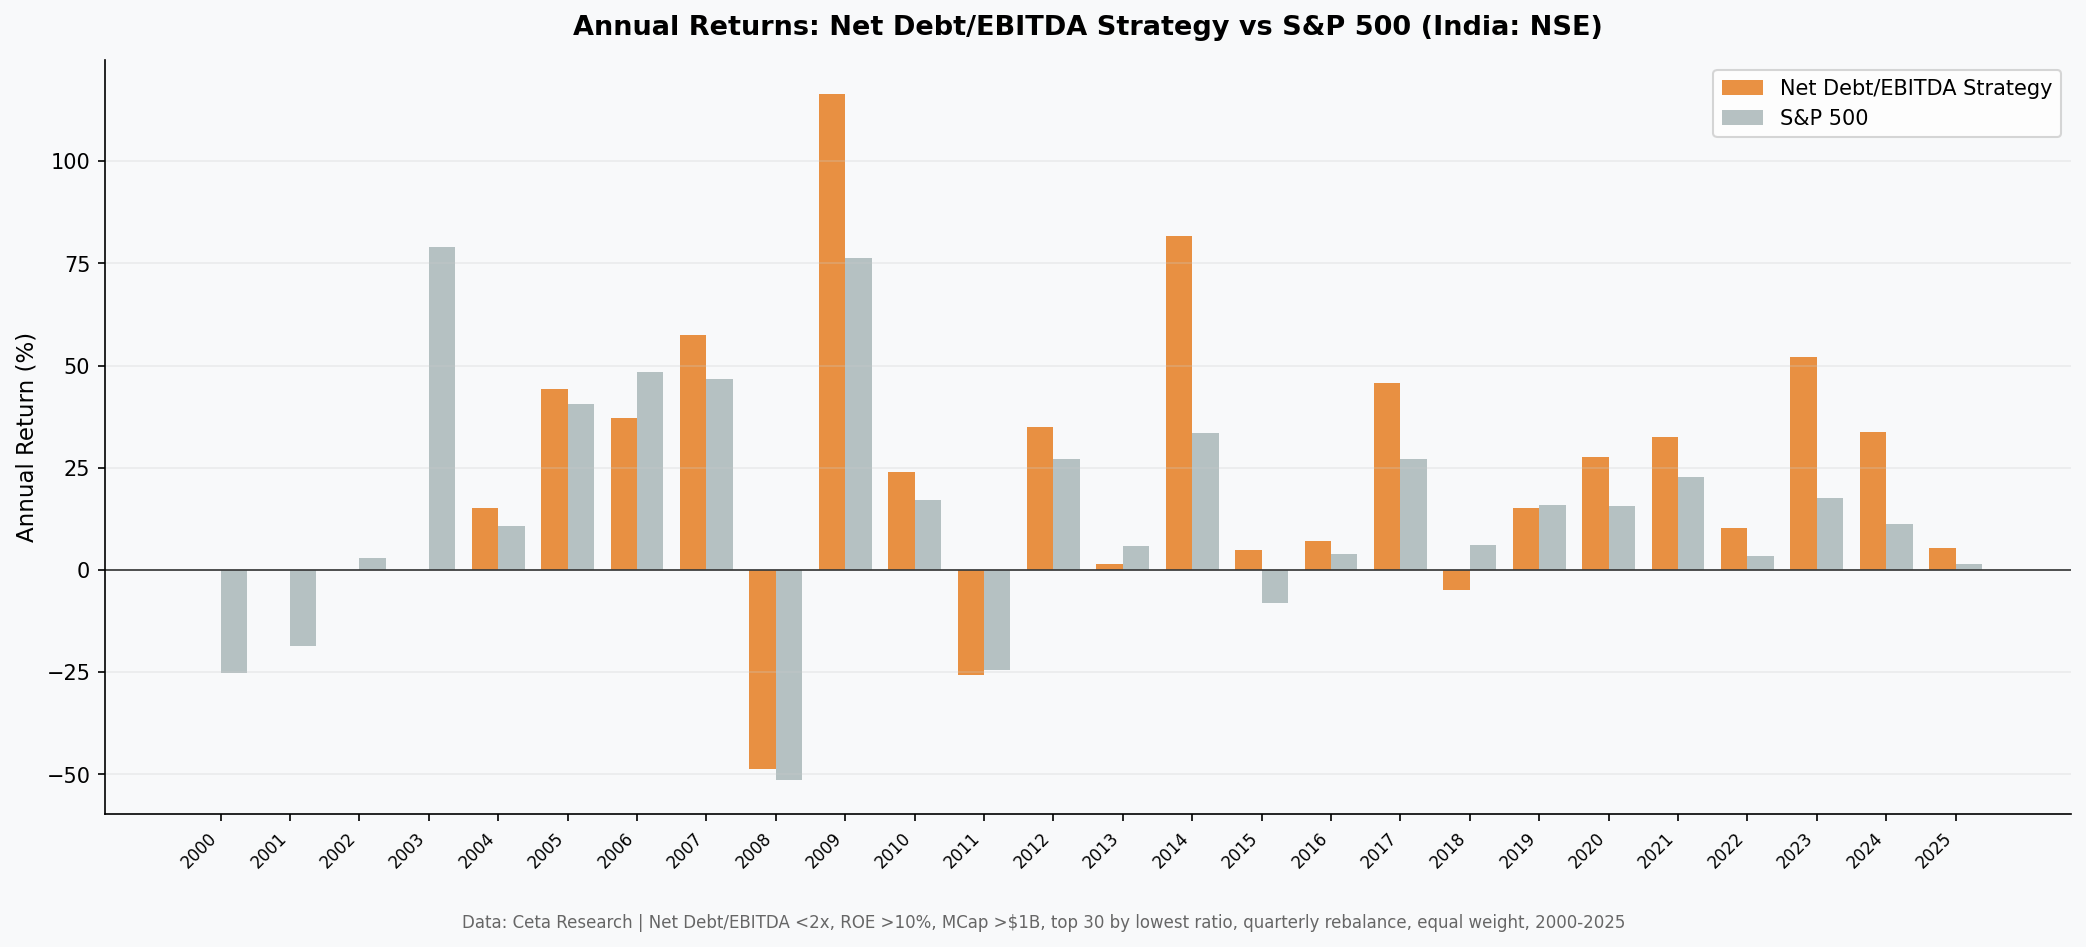
Year-by-Year
The strategy held cash in 17 of 103 quarters (16.5%), concentrated in the early 2000s when the NSE didn't have enough qualifying companies passing the combined leverage, profitability, and market cap filters. The 2000-2003 cash periods hurt the headline CAGR but reflect real data: large-cap, profitable, low-leverage Indian companies were scarce then.
| Year | Strategy | Sensex | Excess |
|---|---|---|---|
| 2000 | 0.0% | -25.2% | +25.2% |
| 2001 | 0.0% | -18.7% | +18.7% |
| 2002 | 0.0% | +2.9% | -2.9% |
| 2003 | 0.0% | +79.1% | -79.1% |
| 2004 | +15.1% | +10.8% | +4.3% |
| 2005 | +44.3% | +40.6% | +3.7% |
| 2006 | +37.2% | +48.5% | -11.2% |
| 2007 | +57.5% | +46.8% | +10.7% |
| 2008 | -48.7% | -51.3% | +2.7% |
| 2009 | +116.4% | +76.3% | +40.1% |
| 2010 | +24.1% | +17.1% | +7.0% |
| 2011 | -25.7% | -24.5% | -1.2% |
| 2012 | +34.9% | +27.0% | +7.9% |
| 2013 | +1.4% | +6.0% | -4.5% |
| 2014 | +81.6% | +33.5% | +48.1% |
| 2015 | +4.9% | -8.1% | +13.0% |
| 2016 | +7.0% | +3.8% | +3.2% |
| 2017 | +45.6% | +27.1% | +18.5% |
| 2018 | -5.0% | +6.1% | -11.1% |
| 2019 | +15.3% | +16.0% | -0.7% |
| 2020 | +27.7% | +15.7% | +11.9% |
| 2021 | +32.5% | +22.8% | +9.6% |
| 2022 | +10.2% | +3.4% | +6.9% |
| 2023 | +52.0% | +17.5% | +34.5% |
| 2024 | +33.8% | +11.2% | +22.6% |
| 2025 | +5.3% | +1.6% | +3.7% |
2003 shows as 0% (cash) because fewer than 10 NSE stocks passed all three filters simultaneously in that quarter. This is significant: the strategy missed the Sensex's 79% year. Without the early cash periods, the CAGR would be higher. This trade-off is real, not a backtest artifact.
2009 stands out: +116.4% vs Sensex's +76.3%. India's equity market snapped back sharply after 2008, and low-leverage companies led that recovery. In 2014, +81.6% vs Sensex +33.5%, coinciding with the Modi election win. Institutional capital flowed into conservative-balance-sheet companies that represented "quality India."
2008: the strategy fell 48.7% vs the Sensex's 51.3%. A modest 2.7% advantage in the worst year confirms that financial conservatism provides some protection but not immunity during a global equity crash.
The recent years (2022-2024) show consistent positive excess: +6.9%, +34.5%, +22.6%. The screen has not deteriorated in the current market environment.
Why the Signal Works in India
1. Credit conditions are tighter in emerging markets.
India has had multiple episodes of credit stress, currency depreciation, and sector-specific leverage crises (IL&FS in 2018, NBFC sector stress in 2019, infrastructure company distress in 2011-2012). During those periods, companies with clean balance sheets saw dramatically less equity damage than their leveraged peers. The signal captures that genuine differential. In the US, the corporate bond market provides refinancing lifelines more easily. In India, if your balance sheet is stressed, the equity market knows it.
2. The ROE > 10% filter is actually selective.
In the US, thousands of large-cap companies pass ROE > 10%. It's a weak filter. In India, consistently earning above 10% ROE across market cycles requires genuine competitive advantage. The combined filter (low leverage + real profitability) is more discriminating in a market where both conditions are harder to sustain simultaneously.
3. The equity market isn't dominated by a small number of capital-light megacaps.
The US underperformance story is about Nvidia, Meta, Alphabet, and Apple moving SPY dramatically faster than any fundamentals-based screen. India's equity market doesn't have that dynamic to the same degree. The top performers in India over this period include HDFC Bank, TCS, Reliance Industries, Infosys, and pharma companies. Many of these qualify on the Net Debt/EBITDA screen. There's no five-stock concentration problem distorting the benchmark.
The Benchmark Context
A 17.62% CAGR on NSE deserves honest framing. Indian equities as a whole performed exceptionally from 2000 to 2025. The BSE Sensex compounded at 11.12% annually over this period, driven by rapid economic growth, demographic expansion, and re-rating from emerging-market discount.
The strategy adds 6.50% above the Sensex annually over 25 years. The Sortino Ratio of 0.848 shows the downside-risk-adjusted performance is solid. The down capture of 65.9% means the screen provides genuine protection in declining markets, not just India's overall bull market beta.
The earlier version of this analysis used BSE+NSE combined. With NSE-only (removing ~38% duplicate listings), the early cash periods increase because fewer unique qualifying names existed on NSE alone in 2000-2003. That reduces headline CAGR but makes the methodology cleaner. The alpha is real either way.
Run It Yourself
Current qualifying stocks (India, TTM data):
SELECT
    k.symbol,
    p.companyName,
    ROUND(k.netDebtToEBITDATTM, 2)      AS net_debt_ebitda,
    ROUND(k.returnOnEquityTTM * 100, 1) AS roe_pct,
    ROUND(k.marketCap / 1e9, 1)         AS mktcap_bn
FROM key_metrics_ttm k
JOIN profile p ON k.symbol = p.symbol
WHERE k.netDebtToEBITDATTM < 2.0
  AND k.netDebtToEBITDATTM > -5.0
  AND k.returnOnEquityTTM > 0.10
  AND k.marketCap > 20000000000  -- ₹20B (~$240M USD)
  AND p.exchange = 'NSE'
ORDER BY k.netDebtToEBITDATTM ASC
LIMIT 30
Run this query on Ceta Research
Full backtest:
cd backtests
python3 net-debt-ebitda/backtest.py --preset india --verbose
Limitations
NSE-only universe. The backtest uses NSE stocks only to avoid double-counting the ~38% of companies that list on both NSE and BSE. The screening SQL above uses NSE only for consistency.
Cash periods reflect data constraints. 17 of 103 quarters were in cash. Most of these are 2000-2003, when the NSE didn't have 10 qualifying large-cap stocks. This is an early-history limitation, not a signal problem.
Survivorship and data coverage. FMP coverage before 2005 is thinner. Some early returns may be affected by incomplete data.
Concentration. A 30-stock equal-weight portfolio in India has meaningful sector concentration, historically heavy in industrials, banks, and pharma. This isn't a diversified country-fund equivalent.
Part of a series. This is one of 22 exchanges tested. The comparison post shows where the signal works and where it doesn't.
Data: Ceta Research (FMP financial data warehouse), 2000-2025. Universe: NSE (National Stock Exchange), market cap > ₹20B. Quarterly rebalance, equal weight, top 30 by lowest Net Debt/EBITDA. Point-in-time data with 45-day filing lag. Transaction costs: size-tiered model. Full methodology: backtests/METHODOLOGY.md. Backtest code: backtests/net-debt-ebitda/. Past performance does not guarantee future results. This is educational content, not investment advice.


