
India: Matches the Sensex at 12.1%, but with a -21% Drawdown vs -32%
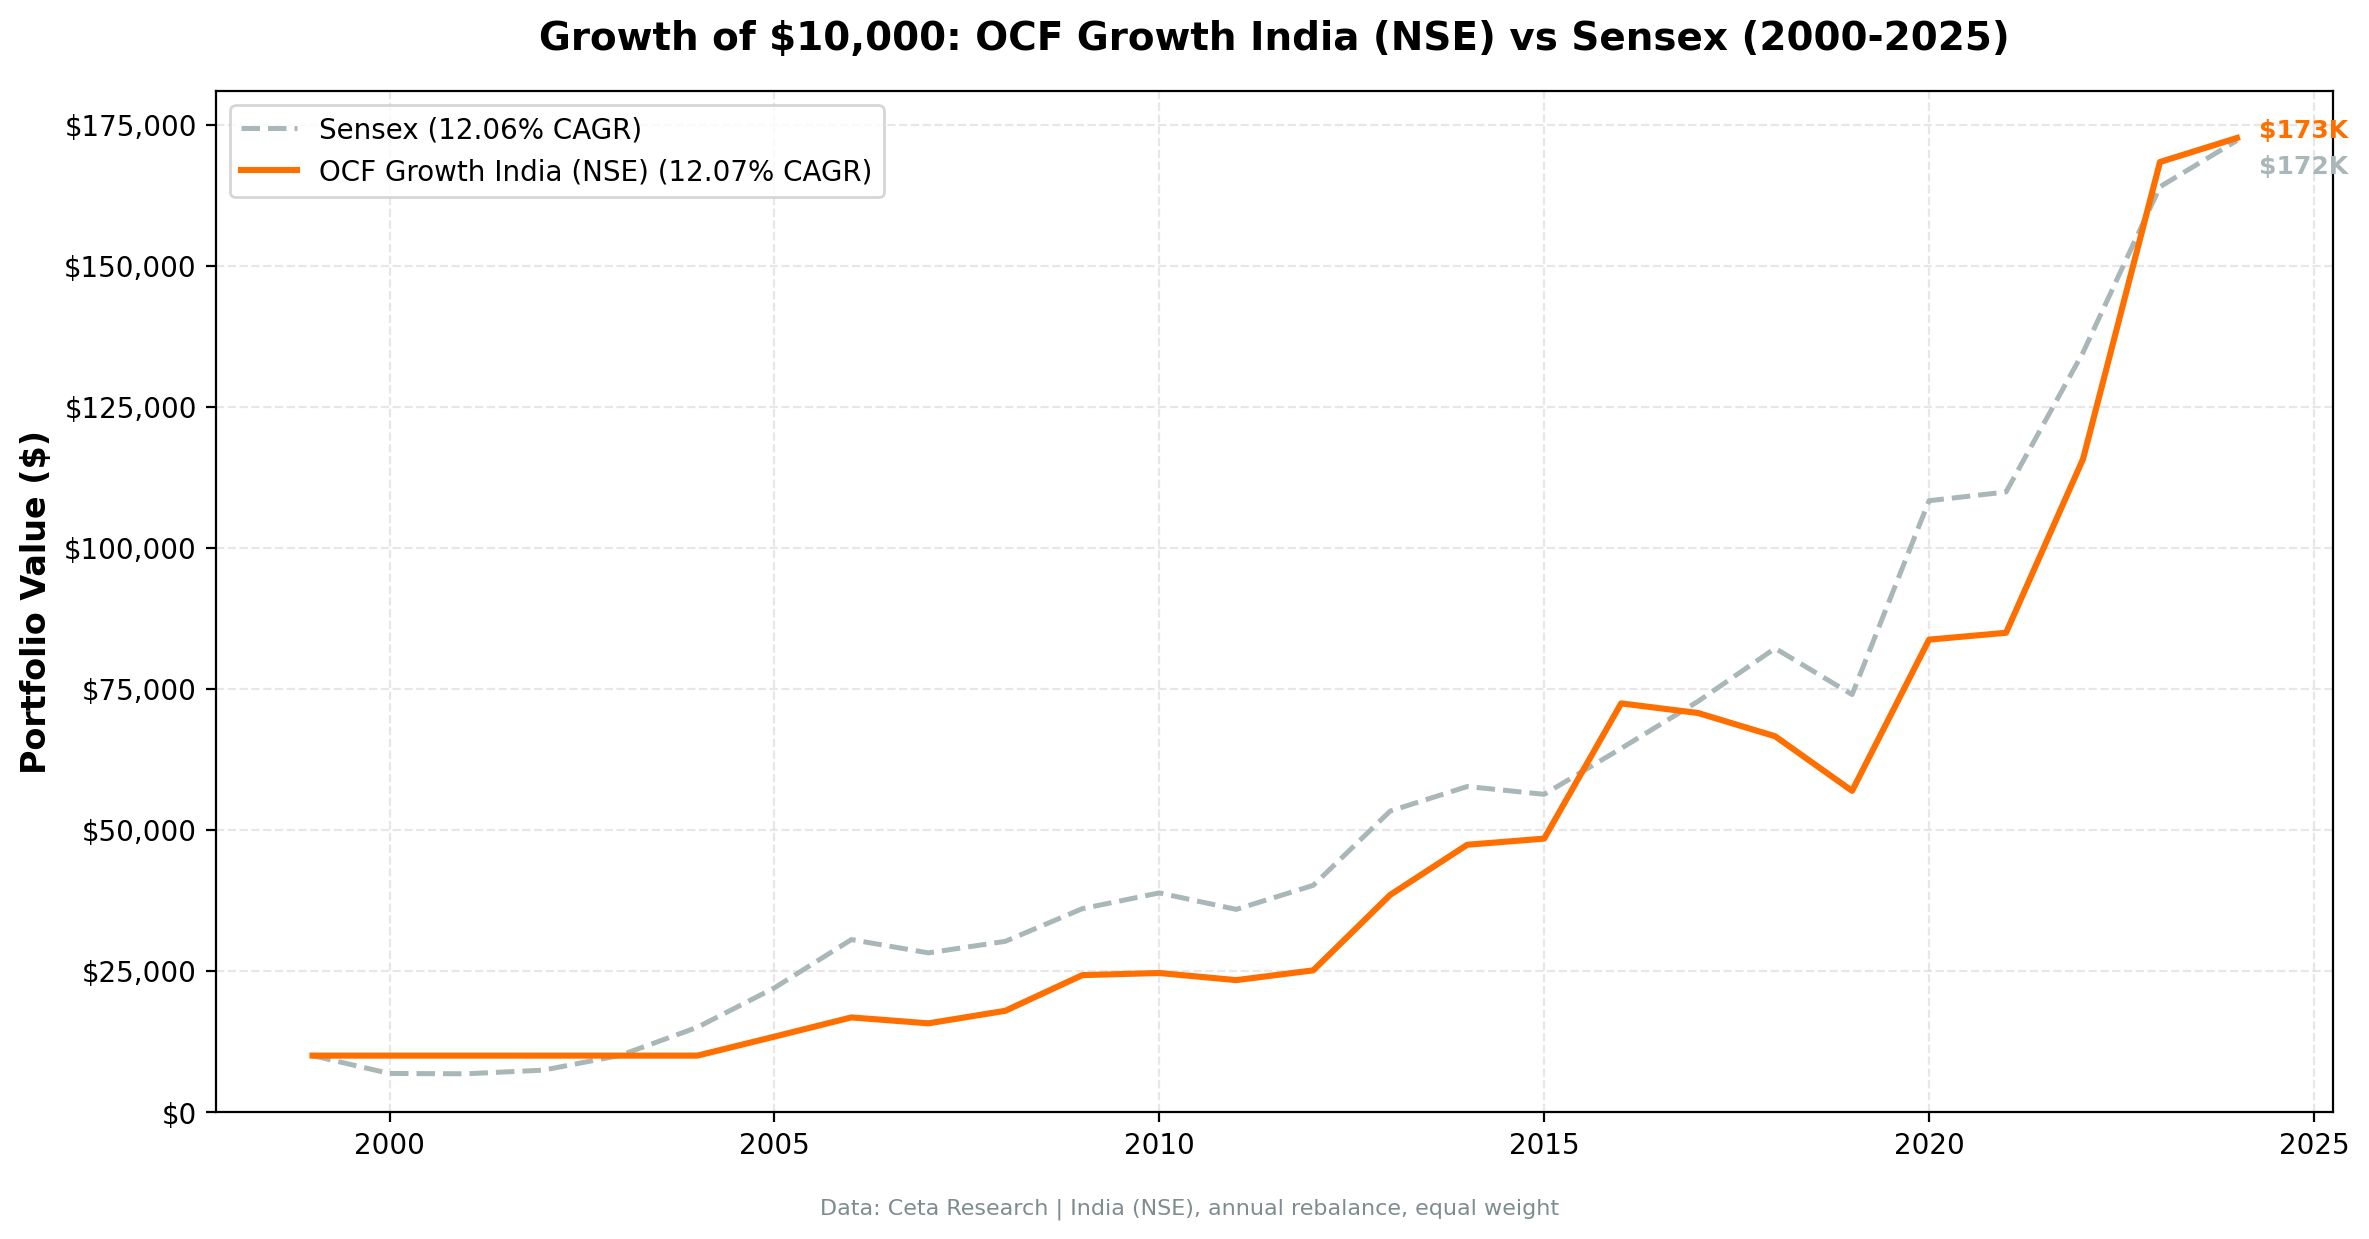
Operating cash flow momentum returned 12.1% annually on NSE stocks from 2000-2025, matching the Sensex. Max drawdown: -21.4% vs Sensex's -32.2%, beta 0.58. $10,000 to $172,659.

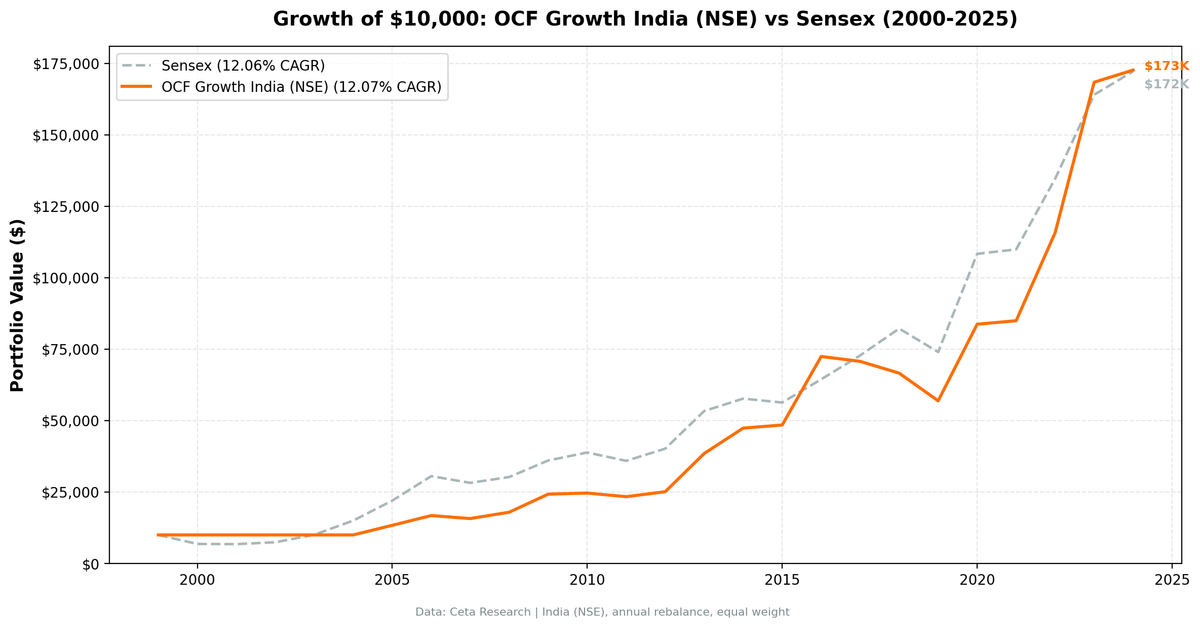
Operating cash flow momentum returned 12.1% annually on Indian stocks (NSE) from 2000 to 2025, matching the Sensex almost exactly (the Sensex returned 12.1% too). $10,000 grew to $172,659. The strategy's real edge isn't return, it's risk: a maximum drawdown of -21.4% vs the Sensex's -32.2%, and a beta of just 0.58. It beat the Sensex in 14 of 25 years (56% win rate), with four years above +45%. The signal doesn't generate alpha over the local benchmark, but it delivers index-level returns with materially less downside.
Contents
- Method
- What We Found
- 25 years of data. 12.1% CAGR, matched the Sensex with lower risk.
- Year-by-year returns
- The 2008 divergence: +14% while the Sensex rose 7%
- The 2013-2016 bull run: strong gains vs Sensex
- The 2018 underperformance: when the signal fails
- Why OCF Momentum Works Better in India
- When It Works in India
- When It Struggles
- Part of a Series
- Run It Yourself
- OCF Momentum Screen for India (SQL)
- Limitations
- Takeaway
Data: FMP financial data warehouse, 2000–2025. Updated June 2026.
Method
Data source: Ceta Research (FMP financial data warehouse) Universe: NSE, market cap > ₹20B (~$240M USD) Period: 2000-2025 (25 years, annual rebalancing) Rebalancing: Annual (July), 45-day lag on FY financial data Benchmark: Sensex (^BSESN, local currency) Cash rule: Hold cash if fewer than 10 stocks qualify
Operating cash flow growth and net income growth from FY annual data. Quality filters: ROE > 10%, operating margin > 5%. Portfolio: top 30 stocks by highest divergence (OCF growth minus NI growth), equal weight.
What We Found
25 years of data. 12.1% CAGR, matched the Sensex with lower risk.
| Metric | OCF Momentum (NSE) | Sensex |
|---|---|---|
| CAGR | 12.1% | 12.1% |
| Total Return | 1627% | 1622% |
| Volatility | 20.7% | - |
| Max Drawdown | -21.4% | -32.2% |
| Sharpe Ratio | 0.27 | - |
| Sortino Ratio | 0.78 | - |
| Alpha (vs Sensex) | 2.34% | - |
| Beta | 0.58 | 1.00 |
| Win Rate (annual) | 56% | - |
| Avg Stocks per Period | 20.6 | - |
| Cash Periods | 5 of 25 | - |
OCF Momentum turned $10,000 into $172,659. The Sensex turned it into $172,157. The total returns are a near tie over 25 years, but the strategy got there with less risk: max drawdown of -21.4% vs the Sensex's -32.2%, and a beta of 0.58.
The excess return vs the local benchmark is essentially zero (+0.0% CAGR). The strategy doesn't beat the Sensex on returns. Its edge is risk-adjusted: a regression alpha of +2.3% with beta 0.58 means it delivered index-level returns while taking far less market risk, and it avoided the Sensex's worst crashes.
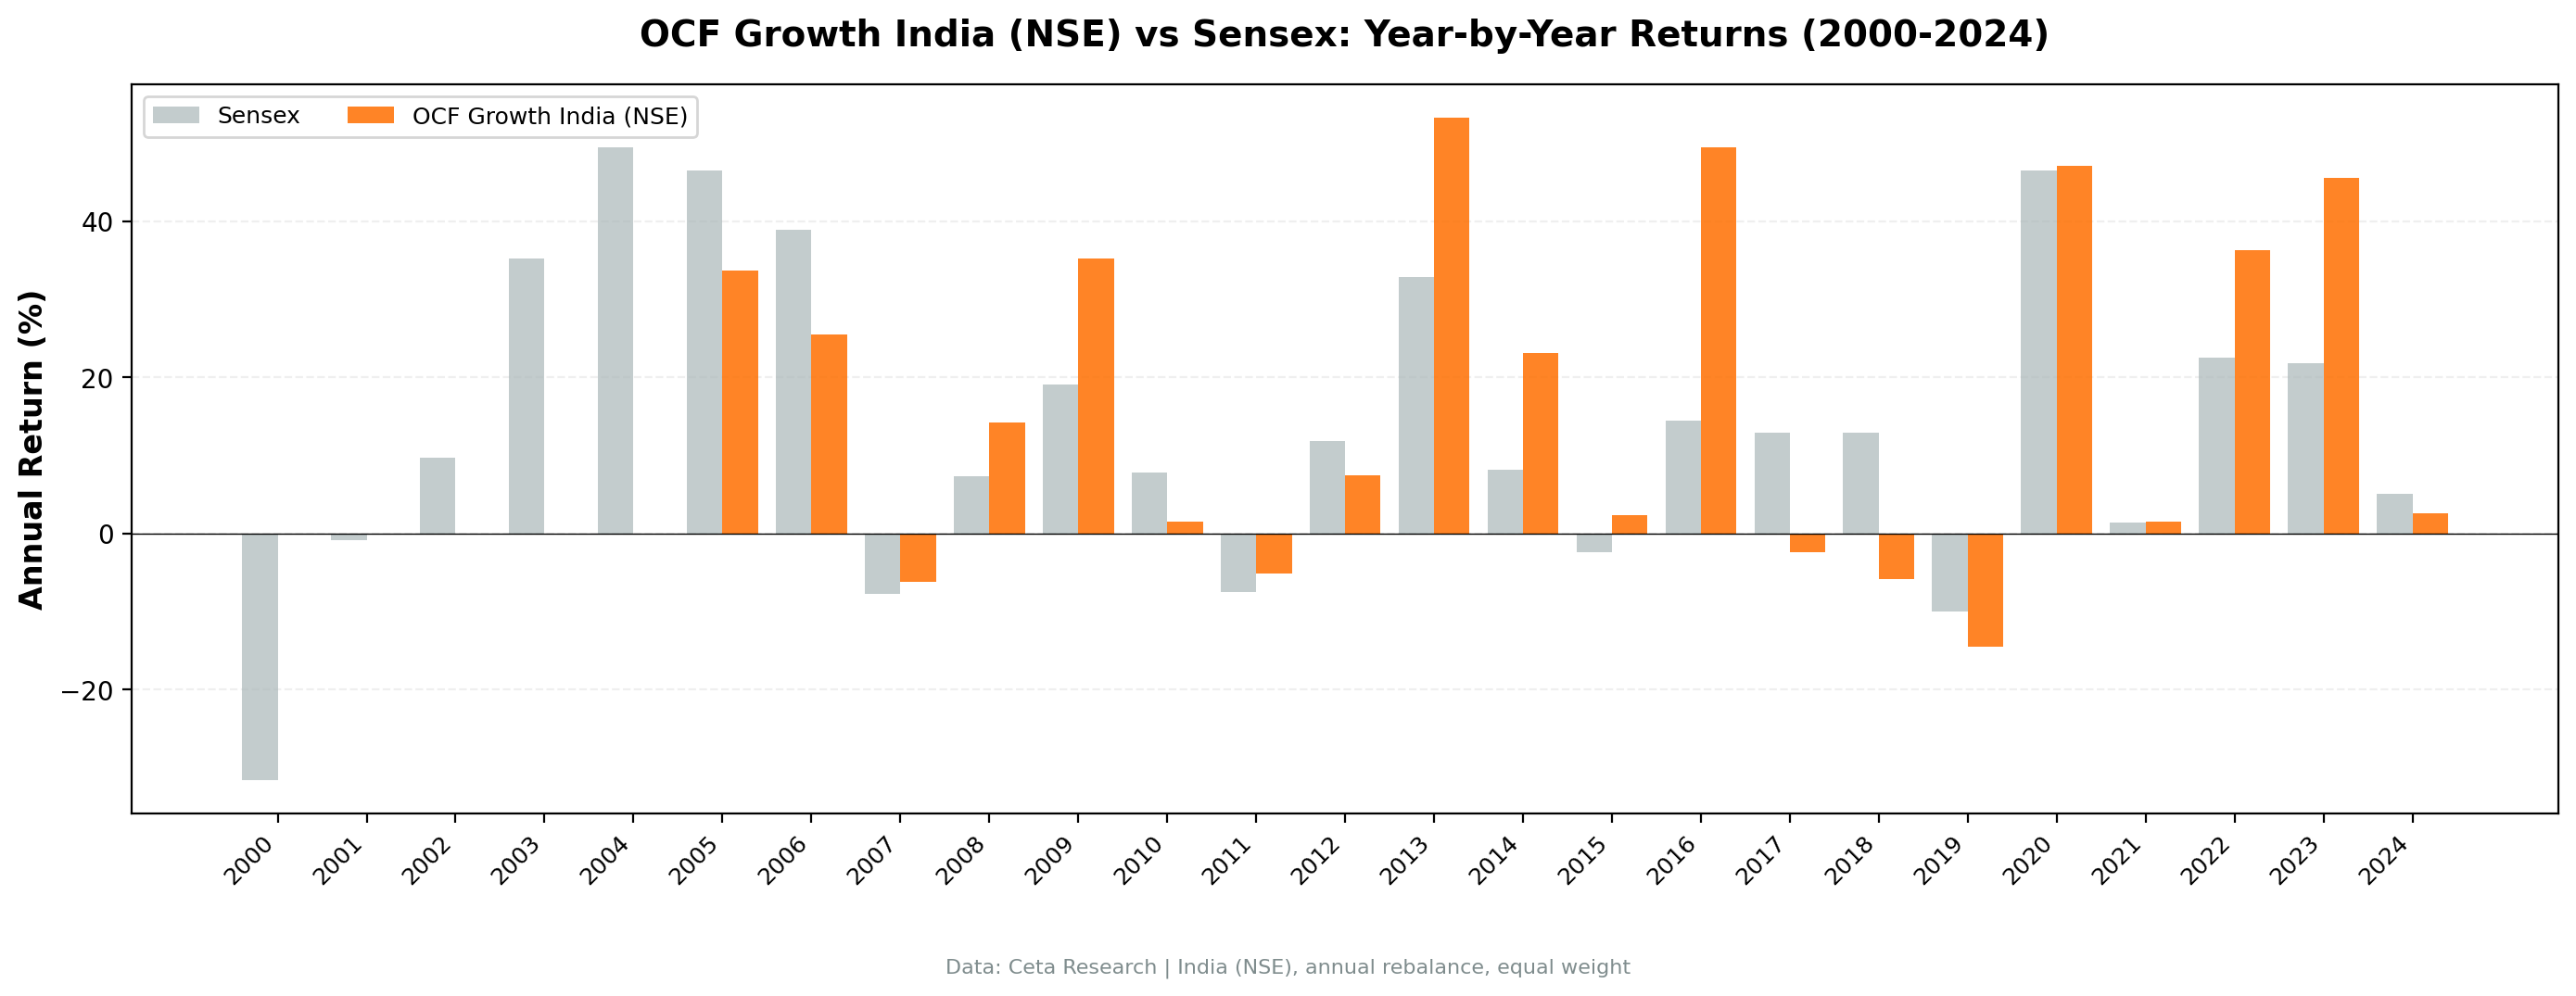
Year-by-year returns
| Year | OCF Momentum | Sensex | Excess |
|---|---|---|---|
| 2000 | +0.0% | -31.6% | +31.6% |
| 2001 | +0.0% | -0.8% | +0.8% |
| 2002 | +0.0% | +9.6% | -9.6% |
| 2003 | +0.0% | +35.2% | -35.2% |
| 2004 | +0.0% | +49.4% | -49.4% |
| 2005 | +33.6% | +46.5% | -12.9% |
| 2006 | +25.5% | +38.9% | -13.4% |
| 2007 | -6.2% | -7.7% | +1.5% |
| 2008 | +14.1% | +7.3% | +6.9% |
| 2009 | +35.2% | +19.1% | +16.1% |
| 2010 | +1.5% | +7.8% | -6.2% |
| 2011 | -5.1% | -7.5% | +2.4% |
| 2012 | +7.4% | +11.9% | -4.4% |
| 2013 | +53.2% | +32.8% | +20.5% |
| 2014 | +23.1% | +8.1% | +14.9% |
| 2015 | +2.3% | -2.4% | +4.7% |
| 2016 | +49.5% | +14.4% | +35.0% |
| 2017 | -2.4% | +12.9% | -15.3% |
| 2018 | -5.8% | +12.9% | -18.7% |
| 2019 | -14.5% | -10.0% | -4.5% |
| 2020 | +47.1% | +46.4% | +0.7% |
| 2021 | +1.4% | +1.4% | +0.0% |
| 2022 | +36.2% | +22.5% | +13.8% |
| 2023 | +45.5% | +21.8% | +23.7% |
| 2024 | +2.5% | +5.0% | -2.5% |
The 2008 divergence: +14% while the Sensex rose 7%
2008 was a defining year. While the Sensex ground higher, Indian stocks with strong cash flow quality gained 14.1% vs the Sensex's 7.3%. That's +6.9% excess in a single year during global turmoil.
What happened? The cash flow divergence filter screened out highly leveraged companies and companies with deteriorating earnings quality. It kept companies that were genuinely generating cash. When credit froze globally, the portfolio's quality tilt showed up.
The 2013-2016 bull run: strong gains vs Sensex
| Year | OCF Momentum | Sensex | Excess |
|---|---|---|---|
| 2013 | +53.2% | +32.8% | +20.5% |
| 2014 | +23.1% | +8.1% | +14.9% |
| 2015 | +2.3% | -2.4% | +4.7% |
| 2016 | +49.5% | +14.4% | +35.0% |
| Cumulative | +188% | +60% | +128% |
Four years, all four ahead of the Sensex. The Indian market rewarded cash-generative companies during this period, and the OCF divergence signal caught them early.
The 2018 underperformance: when the signal fails
2018 was the worst year: -5.8% vs the Sensex's +12.9% (18.7 percentage points of underperformance). The strategy missed the late-cycle rally in Indian markets, driven by banking and financial stocks with weak near-term cash flow quality.
This is the tradeoff. OCF Momentum screens out leverage and financial engineering. Sometimes the market rewards exactly those attributes.
Why OCF Momentum Works Better in India
Weaker accounting enforcement. Indian companies face less stringent enforcement of accounting standards than US companies. That makes accrual manipulation easier and more common. The divergence between earnings and cash flow carries more signal in environments where earnings are less reliable.
Higher prevalence of family-controlled businesses. Many Indian listed companies are controlled by founding families with significant discretion over financial reporting. Cash flow is harder to manipulate than earnings in these structures. Investors who focus on cash generation have an informational edge.
Less analyst coverage. The average Indian mid-cap has far fewer analysts covering it than a comparable US stock. That means cash flow information is less quickly incorporated into prices. The divergence signal has more time to work.
Macro volatility creates regime shifts. India experienced multiple macro shocks over this 25-year period: 2008 financial crisis, 2013 taper tantrum, 2016 demonetization, 2020 COVID. During these shocks, cash-generative companies outperformed. The OCF signal helped identify them.
When It Works in India
Crisis periods. 2008 (+14.1% vs Sensex +7.3%), 2009 (+35.2% vs +19.1%), 2022 (+36.2% vs +22.5%). When markets are stressed and liquidity is scarce, companies with genuine cash generation survive and thrive.
Quality bull runs. 2013 (+53.2%), 2016 (+49.5%), 2023 (+45.5%). When the Indian market rewards mid-cap quality, companies with strong operational cash flow capture growth faster than those relying on accrual accounting to inflate earnings.
Quality rotations. When the market shifts from speculative small-caps to fundamentally sound mid-caps (as it did in 2012-2016), OCF divergence becomes a powerful filter.
When It Struggles
Late-cycle rallies. 2018 (-5.8% vs Sensex +12.9%). When the market is pricing companies on near-term earnings momentum rather than cash quality, this strategy underperforms. Banks and NBFCs often dominate late-cycle Indian market rallies, and they tend to have poor cash flow characteristics.
Sector concentration risk. Indian markets are more concentrated than US markets. When a single sector (IT, pharma, banking) drives the index, and that sector doesn't align with the cash flow signal, the strategy can underperform for years.
Cash periods. The strategy held cash in 5 of 25 years (2000-2004), missing the early-2000s rally. This was due to data availability rather than signal failure, but it demonstrates the dependency on complete financial data.
Part of a Series
This is the India-specific analysis. For the complete methodology, US results, and cross-market comparison, see: - Operating Cash Flow Momentum: US Results (flagship post) - OCF Momentum: Global Comparison (9 markets tested)
Run It Yourself
OCF Momentum Screen for India (SQL)
WITH latest_cg AS (
    SELECT symbol, growthOperatingCashFlow, dateEpoch,
        ROW_NUMBER() OVER (PARTITION BY symbol ORDER BY dateEpoch DESC) AS rn
    FROM cash_flow_statement_growth
    WHERE period = 'FY' AND growthOperatingCashFlow IS NOT NULL
),
latest_ig AS (
    SELECT symbol, growthNetIncome, dateEpoch,
        ROW_NUMBER() OVER (PARTITION BY symbol ORDER BY dateEpoch DESC) AS rn
    FROM income_statement_growth
    WHERE period = 'FY' AND growthNetIncome IS NOT NULL
)
SELECT
    cg.symbol,
    p.companyName,
    ROUND(cg.growthOperatingCashFlow * 100, 1) AS ocf_growth_pct,
    ROUND(ig.growthNetIncome * 100, 1) AS ni_growth_pct,
    ROUND((cg.growthOperatingCashFlow - ig.growthNetIncome) * 100, 1) AS divergence_pct,
    ROUND(k.returnOnEquityTTM * 100, 1) AS roe_pct,
    ROUND(f.operatingProfitMarginTTM * 100, 1) AS op_margin_pct,
    ROUND(k.marketCap / 1e9, 1) AS market_cap_billions
FROM latest_cg cg
JOIN latest_ig ig ON cg.symbol = ig.symbol AND ig.rn = 1
JOIN key_metrics_ttm k ON cg.symbol = k.symbol
JOIN financial_ratios_ttm f ON cg.symbol = f.symbol
JOIN profile p ON cg.symbol = p.symbol
WHERE cg.rn = 1
  AND cg.growthOperatingCashFlow > 0.10
  AND cg.growthOperatingCashFlow < 5.0
  AND cg.growthOperatingCashFlow > ig.growthNetIncome
  AND k.returnOnEquityTTM > 0.10
  AND f.operatingProfitMarginTTM > 0.05
  AND k.marketCap > 20000000000
  AND p.exchange IN ('NSE')
ORDER BY (cg.growthOperatingCashFlow - ig.growthNetIncome) DESC
LIMIT 30
Run this query on Ceta Research
Market cap threshold: ₹20B (~$240M USD), targeting liquid mid-cap and large-cap stocks.
Limitations
Returns in local currency (INR). The backtest uses NSE prices in INR. A US investor would face INR/USD exposure on top of the equity returns.
Survivorship bias. FMP data includes some delisted stocks but may not capture all failures. The 1627% return could be overstated if major bankruptcies are missing.
Data quality. Indian financial data has more gaps and corrections than US data. Some results may reflect data artifacts rather than genuine signals.
No transaction costs. The backtest doesn't model India-specific transaction costs (STT, stamp duty, exchange fees), which are higher than US costs. Real-world returns would be lower.
Cash period drag. The strategy held cash for 5 of 25 years (2000-2004), missing the early Sensex rally. If data coverage improves, some of those cash periods may disappear.
Single-country risk. This is a bet on Indian equity markets. Macro risk (rupee devaluation, regulatory changes, geopolitical shocks) can overwhelm any stock-selection signal.
Takeaway
Operating cash flow momentum delivered 12.1% annual returns on NSE stocks over 25 years, matching the Sensex's 12.1% but with materially better downside protection (-21.4% max drawdown vs -32.2%) and a beta of 0.58. There's no return alpha over the local benchmark. But the risk-adjusted story is compelling. The strategy delivered index-level returns while taking far less market risk, avoiding the Sensex's worst crashes while participating in its bull runs.
The signal isn't perfect. It underperformed sharply in 2018, held cash through the massive 2003-2005 Sensex rally, and missed several banking-driven bounces. But over 25 years, it identified companies with genuine cash generation and avoided companies inflating earnings through accruals.
If you believe Indian companies with weak accounting standards and less analyst coverage offer persistent informational inefficiencies, the OCF divergence signal is one way to exploit them. Don't expect large alpha over the index every year. Do expect lower drawdowns and roughly index-level returns with a quality tilt.
Data: Ceta Research (FMP financial data warehouse), NSE 2000-2025. Full methodology: backtests/METHODOLOGY.md
Past performance does not guarantee future results. This is educational content, not investment advice.


