
Japan: +1.4% Alpha Over the Nikkei 225, Modest but Real
OCF momentum returned 4.7% annually on Japanese stocks vs the Nikkei 225's 3.3%, a +1.4% alpha. The signal now beats the Nikkei, with 4 of 25 cash periods and a -52% drawdown.

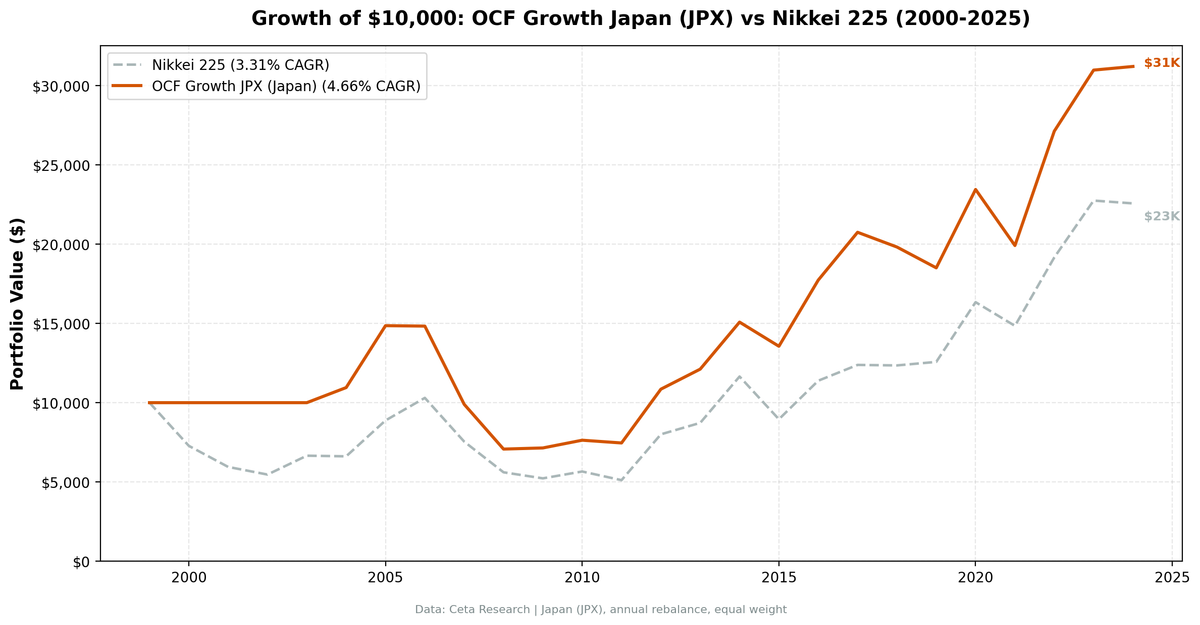
OCF momentum returned 4.7% annually on Japanese stocks, 2000-2025, beating the Nikkei 225 by 1.4% per year. The Nikkei returned 3.3% annually. The strategy held cash in 4 of 25 years (16% of periods) when strict filters left too few qualifying companies. When invested, it held 25 stocks on average and rode out a -52% max drawdown. $10,000 grew to $31,213 vs the Nikkei's $22,574. Modest positive alpha: the quality screen added value in a market long known for weak capital discipline.
Contents
Data: FMP financial data warehouse, 2000–2025. Updated June 2026.
What We Found

| Metric | Japan (JPX) | Nikkei 225 |
|---|---|---|
| CAGR | 4.7% | 3.3% |
| Volatility | 19.3% | - |
| Max Drawdown | -52.4% | -50.4% |
| Sharpe | 0.24 | - |
| Cash Periods | 4 of 25 | - |
| Win Rate (vs Nikkei) | 52% | - |
The ROE > 10% filter screens out most Japanese companies (the average JPX return on equity sits near 8%), so the strategy sat in cash in 4 of 25 years. When invested, it held the minority of Japanese firms that pair improving cash flow with genuine profitability, and that subset beat the Nikkei over 25 years.
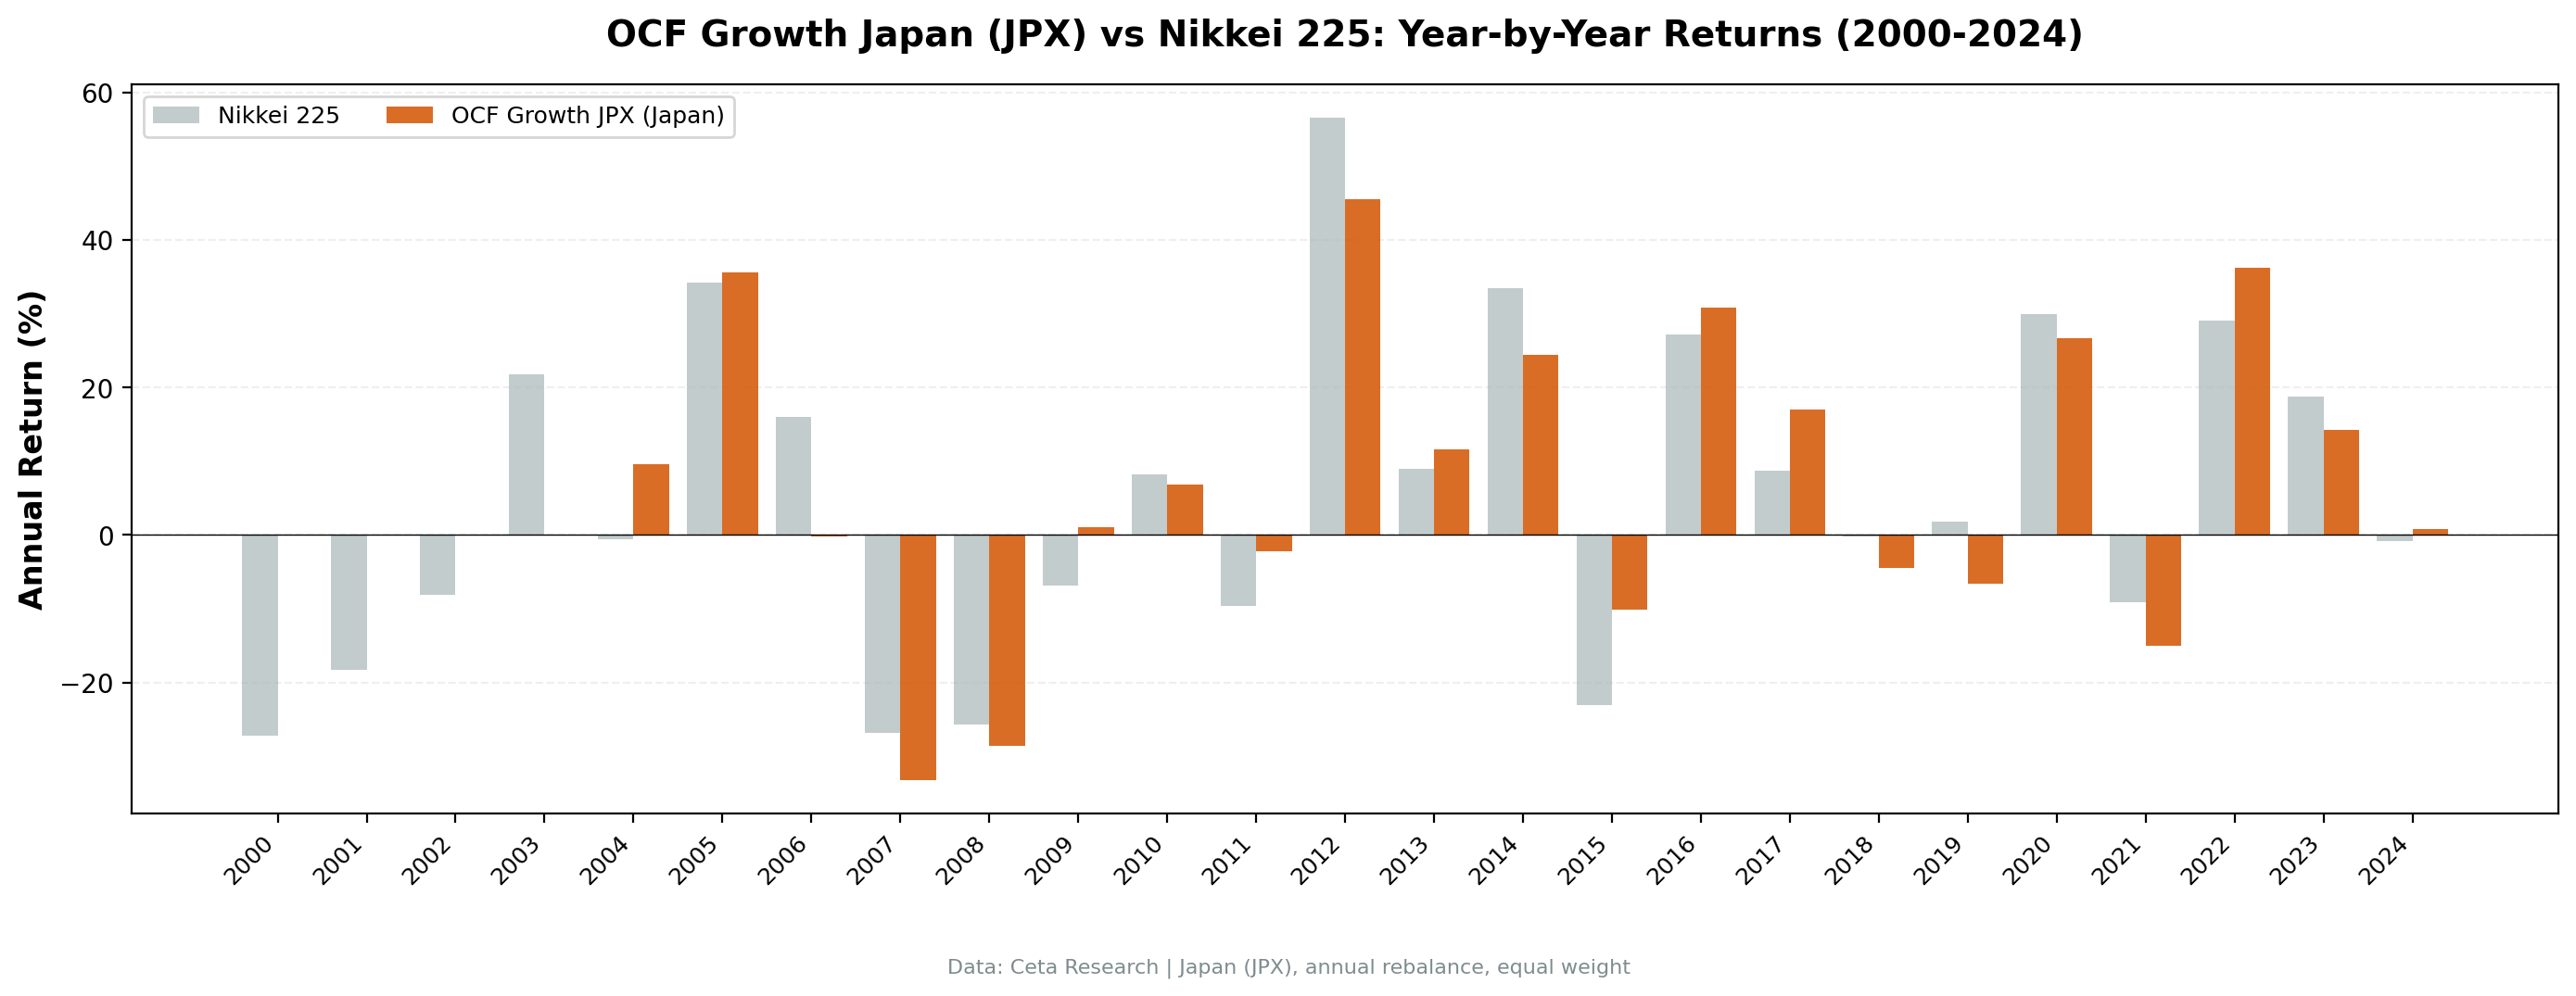
Best year: 2012 (+45.5%) during Abenomics. Worst year: 2007 (-33.3%). The strategy beat the Nikkei in 13 of 25 years (52% win rate).
Why it works (modestly): Japan is full of cash-rich companies with weak capital discipline. Filtering for ROE > 10% plus improving cash flow isolates the firms that actually convert cash into shareholder value. The edge is small (+1.4%) and the ride is volatile (-52% drawdown), but the signal adds value rather than destroying it.
Part of a Series: US Results | India: matches the Sensex, lower drawdown | Canada: +4.9% alpha over the TSX | Global Comparison
Run It Yourself
Screen Japanese stocks with OCF momentum on Ceta Research
Market cap threshold: ¥100B (~$680M USD), ROE > 10%, operating margin > 5%, OCF growth > NI growth.
Takeaway: Japan surprised us. The OCF divergence signal beat the Nikkei by 1.4% annually over 25 years, modest but positive. The quality gate (ROE > 10%) does real work in a market famous for cash-hoarding: it keeps you in the firms that actually compound. The drawdown is brutal (-52%), so this is alpha you earn by sitting through pain.
Data: Ceta Research, JPX 2000-2025. Full methodology: backtests/METHODOLOGY.md
Past performance does not guarantee future results. This is educational content, not investment advice.


