
Thailand: Worst Performer, -3.8% vs the SET Index
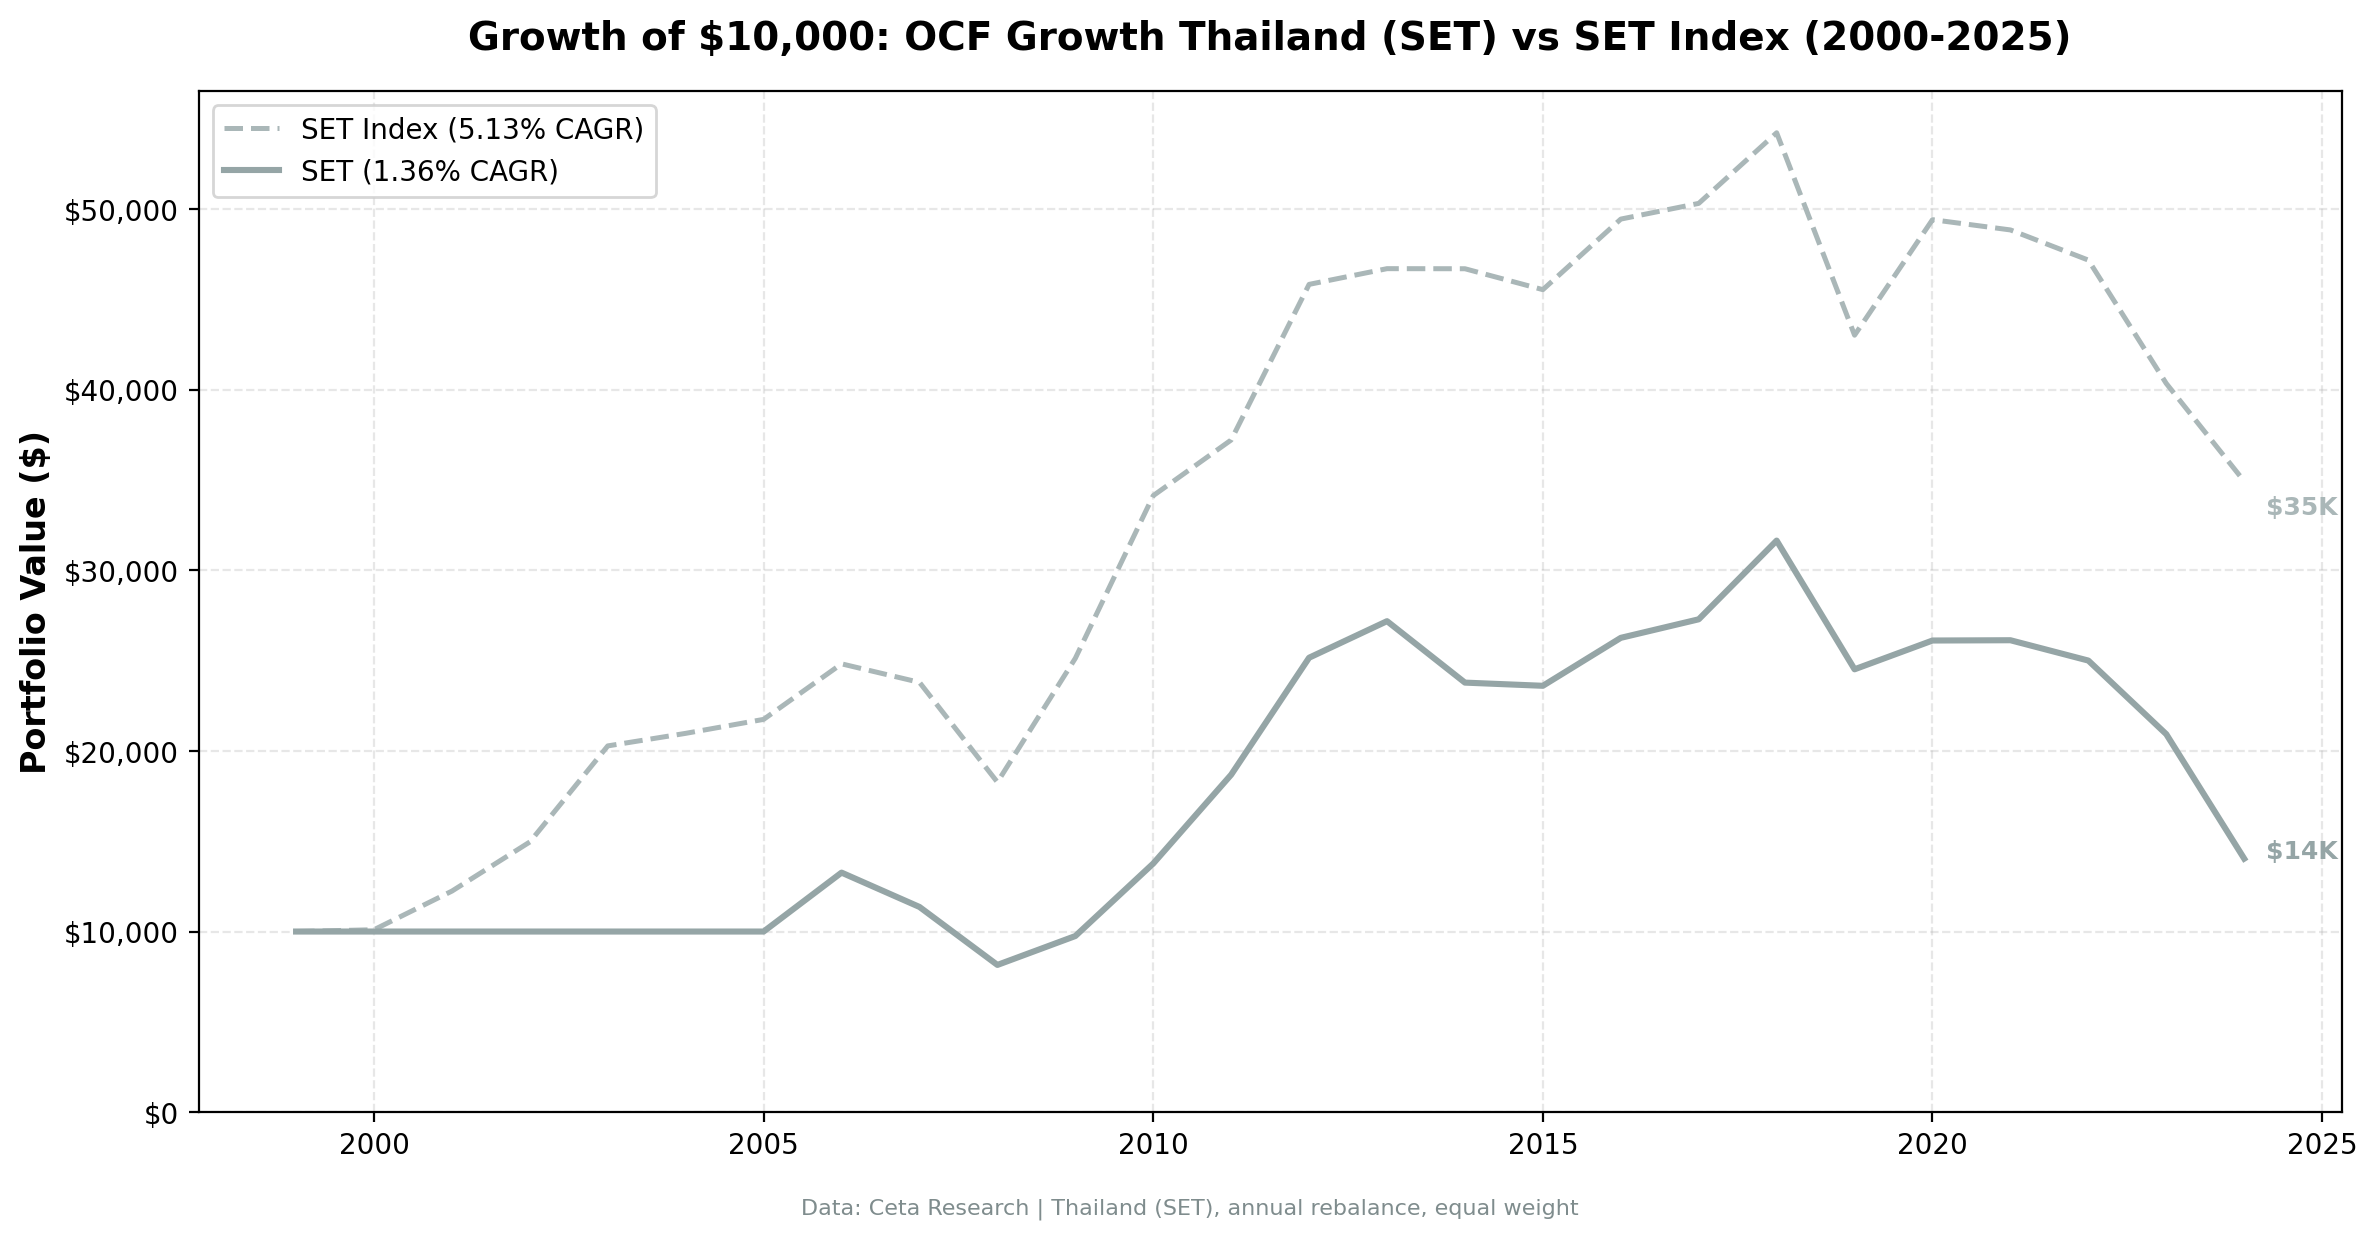
OCF momentum returned 1.4% annually on Thai stocks vs the SET Index's 5.1%, lagging by -3.8%, the worst of any market tested. Negative Sharpe (-0.06), -55.7% drawdown, 24% cash periods.

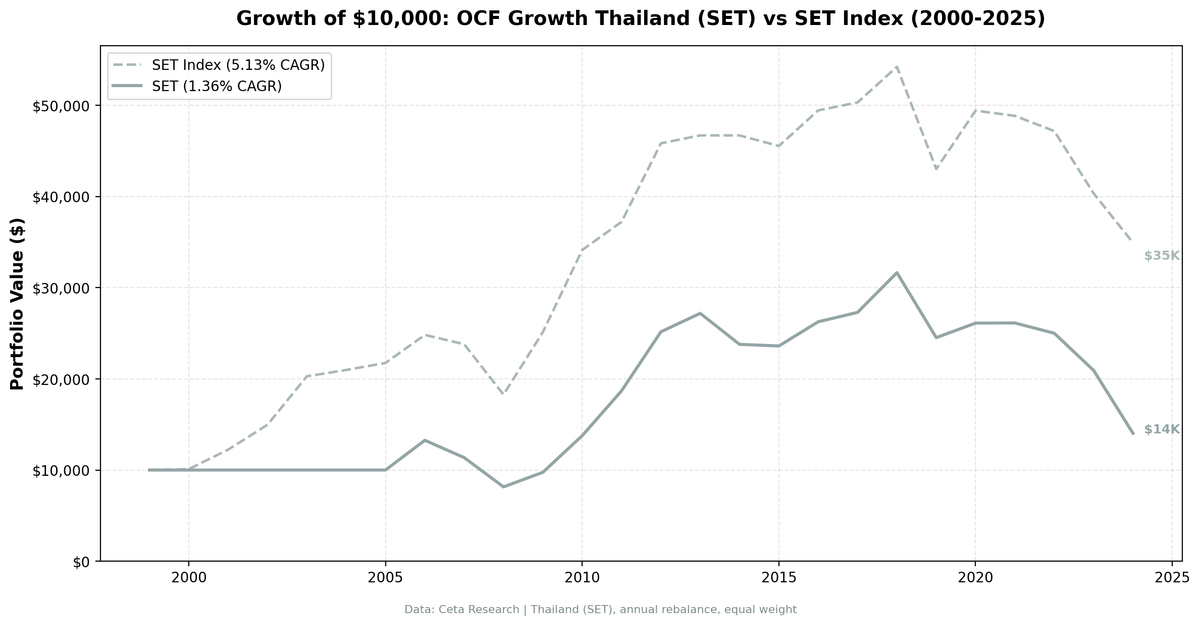
OCF momentum returned 1.4% annually on Thai stocks, 2000-2025, underperforming the SET Index by 3.8% per year. The SET returned 5.1% annually. $10,000 grew to $14,034 vs SET's $34,946, a total return of 40%. The strategy held cash in 6 of 25 years (24%) and suffered a -55.7% max drawdown when invested. Negative Sharpe (-0.06) and a win rate of just 40%. Thailand is the only market where the signal consistently fails vs the local benchmark. Cash drag and poor stock selection both hurt.
Contents
Data: FMP financial data warehouse, 2000–2025. Updated June 2026.
What We Found
| Metric | Thailand (SET) | SET Index |
|---|---|---|
| CAGR | 1.4% | 5.1% |
| Volatility | 19.3% | - |
| Max Drawdown | -55.7% | -35.6% |
| Sharpe | -0.06 | - |
| Cash Periods | 6 of 25 | 0 |
| Win Rate | 40% | - |
The negative Sharpe and 24% cash drag tell the story: the strategy couldn't find enough qualifying stocks in most years, and when it did, they underperformed.
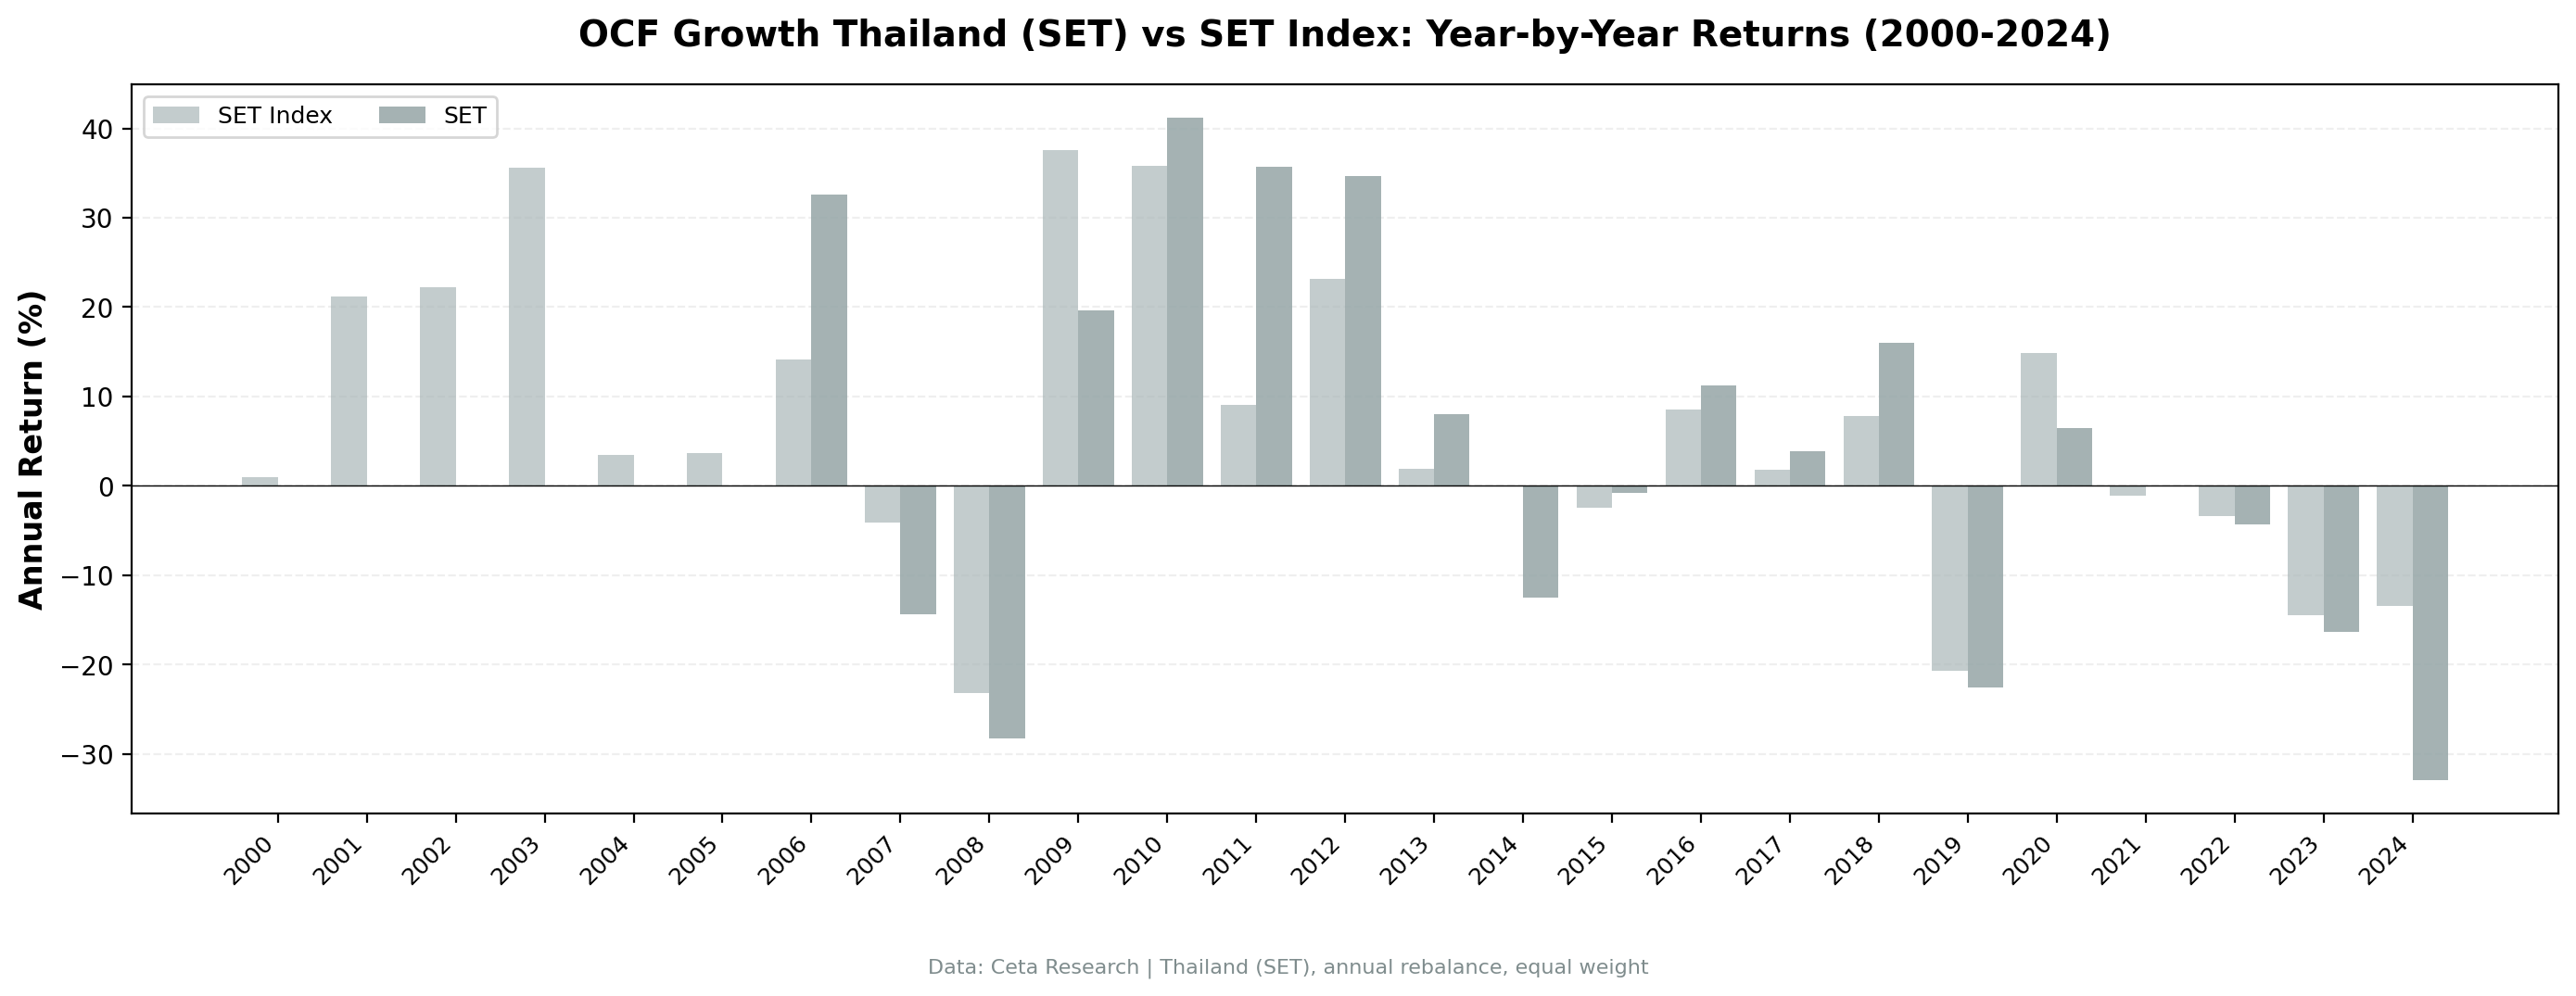
Best year: 2011 (+35.7%) post-flood recovery. Worst year: 2024 (-32.9%) during baht weakness. But 15 of 25 years showed underperformance.
Why it failed: Thai SET is dominated by conglomerates, family-controlled businesses, and state-linked enterprises. Cash flow quality doesn't matter when stock prices are driven by political connections, currency moves, and sentiment.
Part of a Series: US Results | India Results | Canada Results | Global Comparison
Run It Yourself
Screen Thai stocks with OCF momentum on Ceta Research
Market cap threshold: ฿10B (~$286M USD), ROE > 10%, operating margin > 5%, OCF growth > NI growth.
Takeaway: Thailand shows the limits of financial signals in frontier markets. When governance is weak and political/currency risk dominates, OCF divergence adds no value.
Data: Ceta Research, SET 2000-2025. Full methodology: backtests/METHODOLOGY.md
Past performance does not guarantee future results. This is educational content, not investment advice.

