
Pairs Trading in Japan: Why the Tokyo Stock Exchange Consistently Outperforms
Among 12 exchanges we tested, Japan (JPX) is the only market with a positive Sharpe ratio (+0.141) and the highest investment rate: 95% of years had active pairs. We dig into why Japan's market structure makes it uniquely suited for pairs trading.

We ran the same pairs trading strategy on 12 exchanges from 2005 to 2024. Every single market generated near-zero or negative nominal returns. One exception stands out: Japan.
Contents
- Method
- Japan Results (2005-2024)
- The Charts
- Why Japan Works Better
- The Benchmark Comparison
- Limitations
- Takeaway
Japan (JPX) produced a positive Sharpe ratio (+0.13), the highest investment rate globally (95% of years with active pairs), and a 0.61% CAGR vs -0.83% for Germany, -0.90% for Korea, and -2.03% for Taiwan. That's not alpha — it's still well below the Nikkei's 6.33% CAGR. But the consistency and investment rate tell a different story about market structure.
Here's what the data shows and why Japan behaves differently.
Data: FMP financial data warehouse, 2000–2025. Updated March 2026.
Method
Data source: Ceta Research (FMP financial data, 70K+ stocks) Universe: Top 30 stocks per sector by market cap (JPX, market cap > ¥10B) Pair selection: Same sector, 252-day returns correlation > 0.70, top 20 pairs Entry signal: |z-score| > 1.5 at year-end Return model: Equal-dollar pairs return = -sign(z) × (Return_A - Return_B) / 2 Rebalancing: Annual, 2005-2024 Costs: 4 one-way legs per pair
Japan Results (2005-2024)
| Metric | Japan (JPX) | US (NYSE+NASDAQ+AMEX) |
|---|---|---|
| CAGR | 0.61% | -0.50% |
| vs local benchmark | -5.72% (Nikkei 225) | -10.78% (S&P 500) |
| Sharpe ratio | +0.13 | -0.81 |
| Max drawdown | -11.18% | -18.39% |
| Cash periods | 1/20 (5%) | 6/20 (30%) |
| Avg active pairs | 6.3 | 5.4 |
| Total return (20yr) | +12.84% | -9.47% |
Japan has the only positive Sharpe ratio across all 12 exchanges. The max drawdown of -11.18% is among the smallest. And the investment rate is remarkable: 19 out of 20 years had enough qualifying pairs to be invested.
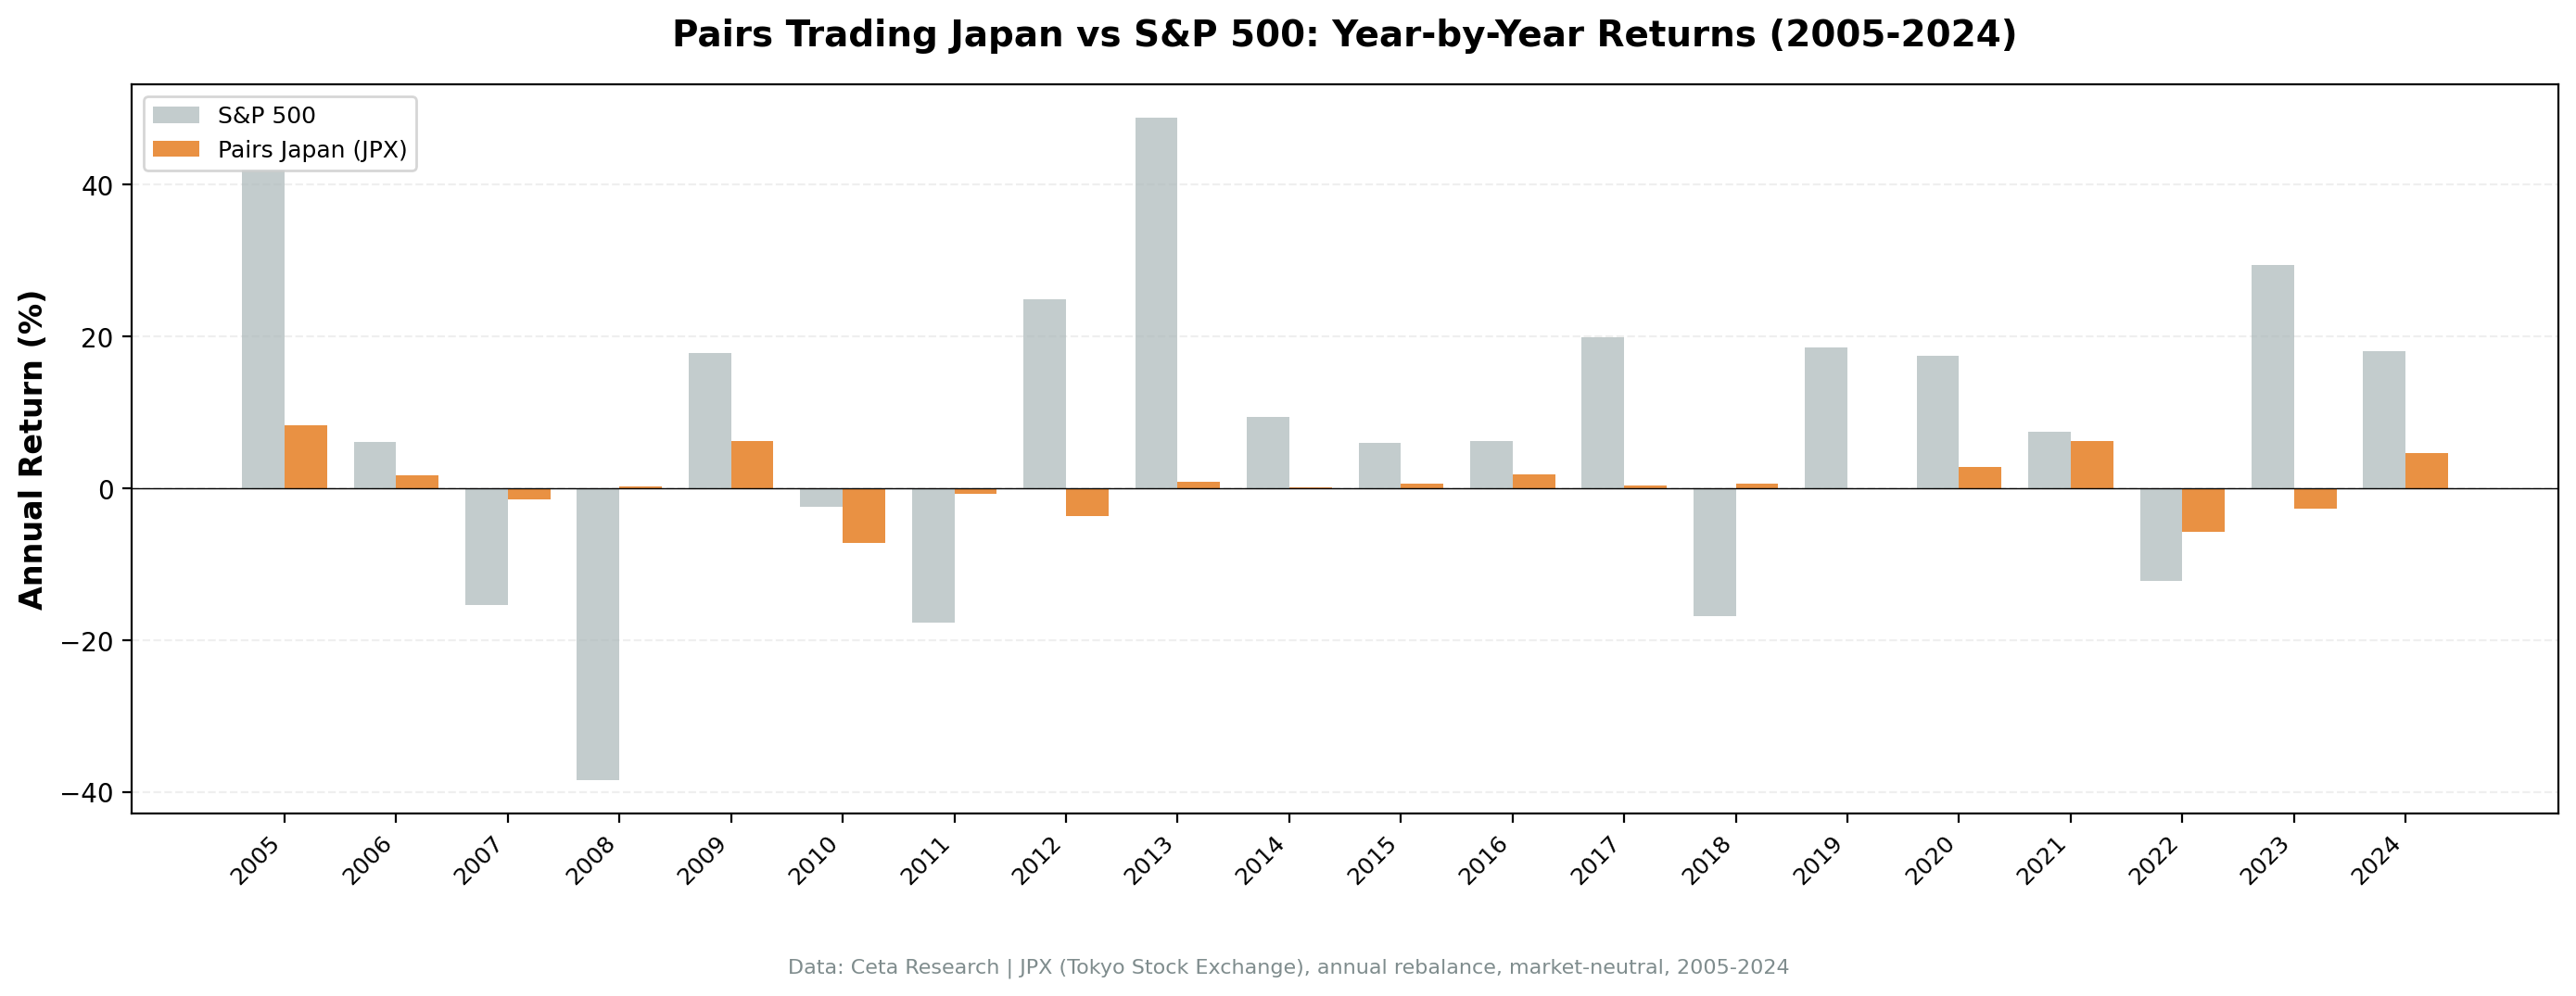
Annual returns:
| Year | Japan Pairs | Nikkei 225 | Excess |
|---|---|---|---|
| 2005 | +8.3% | +42.0% | -33.7% |
| 2006 | +1.7% | +6.1% | -4.3% |
| 2007 | -1.5% | -15.3% | +13.8% |
| 2008 | +0.3% | -38.5% | +38.8% |
| 2009 | +6.3% | +17.8% | -11.6% |
| 2010 | -7.2% | -2.4% | -4.8% |
| 2011 | -0.7% | -17.7% | +17.0% |
| 2012 | -3.6% | +24.9% | -28.5% |
| 2013 | +0.9% | +48.9% | -48.0% |
| 2014 | +0.1% | +9.4% | -9.3% |
| 2015 | +0.6% | +6.0% | -5.4% |
| 2016 | +1.9% | +6.2% | -4.3% |
| 2017 | +0.4% | +20.0% | -19.6% |
| 2018 | +0.7% | -16.8% | +17.4% |
| 2019 | 0% (cash) | +18.6% | -18.6% |
| 2020 | +2.8% | +17.5% | -14.6% |
| 2021 | +6.3% | +7.5% | -1.2% |
| 2022 | -5.7% | -12.2% | +6.5% |
| 2023 | -2.7% | +29.4% | -32.1% |
| 2024 | +4.7% | +18.1% | -13.4% |
Positive excess vs the Nikkei in five years: 2007 (+13.8%), 2008 (+38.8%), 2011 (+17.0%), 2018 (+17.4%), and 2022 (+6.5%). All five were years the Nikkei fell. This is the market-neutral property: when Japanese equities crash, offsetting long/short positions hold up. Win rate vs Nikkei: 25% (5 of 20 years), compared to 15% for the US strategy vs SPY.
Only one cash period (2019), where only 2 pairs met the z-score threshold. Every other year, Japan had 3 or more active pairs.
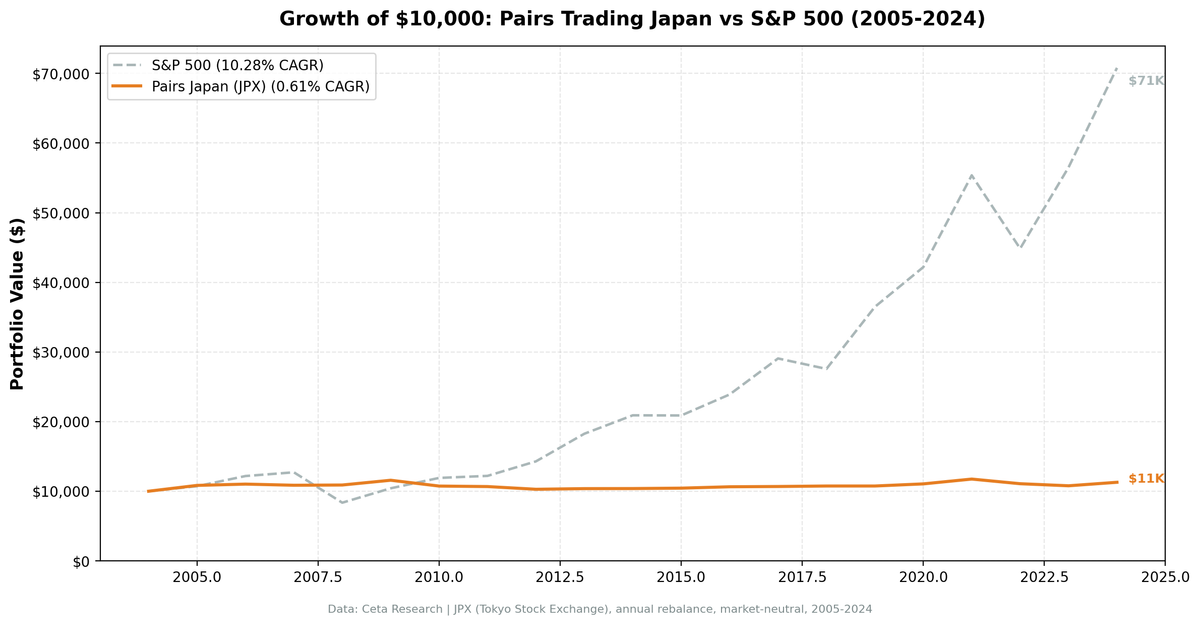
The Charts
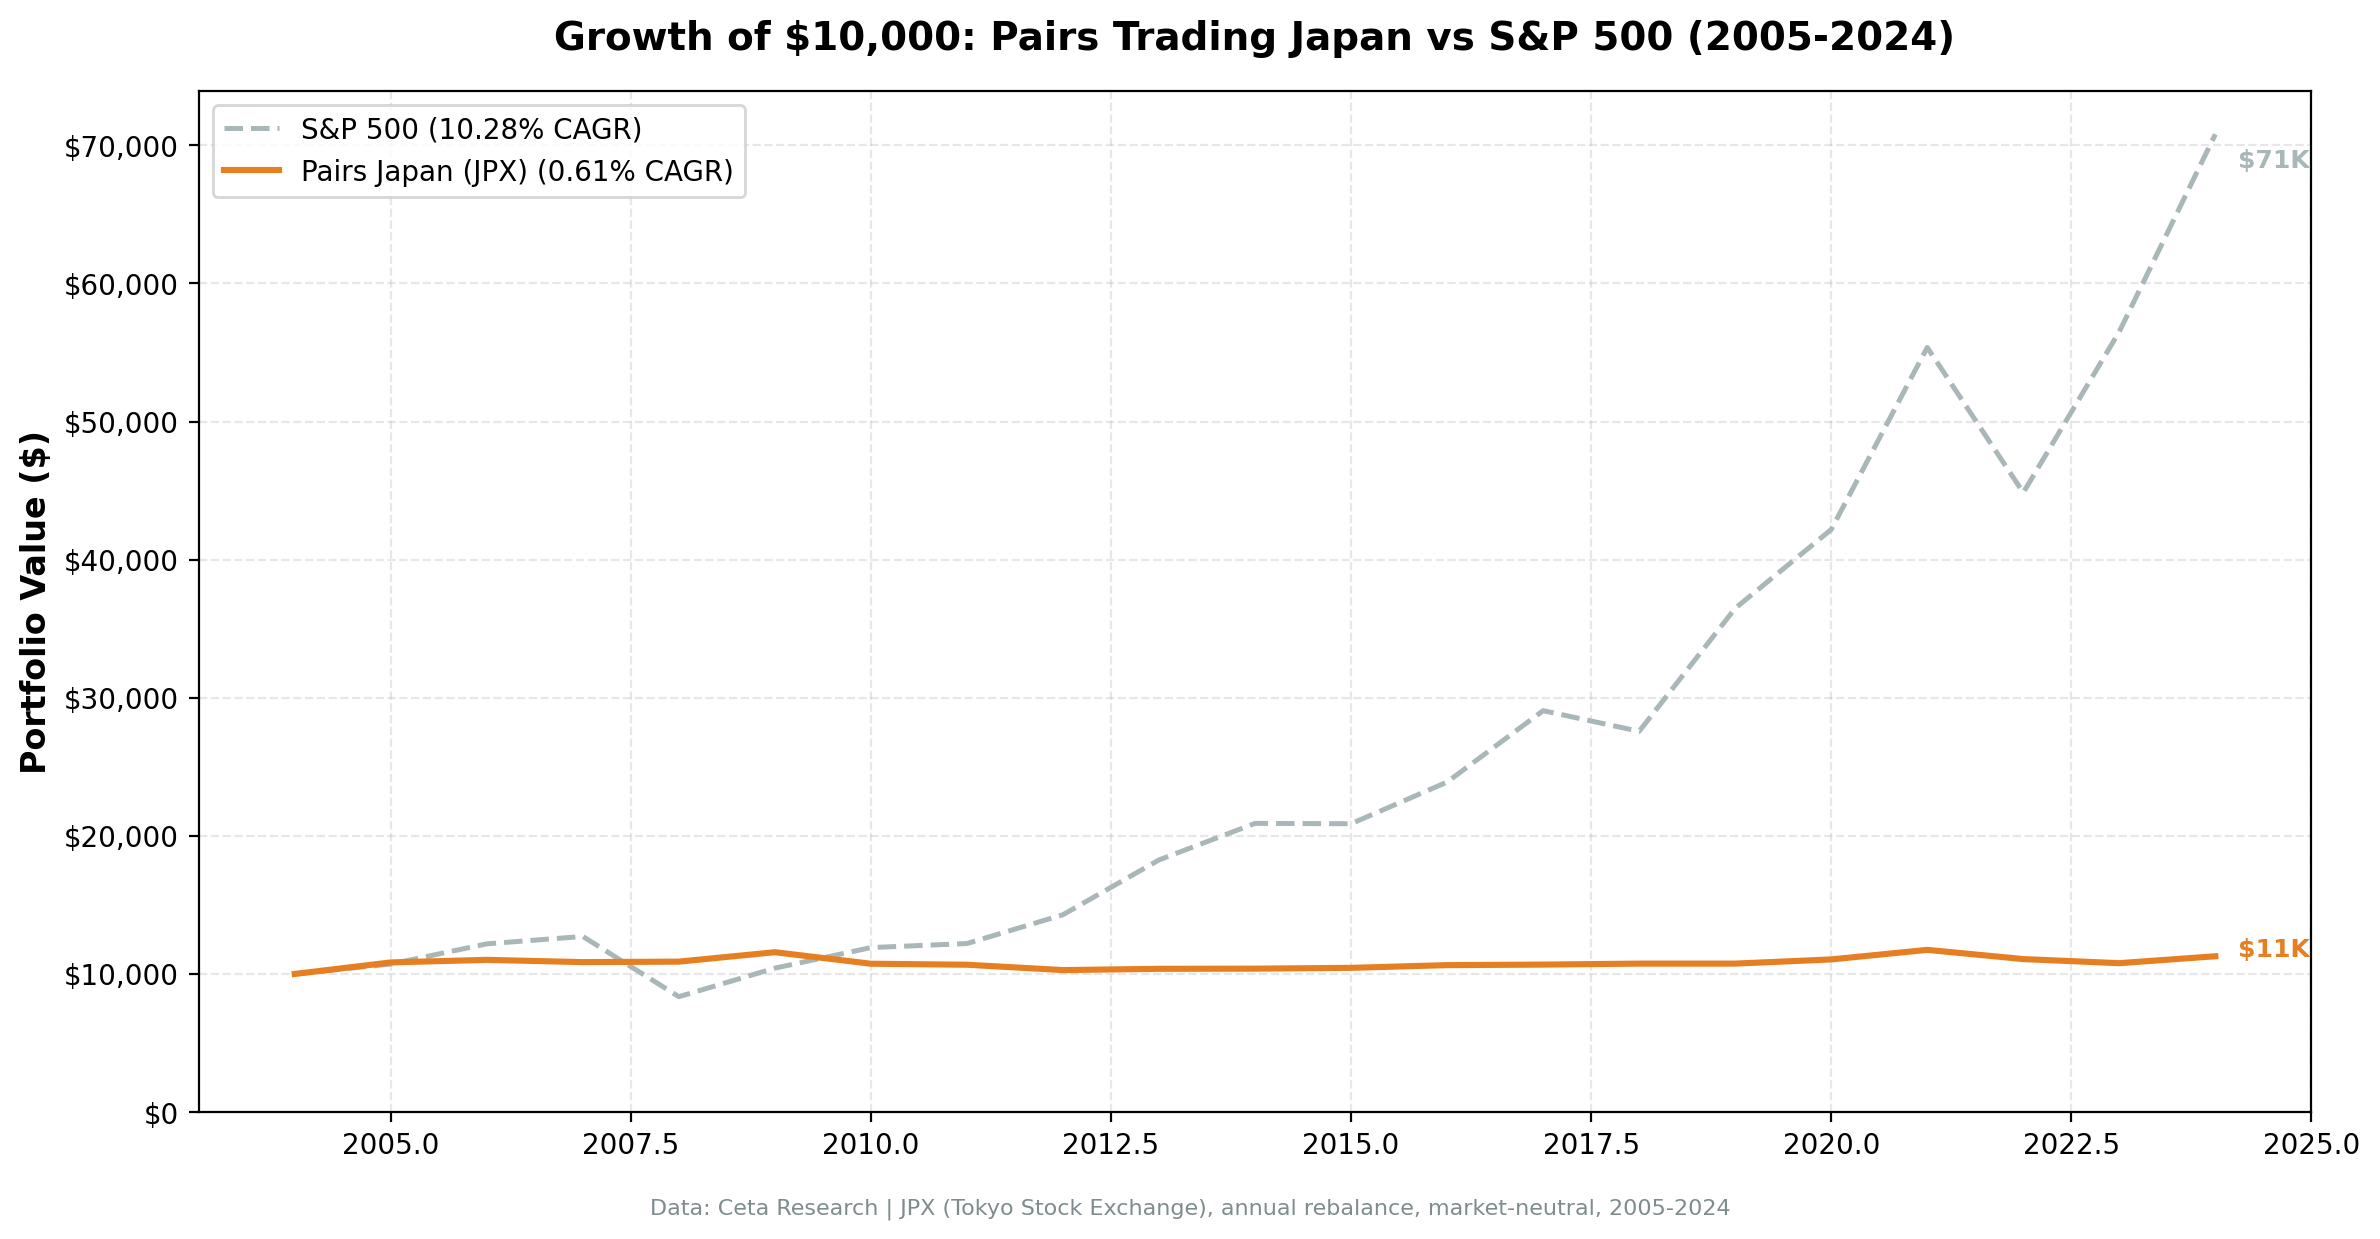
$10,000 in Japan pairs grew to $11,284 over 20 years. The Nikkei grew to approximately $34,200 over the same period. The pairs portfolio is mostly flat — but it's flat with low volatility and near-zero equity beta.
Japan's best years for the pairs strategy are equity markets' worst years (2008, 2018, 2022). Most bull market years show modest positive returns rather than the full cash periods seen in the US.
Why Japan Works Better
The Japan data raises an obvious question: what's structurally different about JPX that produces higher investment rates and the only positive Sharpe across 12 exchanges?
Keiretsu cross-shareholding. Japan's corporate structure involves extensive cross-shareholding between related companies through keiretsu networks. Toyota and its suppliers. Mitsubishi Group members across banking, trading, and manufacturing. Sony and its component suppliers. These companies hold shares in each other and have interlocking directorates.
This creates stable, economically grounded correlations between related stocks. When Toyota's stock moves, its tier-1 suppliers move similarly — not just because of market beta, but because of genuine shared business exposure. The spread between two keiretsu-linked companies is more likely to mean-revert than a random pair that happened to correlate over a one-year period.
Higher intra-sector correlation generally. Japan's economy is characterized by large conglomerate groups operating across related industries. The financial, automotive, electronics, and materials sectors all have deep intra-sector linkages. This produces more pairs that meet the 0.70 correlation threshold in any given year.
Lower market efficiency in some sectors. Japan has historically lagged the US in institutional adoption of quantitative strategies. Some of the arbitrage that algorithmic funds compressed in the US market by 2005 may have persisted longer in Japan.
Lower cash periods. US had 30% cash periods (6/20 years). Japan had 5% (1/20 years). Japan consistently generated enough qualifying pairs to be invested. The z-score threshold was met almost every year.
The Benchmark Comparison
Japan's pairs portfolio (0.61% CAGR) still dramatically underperforms the Nikkei 225 (6.33% CAGR, 2005-2024). But that comparison isn't quite right for a market-neutral strategy.
A pairs strategy in Japan is not meant to compete with buying and holding Japanese equities.
The relevant comparison is: 1. vs T-bills: Japan averaged ~0.1% short-term rates over this period (near-zero policy rates throughout). Against T-bills, 0.61% looks better — it outperformed the risk-free rate by about 0.5% annually. 2. vs US pairs (-0.50% CAGR): Japan outperformed by 1.11% annually. 3. Sharpe ratio (+0.13 vs -0.81): Japan generated positive risk-adjusted return. The US didn't.
None of these make Japan pairs trading look like a compelling standalone strategy. But as a market-neutral sleeve in a larger portfolio, Japan's consistency and positive Sharpe are meaningful compared to the global picture.
Limitations
Currency effects. Returns are computed in local currency (JPY) and compared to SPY in USD. During periods of yen depreciation (2013-2015, 2022-2024), a USD investor would have earned less. Yen appreciation (2008-2012) would have added returns. Currency effects are not modeled.
Short-selling. Japanese short-selling is generally permitted for large-cap stocks but can be restricted during market stress periods. Borrowing costs are not separately modeled.
Survivorship bias. Currently active JPX stocks only. Companies delisted during the period are excluded.
Keiretsu relationships evolve. Cross-shareholding arrangements have been gradually unwinding since the 1990s. Future Japan correlations may be weaker than historical ones as keiretsu structures continue to dissolve.
Takeaway
Japan is the best market for pairs trading across the 12 exchanges we tested. That doesn't mean it's a great standalone strategy — 0.61% CAGR is still well below any reasonable equity benchmark. But the structural reasons are real: keiretsu cross-shareholding creates stable, economically grounded correlations that make the strategy consistently investable.
The key metric is Sharpe ratio (+0.13 vs negative everywhere else) and investment rate (95% vs 70% in the US). Japan pairs trading does what the theory says it should: generate steady low-volatility returns that don't depend on equity market direction.
The global comparison blog covers all 12 exchanges side by side.
Data: Ceta Research, FMP warehouse, JPX stock_eod + profile + key_metrics Note: Past performance does not guarantee future results. This is educational content, not investment advice. Backtest code: github.com/ceta-research/backtests


