
China P/E Compression: -0.68% CAGR, -8.32% vs SPY
P/E compression on Chinese stocks delivers -0.68% CAGR vs 7.64% SPY, the worst absolute performance among all tested markets. Negative Sharpe and -63.70% max drawdown show P/E dynamics differ fundamentally in Chinese markets.

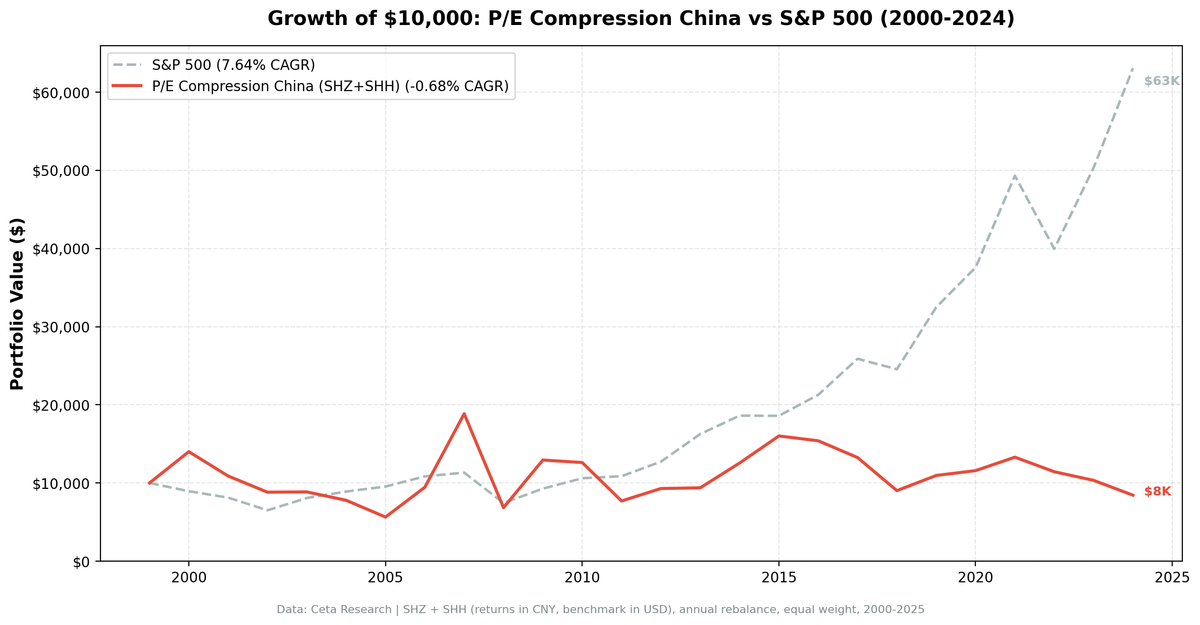
P/E compression on Chinese stocks delivers -0.68% CAGR, the worst absolute performance among all 21 tested markets. The strategy underperforms SPY by 8.32% annually with negative Sharpe ratio and -63.70% max drawdown. P/E dynamics differ fundamentally in Chinese markets: government policy, state ownership, and speculative trading make compressed multiples unreliable mean reversion signals.
Contents
Data: FMP financial data warehouse, 2000–2025. Updated March 2026.
Method
Universe: SHZ + SHH (Shanghai + Shenzhen), market cap > ¥10B Period: 2000-2025 (25 years) Benchmark: S&P 500 Total Return (SPY, USD)
Returns in CNY. Benchmark in USD.
What We Found

| Metric | China | S&P 500 |
|---|---|---|
| CAGR | -0.68% | 7.64% |
| Excess | -8.32% | - |
| Sharpe | -0.083 | 0.322 |
| MaxDD | -63.70% | -34.90% |
| Down-Cap | 84.76% | 100% |
| Avg Stocks | 23.9 | - |
| Cash | 0/25 | - |
Negative absolute CAGR means $10,000 shrank to $9,834 over 25 years. Negative Sharpe ratio. Max drawdown of -63.70% is catastrophic. This strategy failed completely.
Why China Is the Worst
Policy-driven markets. Chinese stocks move on government policy, not fundamentals. P/E compression can persist for years if policy doesn't favor the sector.
State ownership. Many Chinese companies are state-owned enterprises with unclear governance. P/E compression often reflects genuine concern about capital allocation and shareholder treatment.
Speculative trading. Chinese retail investors drive massive volatility. P/E ratios swing based on momentum and speculation, not earnings expectations.
Earnings quality. Financial reporting in China is less reliable. A compressed P/E may reflect skepticism about reported earnings, not temporary undervaluation.
Conclusion
China's P/E compression strategy delivers -0.68% CAGR, the worst absolute return among all tested markets. Underperformance of 8.32% annually shows the signal doesn't work when policy, governance, and speculative trading dominate pricing. Mean reversion requires stable, predictable P/E dynamics. China doesn't provide that.
Data: Ceta Research. Returns in CNY. github.com/ceta-research/backtests
Past performance does not guarantee future results. This is educational content, not investment advice.


