
P/E Compression in Germany: When Cyclicals Get Cheap for a Reason

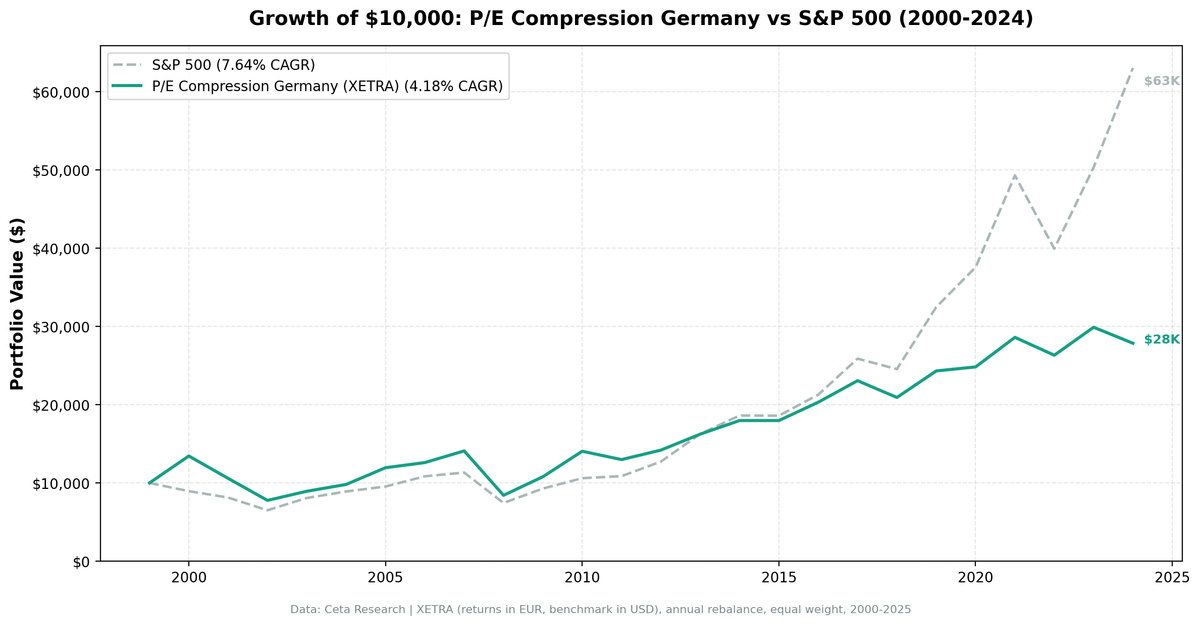
We ran our P/E compression screen on XETRA (Deutsche Boerse) for 25 years. The strategy returned 4.18% annually vs 7.64% for the S&P 500. That's -3.46% per year in excess return, with a win rate of 28%, meaning the screen underperformed in 18 of 25 years. The portfolio never ran out of qualifying stocks, but that turned out to matter less than why German stocks were getting cheap.
Contents
- Method
- The Strategy
- Screen
- Results
- When It Works
- When It Fails
- Why P/E Compression Struggles on XETRA
- Full Annual Returns
- Limitations
- Run It Yourself
- Part of a Series
Method
- Data source: Ceta Research (FMP financial data warehouse)
- Universe: XETRA (Deutsche Boerse), market cap > €500M
- Period: 2000-2025 (25 annual rebalance periods)
- Rebalancing: Annual (January), equal weight top 30 by compression score
- Benchmark: S&P 500 Total Return (SPY)
- Cash rule: Hold cash if fewer than 10 stocks qualify
- Transaction costs: Size-tiered model
- Currency note: Returns are in EUR (local currency). Benchmark is SPY in USD.
Historical financial data with 45-day lag to prevent look-ahead bias. Full methodology: backtests/METHODOLOGY.md
The Strategy
Same signal as the US, UK, and Canada screens: find XETRA-listed stocks where the current annual P/E has compressed 15%+ below the company's own 5-year historical average, with quality filters confirming the business hasn't deteriorated.
| Criterion | Threshold |
|---|---|
| P/E compression | Current P/E < 85% of 5-year average |
| P/E range | 5 – 40 |
| Return on equity | > 10% |
| Debt-to-equity | < 2.0 |
| Market cap | > €500M |
| PE history | 3+ prior annual data points |
Ranking: Top 30 by most compressed (lowest current/average ratio), equal weight.
Screen
WITH fy_pe AS (
 SELECT r.symbol, r.priceToEarningsRatio AS pe, r.dateEpoch,
 ROW_NUMBER() OVER (PARTITION BY r.symbol ORDER BY r.dateEpoch DESC) AS rn,
 AVG(r.priceToEarningsRatio) OVER (
 PARTITION BY r.symbol ORDER BY r.dateEpoch
 ROWS BETWEEN 5 PRECEDING AND 1 PRECEDING
 ) AS avg_pe_5yr,
 COUNT(r.priceToEarningsRatio) OVER (
 PARTITION BY r.symbol ORDER BY r.dateEpoch
 ROWS BETWEEN 5 PRECEDING AND 1 PRECEDING
 ) AS n_prior
 FROM financial_ratios r
 JOIN profile p ON r.symbol = p.symbol
 WHERE r.period = 'FY' AND r.priceToEarningsRatio > 0 AND r.priceToEarningsRatio < 100
 AND p.exchange = 'XETRA'
)
SELECT f.symbol, p.companyName, p.sector,
 ROUND(f.pe, 2) AS current_fy_pe,
 ROUND(f.avg_pe_5yr, 2) AS pe_5yr_avg,
 ROUND(f.pe / f.avg_pe_5yr, 3) AS pe_ratio_to_avg,
 ROUND((1 - f.pe / f.avg_pe_5yr) * 100, 1) AS compression_pct,
 ROUND(k.returnOnEquityTTM * 100, 1) AS roe_pct,
 ROUND(f2.debtToEquityRatioTTM, 2) AS debt_to_equity,
 ROUND(k.marketCap / 1e9, 2) AS mktcap_b
FROM fy_pe f
JOIN key_metrics_ttm k ON f.symbol = k.symbol
JOIN financial_ratios_ttm f2 ON f.symbol = f2.symbol
JOIN profile p ON f.symbol = p.symbol
WHERE f.rn = 1
 AND f.avg_pe_5yr IS NOT NULL
 AND f.n_prior >= 3
 AND f.pe > 5
 AND f.pe < 40
 AND f.pe / f.avg_pe_5yr < 0.85
 AND k.returnOnEquityTTM > 0.10
 AND (f2.debtToEquityRatioTTM IS NULL OR (f2.debtToEquityRatioTTM >= 0 AND f2.debtToEquityRatioTTM < 2.0))
 AND k.marketCap > 500000000
ORDER BY f.pe / f.avg_pe_5yr ASC
LIMIT 30
Results
| Metric | Portfolio | S&P 500 |
|---|---|---|
| CAGR | 4.18% | 7.64% |
| Total Return | 178.6% | 530.7% |
| Max Drawdown | -42.21% | -34.90% |
| Volatility (ann.) | 17.68% | 17.51% |
| Sharpe Ratio | 0.123 | 0.322 |
| Sortino Ratio | 0.183 | — |
| Beta | 0.664 | 1.00 |
| Alpha | -1.56% | — |
| Up Capture | 66.1% | — |
| Down Capture | 72.3% | — |
| Win Rate (vs SPY) | 28.0% | — |
| Cash Periods | 0/25 | — |
| Avg Stocks | 19.7 | — |
The portfolio never sat in cash. There were always enough qualifying German stocks. The issue wasn't scarcity of compressed P/Es, it was that those compressed P/Es often stayed compressed or fell further. A Sharpe ratio of 0.123 means the strategy barely cleared the risk-free rate on a risk-adjusted basis. The down capture of 72.3% is also worse than the US version (68.6%), meaning Germany offered no defensive benefit during market selloffs.
When It Works
Germany had genuine bright spots, mostly in its first few years and in the post-crisis recovery.
| Year | Portfolio | S&P 500 | Excess |
|---|---|---|---|
| 2000 | +34.5% | -10.5% | +45.0% |
| 2005 | +21.9% | +7.2% | +14.7% |
| 2007 | +11.8% | +4.4% | +7.4% |
| 2009 | +28.2% | +24.7% | +3.4% |
| 2010 | +30.2% | +14.3% | +15.9% |
| 2022 | -8.0% | -19.0% | +11.0% |
2000 was exceptional. The dot-com bust hammered US technology, while German industrials and exporters with compressed P/Es held up well, +45.0% excess return in a single year. 2010 also worked cleanly, with post-crisis industrial recovery lifting the portfolio.
2022 produced the second-best excess return (+11.0%), with German value stocks absorbing less of the rate-driven selloff than high-multiple US tech.
When It Fails
The failure years are more numerous and more severe.
| Year | Portfolio | S&P 500 | Excess |
|---|---|---|---|
| 2001 | -21.3% | -9.2% | -12.1% |
| 2002 | -26.6% | -19.9% | -6.7% |
| 2008 | -40.3% | -34.3% | -6.0% |
| 2013 | +14.4% | +27.8% | -13.4% |
| 2019 | +16.2% | +32.3% | -16.1% |
| 2024 | -6.8% | +25.3% | -32.1% |
2024 was the worst single year in the entire 25-year run: -32.1% excess. The German economy was navigating energy costs, industrial slowdown, and China demand weakness simultaneously. A compressed P/E on a German exporter reflected that reality accurately. The stock wasn't cheap relative to its history because the market was wrong. It was cheap because its forward earnings were genuinely lower.
The 2001-2002 stretch also shows the limits. Two consecutive years of underperformance during a prolonged market drawdown, with no defensive benefit.
Why P/E Compression Struggles on XETRA
German-listed equities are structurally different from US or even UK stocks.
XETRA is dominated by industrials, chemicals, auto manufacturers, and export-driven conglomerates. Companies like BASF, BMW, Siemens, and Volkswagen have P/Es that compress and expand with the global business cycle, Chinese demand, and euro-dollar dynamics. Not primarily with their own operational execution. When their P/Es compress, it's often because global demand conditions have shifted in a way that genuinely reduces their normalized earnings power.
The P/E compression signal works best when it captures sentiment-driven or sector-rotation-driven repricing: a quality business that got cheap because investors temporarily moved away from its sector, while the fundamentals remained intact. In the US, this pattern fires regularly. In Germany, many compressions are real. They reflect durable changes in the competitive or macro environment that take years to resolve.
The quality filters (ROE > 10%, D/E < 2) don't fully solve this. A German auto company can have 12% ROE and a D/E of 1.5 while its P/E compresses by 25%, because the market has correctly anticipated that Chinese EV competition and energy transition costs will structurally reduce future earnings. The screen sees a quality company at 85% of its historical multiple and interprets it as an opportunity. Often, it's a fair price for a harder future.
The energy crisis of 2021-2023 made this vivid. German industrials with high energy inputs saw their cost structures change permanently. The P/E compression was real information, not noise to be faded.
Full Annual Returns
| Year | Portfolio | S&P 500 | Excess |
|---|---|---|---|
| 2000 | +34.5% | -10.5% | +45.0% |
| 2001 | -21.3% | -9.2% | -12.1% |
| 2002 | -26.6% | -19.9% | -6.7% |
| 2003 | +15.1% | +24.1% | -9.1% |
| 2004 | +9.7% | +10.2% | -0.6% |
| 2005 | +21.9% | +7.2% | +14.7% |
| 2006 | +5.5% | +13.7% | -8.2% |
| 2007 | +11.8% | +4.4% | +7.4% |
| 2008 | -40.3% | -34.3% | -6.0% |
| 2009 | +28.2% | +24.7% | +3.4% |
| 2010 | +30.2% | +14.3% | +15.9% |
| 2011 | -7.6% | +2.5% | -10.1% |
| 2012 | +9.3% | +17.1% | -7.8% |
| 2013 | +14.4% | +27.8% | -13.4% |
| 2014 | +10.7% | +14.5% | -3.8% |
| 2015 | 0.0% | -0.1% | +0.1% |
| 2016 | +13.0% | +14.4% | -1.4% |
| 2017 | +13.6% | +21.6% | -8.1% |
| 2018 | -9.3% | -5.2% | -4.2% |
| 2019 | +16.2% | +32.3% | -16.1% |
| 2020 | +2.1% | +15.6% | -13.5% |
| 2021 | +15.2% | +31.3% | -16.0% |
| 2022 | -8.0% | -19.0% | +11.0% |
| 2023 | +13.6% | +26.0% | -12.4% |
| 2024 | -6.8% | +25.3% | -32.1% |
Limitations
Structural market composition. XETRA's heavy weighting toward industrials, chemicals, and autos means the portfolio rarely holds defensive businesses. Compression in these sectors often reflects genuine earnings risk, not temporary sentiment.
Currency comparison. Returns are in EUR. The SPY benchmark is in USD. EUR/USD movements affect relative performance independent of the strategy's actual stock selection quality.
Macro sensitivity. Germany's export-dependent economy means P/E compression often coincides with periods of genuine fundamental deterioration (energy prices, China demand, geopolitical friction). The filters don't screen out macro-driven value traps.
Single-year dominance. Without 2000's +34.5% gain, the cumulative picture would be meaningfully worse. One exceptional year creates the illusion of a longer-term edge that the data doesn't fully support.
Run It Yourself
git clone https://github.com/ceta-research/backtests.git
cd backtests

python3 pe-compression/backtest.py --preset germany --output results.json --verbose
python3 pe-compression/screen.py --preset germany
Part of a Series
- Global comparison. How the strategy performs across 19 markets and why the East-West divide matters
- US analysis, 9.97% CAGR, +2.32% excess, 68.6% down capture
- UK analysis, +1.38% excess with 59.7% down capture
- Canada analysis. The defensiveness story: 23.7% down capture
Run It Yourself
Explore the data behind this analysis on Ceta Research. Query our financial data warehouse with SQL, build custom screens, and run your own backtests across 70,000+ stocks on 20 exchanges.
Data: Ceta Research (FMP financial data warehouse), 2000-2025. Universe: XETRA. Returns in EUR. Benchmark: SPY (USD). Full methodology: METHODOLOGY.md. Past performance doesn't guarantee future results.


