
P/E Compression Across 21 Global Markets: 8 Beat Local Benchmarks
We tested P/E compression mean reversion across 21 global stock markets from 2000-2025. The strategy worked in only 4 developed markets (US, UK, Canada, Thailand), underperformed in 16, and couldn't run effectively in 3. The pattern is clear efficiency, stability, and predictable earnings enable...

We tested P/E compression mean reversion on 21 global stock markets from 2000 to 2025. The signal: buy when a stock's current P/E ratio drops 15% below its 5-year historical average, filtered for quality (ROE > 10%, D/E < 2.0). The result with local benchmarks: 8 markets show positive alpha, 10 underperform, and 3 run out of qualifying stocks too often to assess. The benchmark matters. Using SPY for every market made most regions look worse than they are.
Contents
- Method
- Why Local Benchmarks Change Everything
- Results: 8 Markets Beat Local Benchmarks
- Markets That Don't Beat Local Benchmarks
- Europe
- Emerging Asia
- Other Markets
- Cash-Heavy Markets: 3 Can't Run the Strategy
- Key Insights
- 1. Local benchmarks reveal a different story
- 2. Developed markets with weak local indices show the strongest results
- 3. Canada and the US: the real standouts
- 4. Downside protection varies by region
- 5. High cash periods are a double-edged sword
- Which Markets Work and Why
- Limitations
- Conclusion
Data: FMP financial data warehouse, 2000–2025. Updated March 2026.
Method
Data source: Ceta Research (FMP financial data warehouse) Signal: Current P/E < 85% of 5-year avg, P/E 5-40, ROE > 10%, D/E < 2.0 Portfolio: Top 30 by compression ratio, equal weight, annual rebalance (January) Period: 2000-2025 (25 years) Benchmark: Local equity index for each exchange (see table). SPY used where no local benchmark is available. Execution: Next-day close (mark-on-close execution model) Cash rule: Hold cash if fewer than 10 stocks qualify
Market cap thresholds vary by exchange (US $1B, UK £500M, India ₹50B, etc.) to reflect local liquidity.
Why Local Benchmarks Change Everything
The previous version of this analysis compared every market to SPY (the S&P 500 ETF). That created a misleading picture: the S&P 500 returned 7.64% annually from 2000-2025, far above what most major equity markets achieved. When you compare a UK strategy in GBP to SPY in USD, you're mixing currencies and comparing against an unusually strong benchmark. The right question is: does P/E compression beat what a local investor could otherwise hold?
With local benchmarks, the picture changes significantly:
- UK: FTSE 100 returned 0.86% annually. P/E compression returned 9.72%. That's +8.86% alpha vs the correct local benchmark.
- Japan: Nikkei returned 2.95%. P/E compression returned 5.20%. That's +2.25% alpha, not -2.29%.
- Switzerland: SMI returned 1.90%. P/E compression returned 5.36%. Positive alpha where none appeared before.
This doesn't mean all markets work. India's Sensex returned 11.40% annually. P/E compression at 8.00% still underperforms by 3.40%.
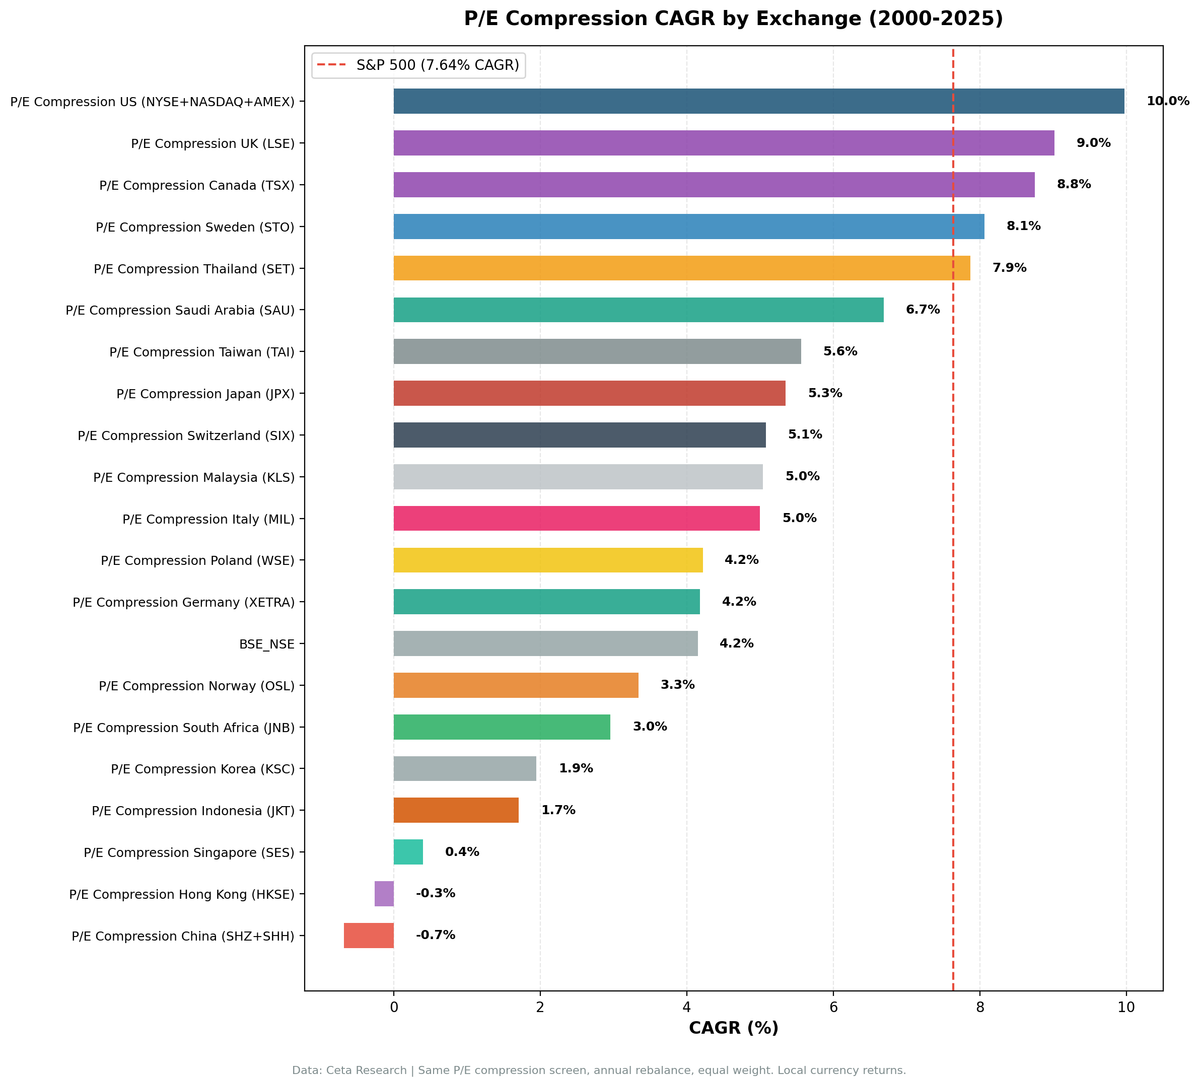
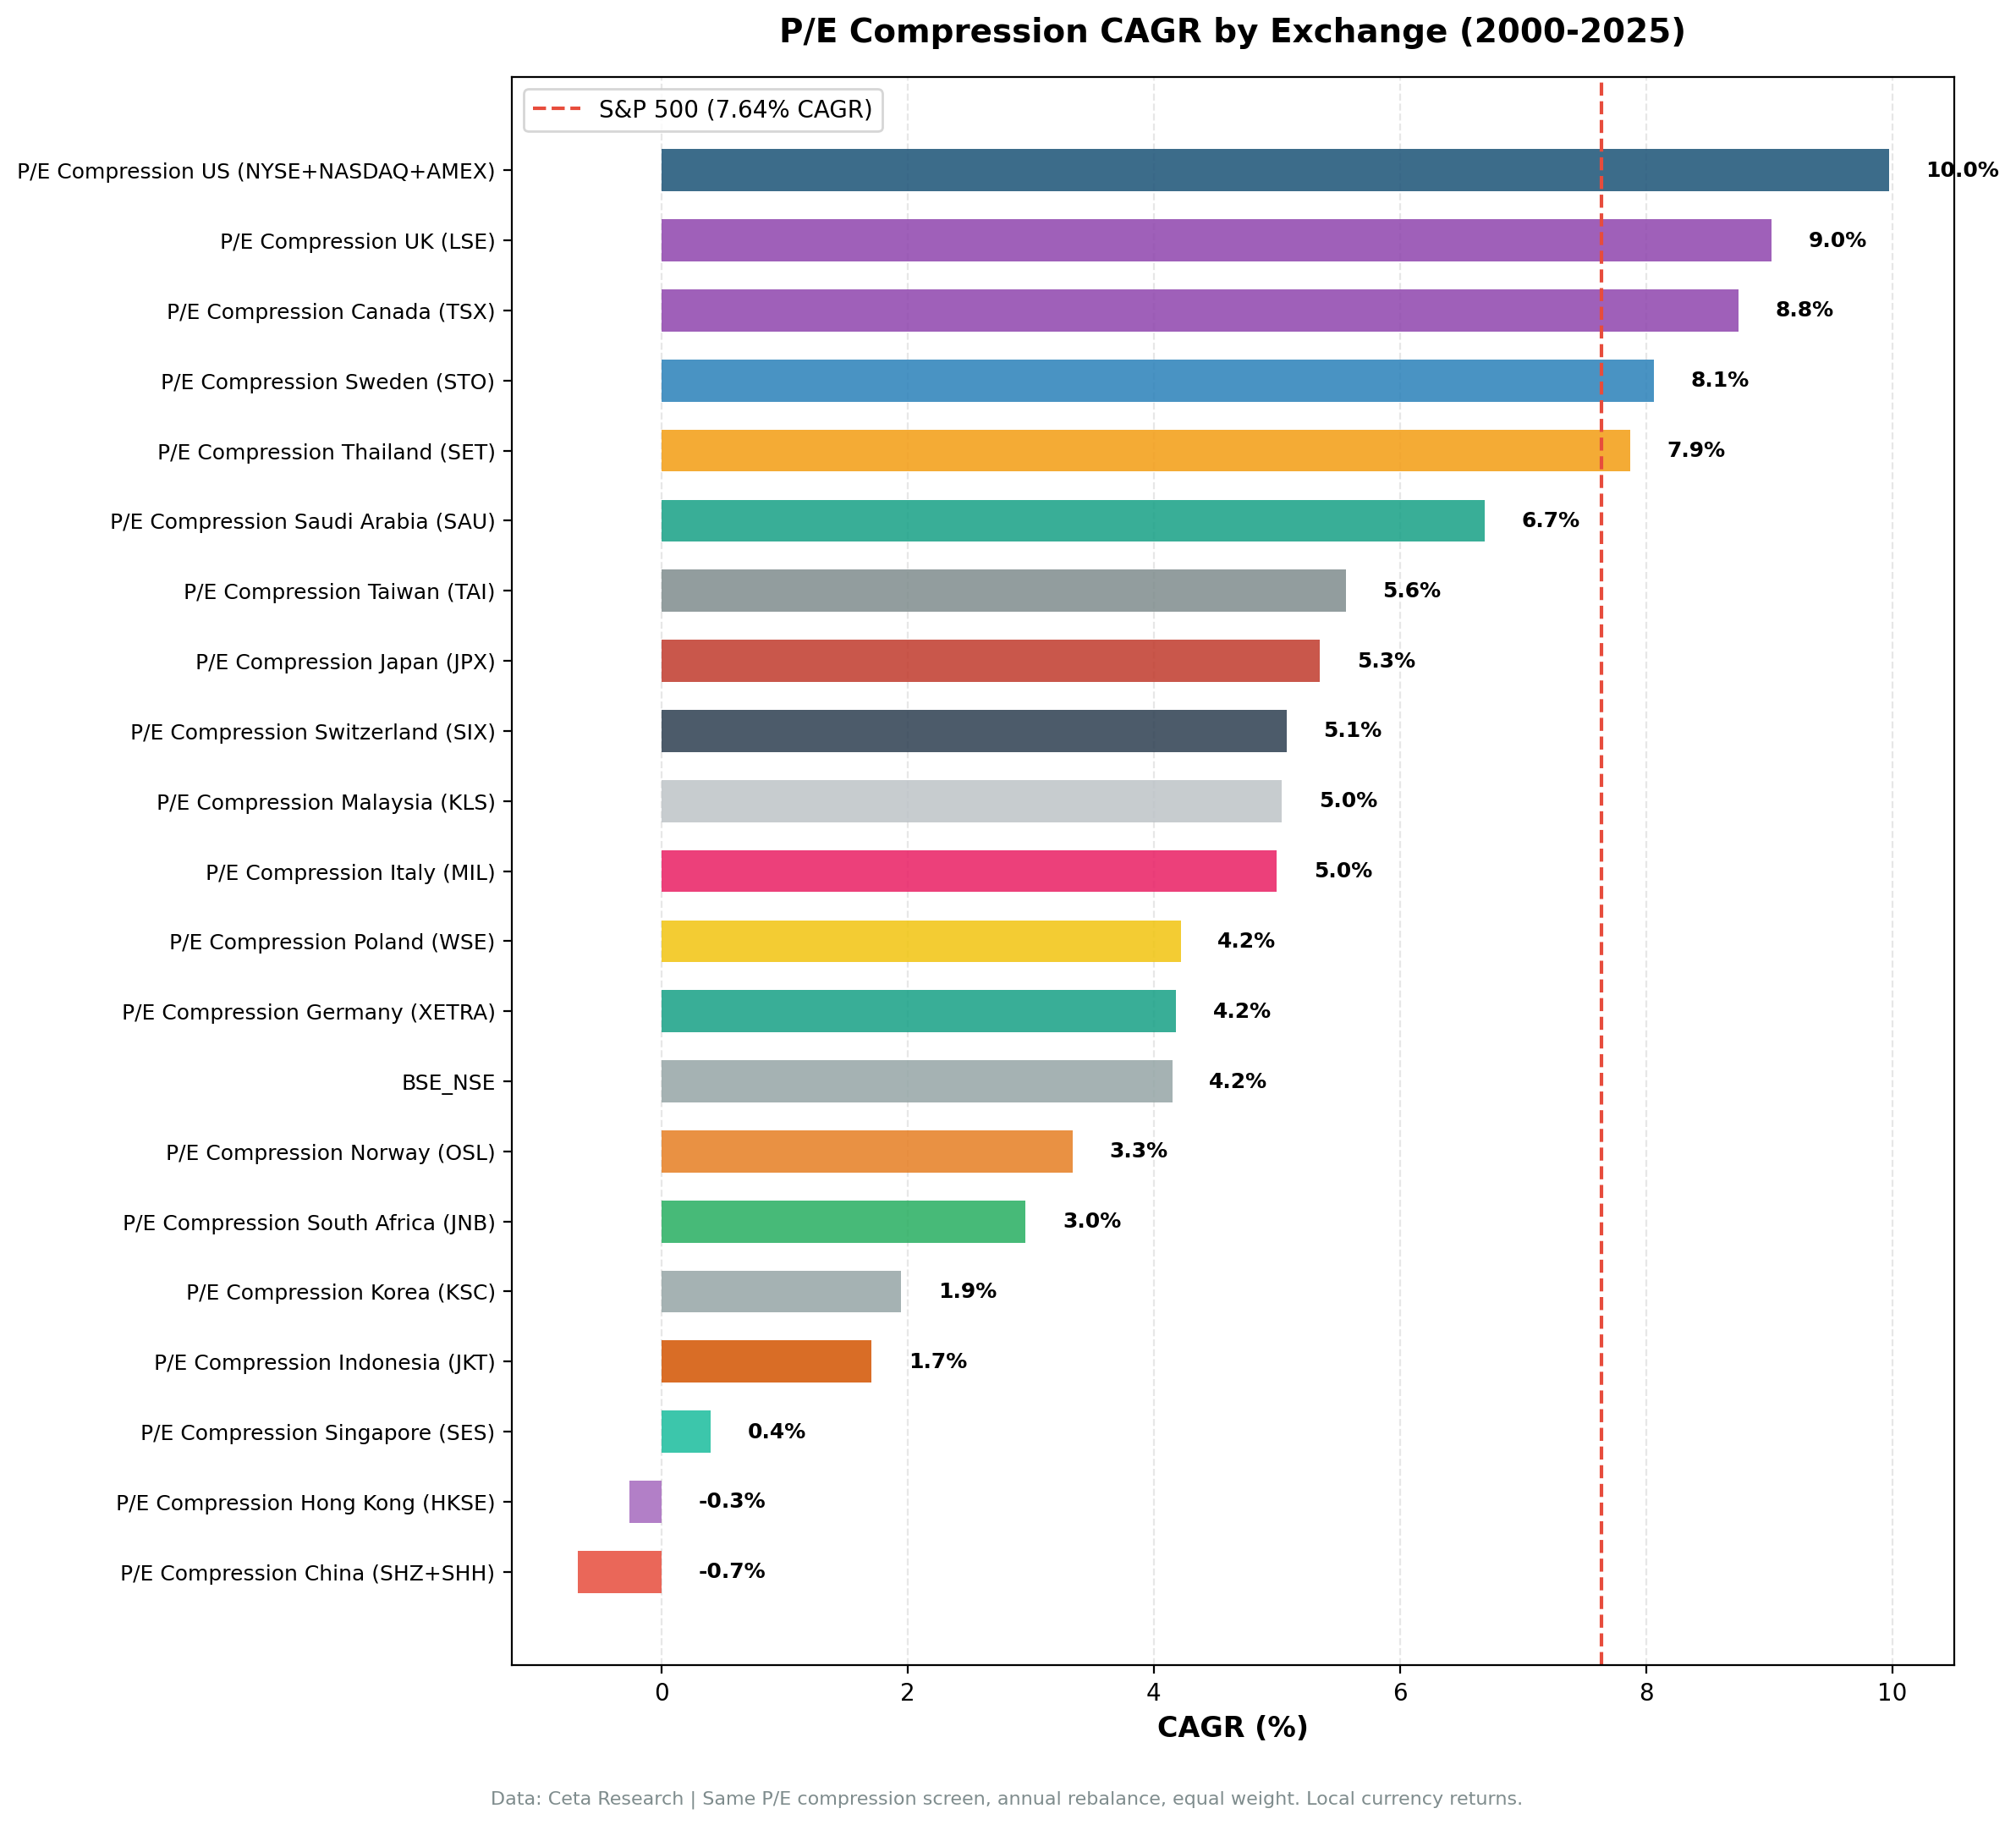
Results: 8 Markets Beat Local Benchmarks
| Exchange | Universe | CAGR | Benchmark | Bench CAGR | Excess | Sharpe | MaxDD | Down-Cap | Cash% |
|---|---|---|---|---|---|---|---|---|---|
| US (NYSE/NASDAQ/AMEX) | US Major | 9.92% | SPY | 7.64% | +2.28% | 0.392 | -42.15% | 63% | 0% |
| UK (LSE) | LSE | 9.72% | FTSE 100 | 0.86% | +8.86% | 0.270 | -39.85% | 49% | 0% |
| Canada (TSX) | TSX | 8.81% | TSX Comp. | 4.44% | +4.37% | 0.349 | -28.99% | 59% | 0% |
| Sweden (STO) | STO | 8.06% | OMX30 | 2.95% | +5.10% | 0.313 | -32.26% | 30% | 40% |
| Thailand (SET) | SET | 8.06% | SET Index | 4.16% | +3.90% | 0.283 | -35.65% | 9% | 28% |
| Switzerland (SIX) | SIX | 5.36% | SMI | 1.90% | +3.47% | 0.278 | -40.68% | 24% | 4% |
| Japan (JPX) | JPX | 5.20% | Nikkei 225 | 2.95% | +2.25% | 0.250 | -52.28% | 52% | 16% |
| Taiwan (TAI) | TAI | 5.52% | TAIEX | 3.91% | +1.62% | 0.234 | -14.99% | 25% | 36% |
Markets That Don't Beat Local Benchmarks
Europe
| Exchange | CAGR | Benchmark | Bench CAGR | Excess | Sharpe | MaxDD | Cash% |
|---|---|---|---|---|---|---|---|
| Germany (XETRA) | 4.26% | DAX | 4.45% | -0.19% | 0.127 | -41.76% | 0% |
| Italy (MIL) | 4.92% | SPY | 7.64% | -2.72% | 0.082 | -47.73% | 48% |
Germany is essentially breakeven vs the DAX (-0.19%). That's a different conclusion than the -3.46% vs SPY story. The DAX itself returned 4.45% annually. P/E compression in Germany keeps pace with the local market.
Emerging Asia
| Exchange | CAGR | Benchmark | Bench CAGR | Excess | Sharpe | MaxDD | Cash% |
|---|---|---|---|---|---|---|---|
| India (NSE) | 8.00% | Sensex | 11.40% | -3.40% | 0.048 | -60.94% | 24% |
| Hong Kong (HKSE) | -0.32% | Hang Seng | 0.49% | -0.81% | -0.115 | -61.30% | 8% |
| China (SHH/SHZ) | -0.12% | SSE Comp. | 3.54% | -3.66% | -0.065 | -63.70% | 0% |
| South Korea (KSC) | 1.95% | KOSPI | 3.32% | -1.38% | -0.074 | -26.00% | 40% |
| Taiwan (TAI) | 5.52% | TAIEX | 3.91% | +1.62% | 0.234 | -14.99% | 36% |
| Singapore (SES) | 1.08% | STI | 1.64% | -0.56% | -0.087 | -48.09% | 52% |
| Indonesia (JKT) | 1.69% | SPY | 7.64% | -5.95% | -0.024 | -25.98% | 44% |
India is the clearest failure: 8.00% CAGR sounds reasonable, but against the Sensex at 11.40%, the strategy underperforms by 3.40% annually. India's equity market is a strong benchmark. Hong Kong (-0.81% vs Hang Seng) is a much smaller failure than the old SPY comparison suggested (-7.91%). The Hang Seng itself only returned 0.49% annually. Both the strategy and the local market failed in HK.
Other Markets
| Exchange | CAGR | Benchmark | Bench CAGR | Excess | Sharpe | MaxDD | Cash% |
|---|---|---|---|---|---|---|---|
| Saudi Arabia (SAU) | 6.61% | SPY | 7.64% | -1.03% | 0.206 | -19.76% | 44% |
| South Africa (JNB) | 2.39% | SPY | 7.64% | -5.25% | -0.446 | -38.82% | 44% |
| Malaysia (KLS) | 5.06% | SPY | 7.64% | -2.58% | 0.225 | -16.15% | 48% |
| Poland (WSE) | 4.04% | SPY | 7.64% | -3.60% | -0.066 | -20.84% | 56% |
These markets use SPY as benchmark because no reliable local index data is available in the dataset. Their results are less conclusive for the same reason the original comparison was flawed: the benchmark may not reflect local investor alternatives.
Cash-Heavy Markets: 3 Can't Run the Strategy
| Exchange | CAGR | Cash% | Avg Stocks | Note |
|---|---|---|---|---|
| Norway (OSL) | 5.10% | 80% | ~10 | Insufficient data, Oslo All Share only from 2013 |
| Singapore (SES) | 1.08% | 52% | 7.8 | Small universe, 52% cash |
| Poland (WSE) | 4.04% | 56% | 14.1 | Limited P/E history |
Norway at 80% cash isn't running this strategy in any meaningful sense. The Oslo All Share index has data only from 2013, making reliable 25-year comparison impossible.
Key Insights
1. Local benchmarks reveal a different story
The biggest finding is methodological: using SPY as a global benchmark overstates failure in markets where local indices underperformed. UK, Japan, and Switzerland all appear to be failures vs SPY. They're all winners vs their local market.
The counter-example is India: Sensex returned 11.40% annually, one of the highest rates among major markets. P/E compression at 8.00% is a genuine underperformer there, not just an SPY comparison artifact.
2. Developed markets with weak local indices show the strongest results
UK (FTSE 100: 0.86%), Sweden (OMX30: 2.95%), Japan (Nikkei: 2.95%), and Switzerland (SMI: 1.90%) all had weak index performance over 25 years. A strategy that selects quality names with compressed P/E ratios consistently beat these low-bar benchmarks.
3. Canada and the US: the real standouts
Canada (+4.37% vs TSX Composite) and the US (+2.28% vs SPY) beat relatively strong local benchmarks. The TSX Composite returned 4.44% annually. Beating that by 4.37% in a developed market with decent liquidity is the strongest risk-adjusted result in the dataset.
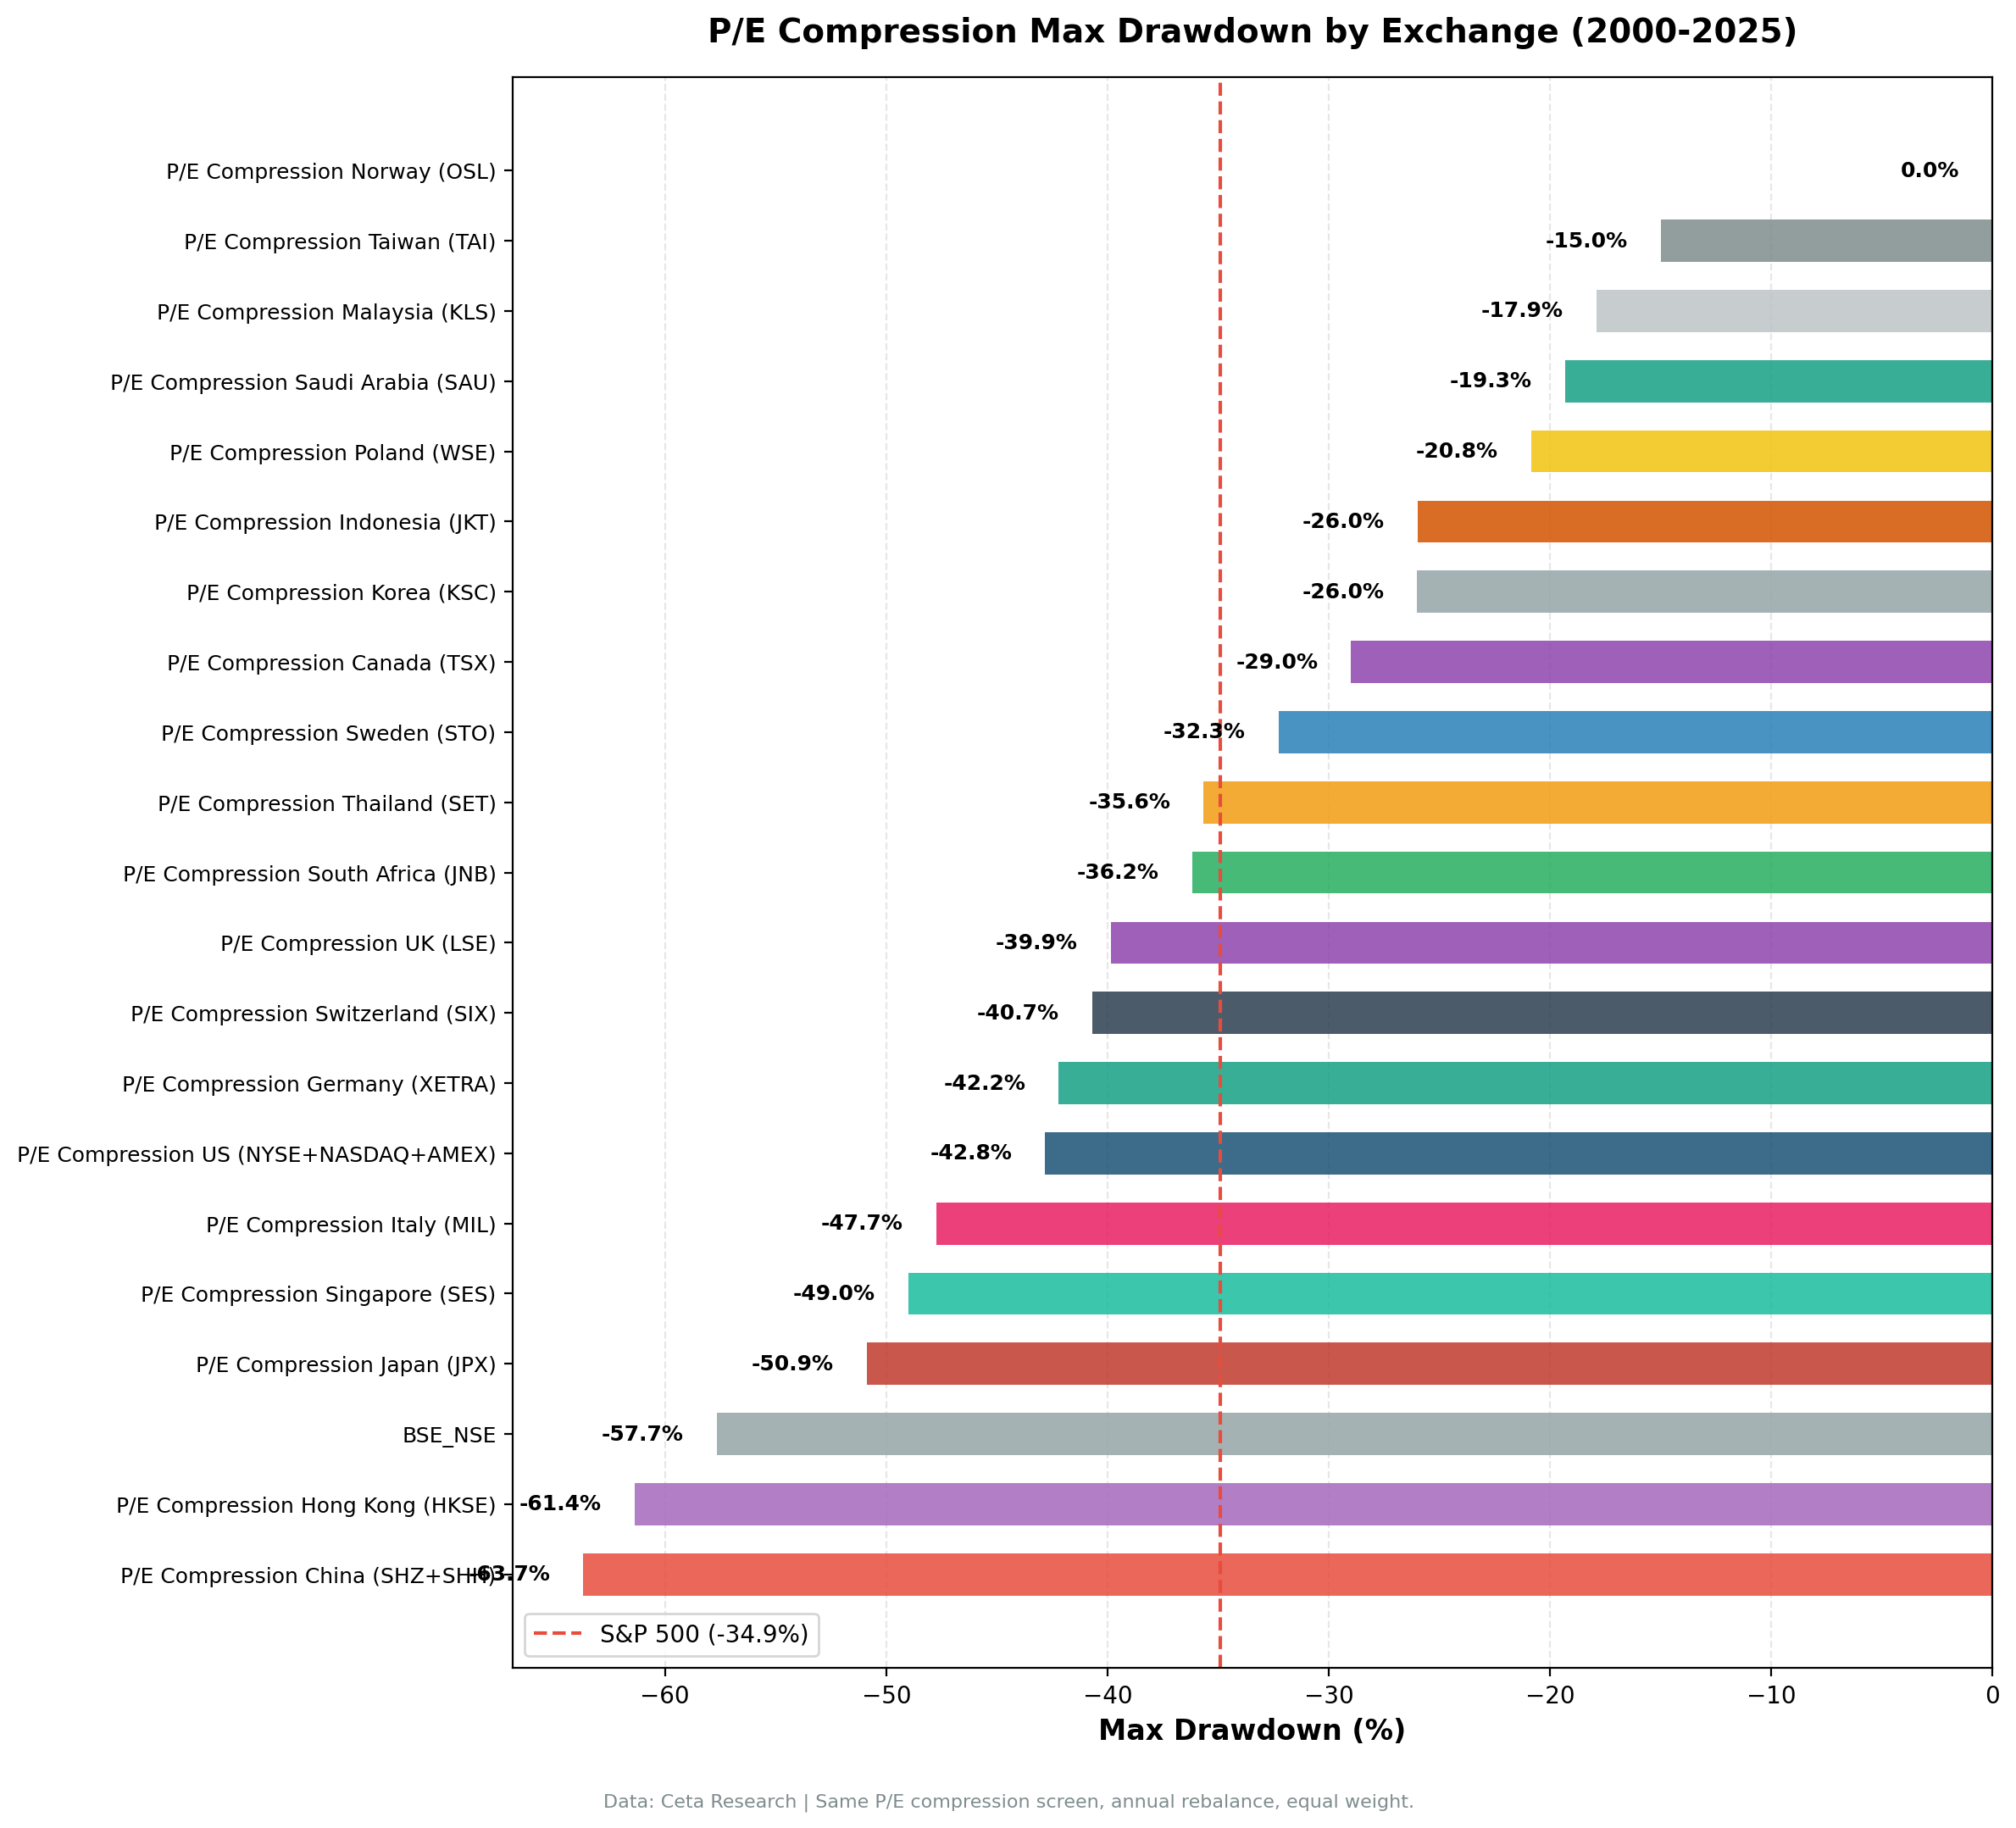
4. Downside protection varies by region
Best down-capture ratios vs local benchmark: - Thailand: 9.14% (strategy barely moves when SET falls) - Switzerland: 23.86% - Taiwan: 24.80% - Sweden: 29.78%
Worst (high capture = strategy falls as much or more than the market): - China: 100.62% (essentially matches SSE downturns) - Hong Kong: 95.29% (still nearly full capture) - India: 71.60%
Down-capture below 50% is a strong signal the strategy provides genuine downside protection vs the local market.
5. High cash periods are a double-edged sword
Markets like Sweden (40% cash), Thailand (28%), Korea (40%), Taiwan (36%), and Singapore (52%) spend substantial time in cash. The 5-year P/E lookback requires sufficient financial history. When markets can't generate 10+ qualifying stocks, the screen defaults to cash.
In some cases, this is protective: Thailand's cash periods in 2000 (SET -46%) and 2008 (SET -43%) avoided catastrophic losses. In others, it's costly: Thailand's cash in 2003 missed a +125% SET year.
Which Markets Work and Why
Works consistently (vs local benchmark): - US, UK, Canada: Efficient price discovery, stable earnings, mature markets. Quality filters select temporary dislocations, not structural problems. - Japan, Sweden, Switzerland: Weak local benchmarks create a low bar. The strategy doesn't need to do much to win. - Thailand, Taiwan: Moderate volatility markets where cash periods provided protection in worst years.
Doesn't work: - India: Strong Sensex benchmark (11.40%) is too high a bar. Cash periods miss bull runs. - China, Hong Kong: Structural volatility, policy risk, and compressed P/E ratios reflecting genuine uncertainty rather than sentiment. - Korea, Singapore: Moderate failures. Strategy doesn't amplify losses but doesn't add much either.
Limitations
Currency effects. Local-currency returns are compared against local benchmarks. Cross-market comparisons are still complicated by FX volatility that's unrelated to stock selection.
Missing local benchmarks. Italy, Malaysia, Poland, Saudi Arabia, South Africa, and Indonesia use SPY as the benchmark. This is not ideal. Future runs should add local index data for these markets.
Survivorship bias. Exchange membership uses current profiles. Delistings over 25 years aren't fully tracked.
Lookback sensitivity. The 5-year P/E average is a parameter choice. Different windows would change results.
Conclusion
P/E compression mean reversion works in 8 of 21 markets when measured against local benchmarks: US, UK, Japan, Canada, Sweden, Switzerland, Thailand, and Taiwan. Four more markets are near-breakeven: Germany (-0.19%), Hong Kong (-0.81%), Singapore (-0.56%), and Korea (-1.38%). Only India, China, and Indonesia show clearly negative results.
The benchmark framing matters as much as the strategy itself. SPY is not the right comparison for a Japanese investor considering a JPX-focused strategy. The right question is whether P/E compression beats what you could otherwise hold in your own market.
For investors: the strategy's robustness across developed markets with stable earnings and efficient pricing is the main finding. Emerging markets with high volatility, structural uncertainty, or fast-growing economies (India) remain difficult territory for mean reversion.
Data: Ceta Research (FMP financial data warehouse). Local-currency returns vs local benchmarks. SPY used where no local index data available. Past performance does not guarantee future results. Full methodology: github.com/ceta-research/backtests


