
India P/E Compression: 8% CAGR but Lags Sensex by 3.40% Annually
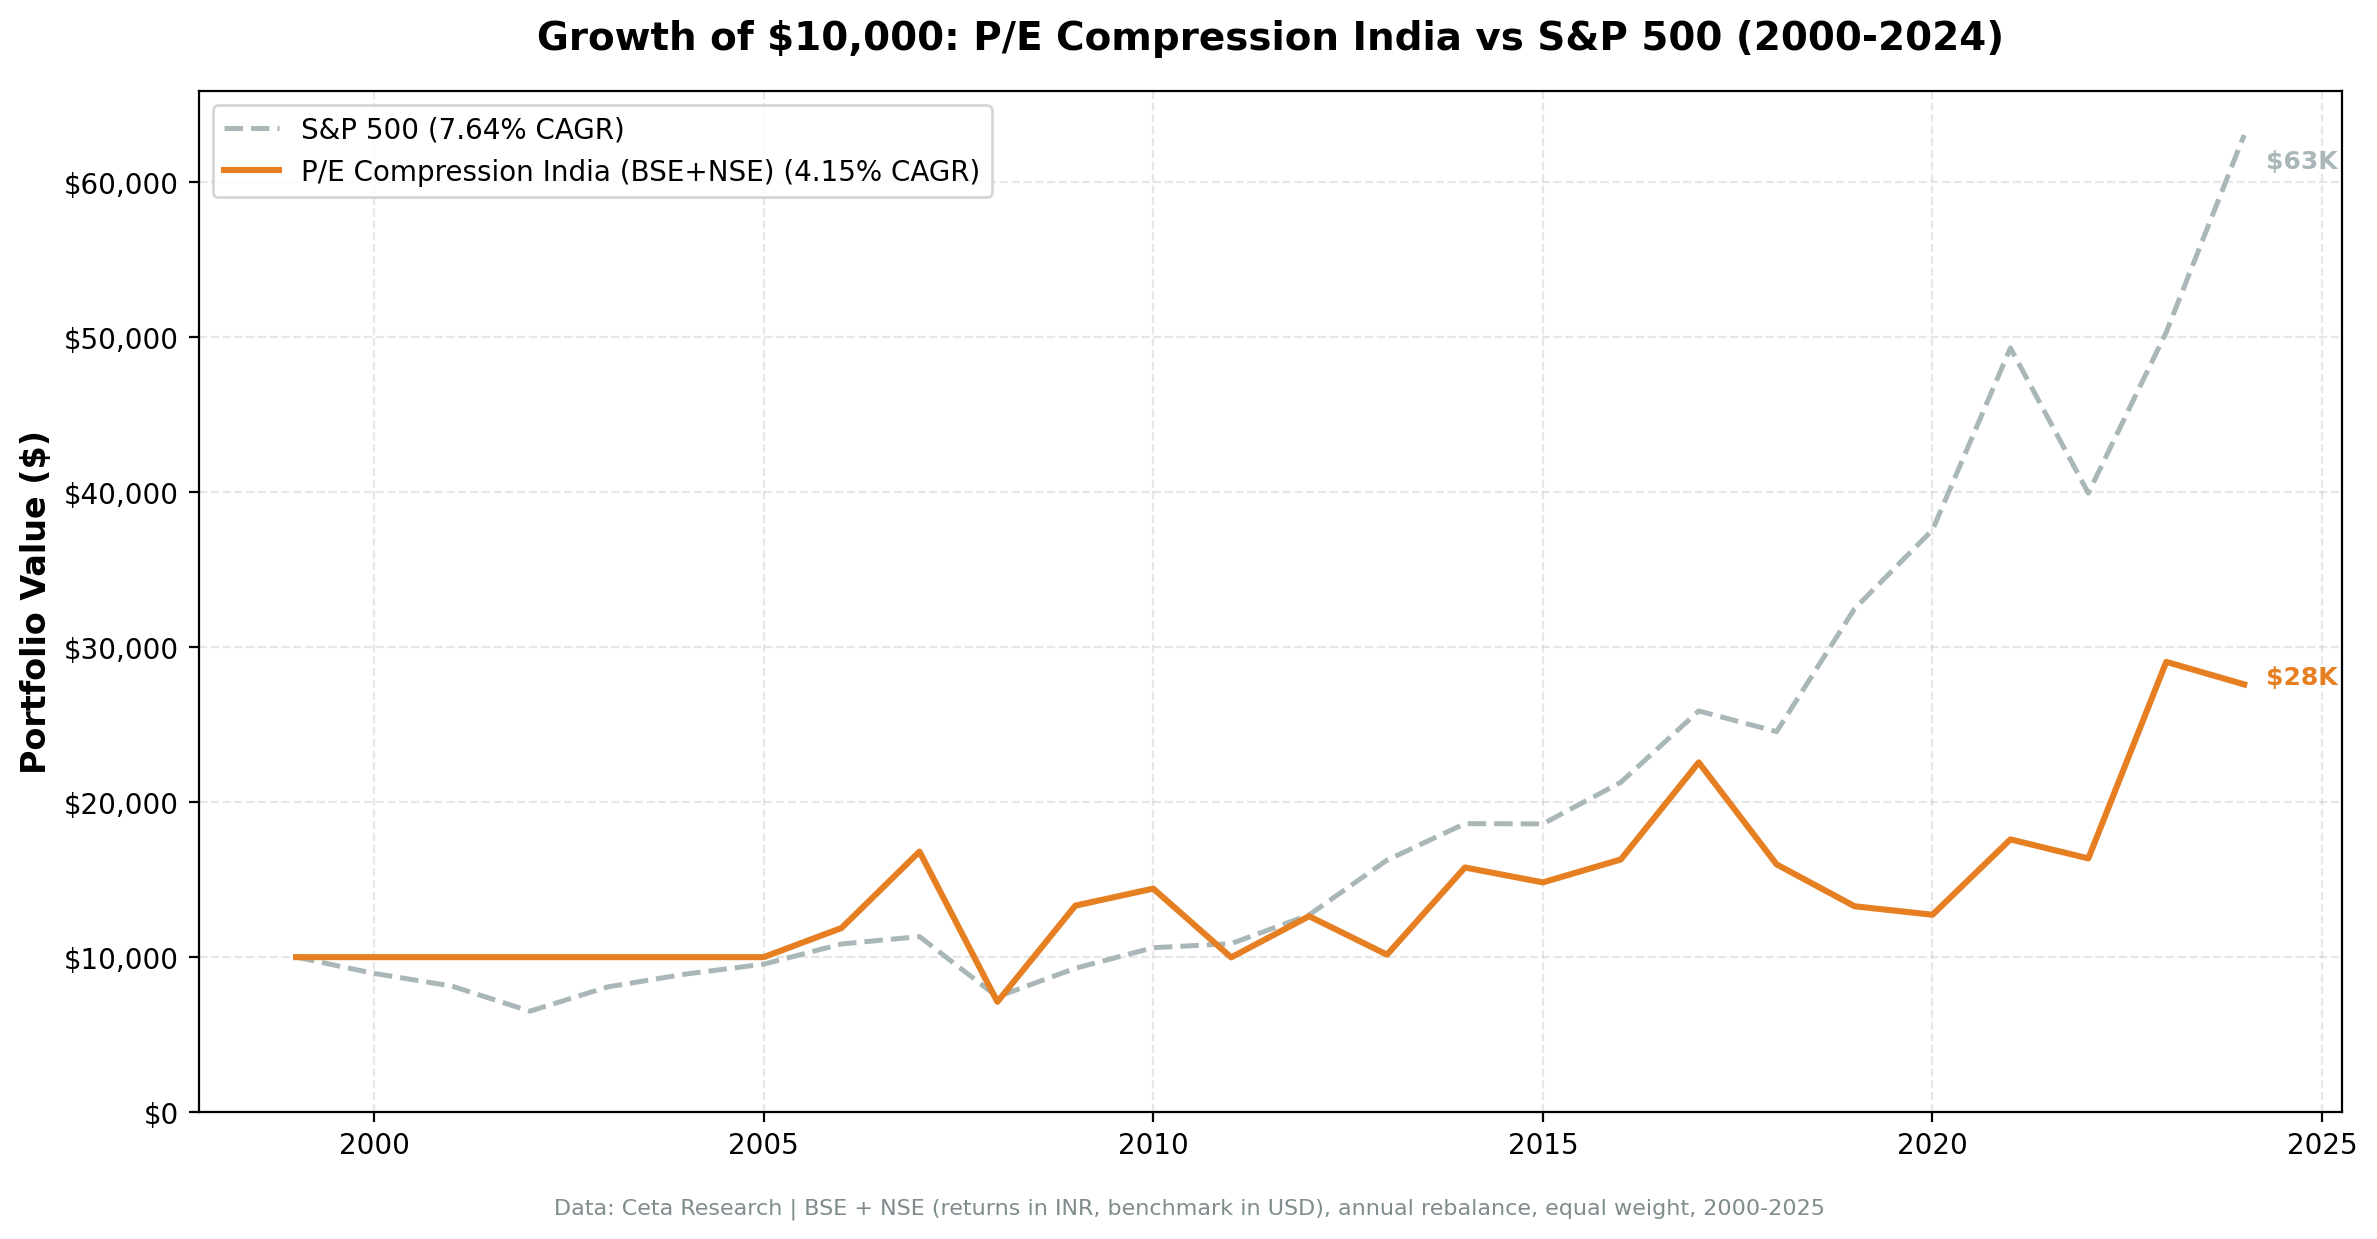
P/E compression on Indian NSE stocks delivers 8.00% CAGR vs 11.40% for the Sensex, underperforming by 3.40% per year. Strong absolute returns, but India's bull market is a tough benchmark to beat.

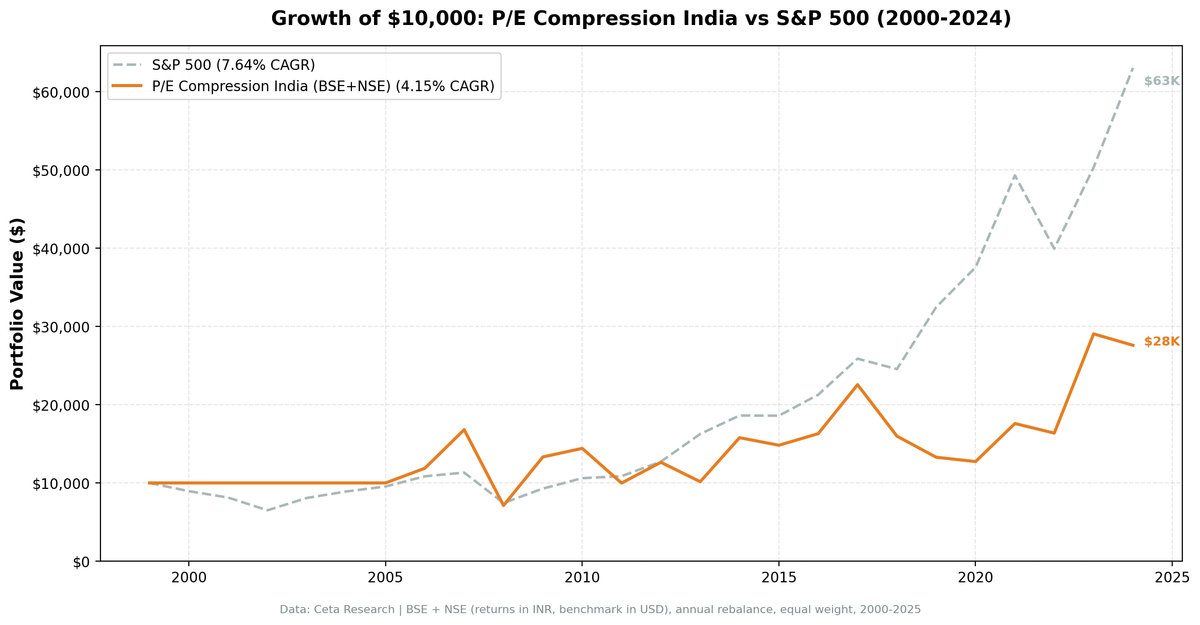
India P/E Compression: Underperforms Sensex by 3.40% Annually
We tested P/E compression mean reversion on 25 years of Indian NSE stock data. The strategy returned 8.00% annually (INR-denominated) vs 11.40% for the Sensex, underperforming by 3.40% per year. The correct local benchmark matters: the Sensex rose 11.40% annually over this period, far above SPY's 7.64%. Indian markets have been strong. A strategy that returns 8% still loses against that benchmark.
Contents
- Method
- What We Found
- 25 years. -3.40% annual underperformance vs Sensex. Strong absolute returns but not enough.
- Why P/E Compression Underperforms in India
- Year-by-Year Returns
- Backtest Methodology
- Limitations
- Conclusion
Data: FMP financial data warehouse, 2000–2025. Updated March 2026.
Method
Data source: Ceta Research (FMP financial data warehouse) Universe: NSE, market cap > ₹50B Period: 2000-2025 (25 years, 25 annual periods) Rebalancing: Annual (January), equal weight, top 30 by compression ratio Benchmark: BSE Sensex (^BSESN, INR, local benchmark) Cash rule: Hold cash if fewer than 10 stocks qualify
Returns are in INR. The Sensex is the local benchmark a domestic Indian investor would compare against.
What We Found
25 years. -3.40% annual underperformance vs Sensex. Strong absolute returns but not enough.
| Metric | P/E Compression (India) | Sensex |
|---|---|---|
| CAGR | 8.00% | 11.40% |
| Excess CAGR | -3.40% | - |
| Sharpe Ratio | 0.048 | - |
| Max Drawdown | -60.94% | - |
| Up Capture | 79.47% | 100% |
| Down Capture | 71.60% | 100% |
| Avg Stocks per Year | ~19 | - |
| Cash Periods | 6 of 25 (24%) | - |
India's P/E compression strategy generates positive absolute returns (8.00% CAGR) but lags the Sensex by 3.40% annually. India's equity market has been one of the world's strongest over 2000-2025, rising 11.40% annually. Any strategy that can't beat 11.40% is a drag on a domestic Indian portfolio.
The 72% down-capture vs Sensex shows the strategy doesn't amplify losses. But the 79% up-capture means the strategy misses 21% of the Sensex's gains in up years. Combined, you get a portfolio that participates less on the way up and roughly the same on the way down.
Why P/E Compression Underperforms in India
India's equity market is a strong benchmark. The Sensex returned 11.40% annually over 25 years, one of the highest rates among major global markets. Beating that benchmark is hard. Most active strategies fail to beat a strong index over 25 years. The underperformance here isn't a catastrophic failure; it's the normal drag that compression-style screens face against fast-growing markets.
High cash periods. 24% of years in cash is a structural drag. The 5-year P/E lookback requires at least 3 years of filing history. In India's earlier years, many quality NSE stocks didn't have that history. Cash years in rapidly rising markets hurt.
Emerging market volatility overwhelms the signal. Indian markets swing violently. P/E ratios compress and expand based on earnings volatility, policy changes, and liquidity shocks, not just sentiment. Mean reversion assumes some stability in P/E dynamics. India's market doesn't always provide that.
Earnings quality. Indian companies have less predictable earnings than mature market counterparts. A compressed P/E often reflects genuine concern about future earnings, not temporary sentiment.
Year-by-Year Returns
| Year | P/E Compression | Sensex | Excess |
|---|---|---|---|
| 2000 | +0.0% | -25.2% | +25.2% |
| 2001 | +0.0% | -18.6% | +18.6% |
| 2002 | +0.0% | +2.9% | -2.9% |
| 2003 | +0.0% | +79.1% | -79.1% |
| 2004 | +0.0% | +10.8% | -10.8% |
| 2005 | +0.0% | +40.6% | -40.6% |
| 2006 | +16.6% | +48.5% | -31.8% |
| 2007 | +39.9% | +46.8% | -6.9% |
| 2008 | -60.9% | -51.3% | -9.6% |
| 2009 | +86.3% | +76.3% | +10.0% |
| 2010 | +19.4% | +17.1% | +2.3% |
| 2011 | -28.8% | -24.5% | -4.3% |
| 2012 | +36.1% | +27.0% | +9.0% |
| 2013 | -11.4% | +6.0% | -17.4% |
| 2014 | +75.6% | +33.5% | +42.1% |
| 2015 | -1.8% | -8.1% | +6.3% |
| 2016 | +15.2% | +3.8% | +11.4% |
| 2017 | +46.6% | +27.1% | +19.5% |
| 2018 | -20.6% | +6.2% | -26.7% |
| 2019 | +8.0% | +16.0% | -8.0% |
| 2020 | +6.9% | +15.7% | -8.8% |
| 2021 | +29.2% | +22.9% | +6.3% |
| 2022 | -1.0% | +3.4% | -4.3% |
| 2023 | +51.7% | +17.5% | +34.2% |
| 2024 | +8.8% | +11.2% | -2.4% |
The early years (2000-2005) were mostly in cash. The 2003 miss is painful: the Sensex rose 79% that year, and the screen was in cash. Years 2006-2007 show the strategy participates in bull markets but captures only part of the gain.
Some strong years stand out: 2014 (+42.1% excess), 2017 (+19.5%), 2023 (+34.2%). These were years when specific value sectors in India saw P/E compression and then strong recovery. But the offsetting weak years (2006 -31.8%, 2018 -26.7%) mean the cumulative alpha stays negative.
Backtest Methodology
| Parameter | Choice |
|---|---|
| Universe | NSE, Market Cap > ₹50B |
| Signal | Current P/E < 85% of 5-year avg, P/E 5-40, ROE > 10%, D/E < 2.0 |
| Portfolio | Top 30 by lowest compression ratio, equal weight |
| Rebalancing | Annual (January) |
| Cash rule | Hold cash if < 10 qualify |
| Benchmark | BSE Sensex (^BSESN, INR) |
| Period | 2000-2025 (25 years) |
| Data | Point-in-time (45-day lag on FY financial statements) |
| Transaction costs | 0.3% one-way (mid-cap tier) |
Limitations
High cash periods limit compounding. Six years in cash (24%) means the portfolio doesn't benefit from India's strong market performance in those years.
Universe restricted to NSE only. BSE stocks were excluded due to dual-listing duplication artifacts that inflate return calculations. This narrows the eligible universe.
Strong benchmark is a high bar. 11.40% CAGR from the Sensex over 25 years is exceptional. P/E compression works best against weak-to-moderate benchmark returns. India's growth rate makes it structurally difficult.
Survivorship bias. Exchange membership uses current NSE profiles. Delistings over 25 years aren't fully tracked.
Conclusion
India's P/E compression strategy generates 8.00% CAGR in INR terms but underperforms the Sensex by 3.40% annually. The right context: India's equity market grew 11.40% annually over 25 years, one of the strongest runs of any major market. Beating that benchmark requires either superior stock selection or significant alpha from mean reversion. This strategy doesn't deliver enough of either.
The strategy isn't a disaster. It avoids catastrophic periods (cash in 2000-2001), shows some selectivity, and generates positive absolute returns. But for a domestic Indian investor, holding a Sensex index fund would have done better over this period.
Data: Ceta Research (FMP financial data warehouse). Returns in INR. Universe: NSE only. Past performance does not guarantee future results. See full methodology at github.com/ceta-research/backtests.


