
P/E Compression in Japan: The Signal That Finds Stocks But Not Alpha

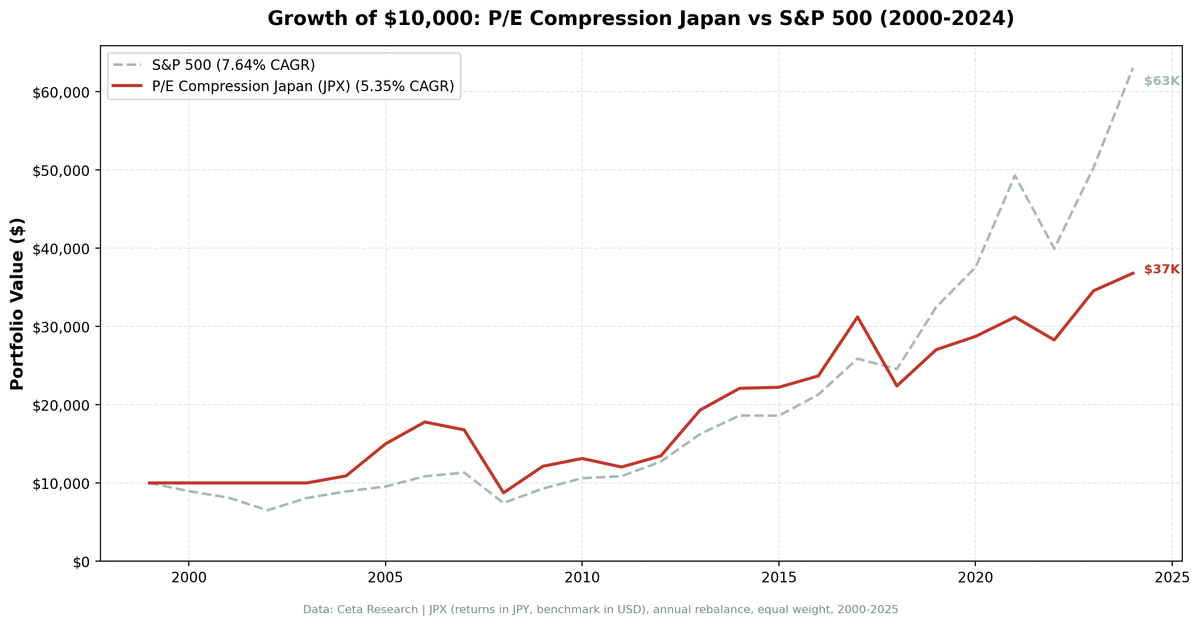
We ran the P/E compression screen on JPX (Tokyo Stock Exchange) from 2000 to 2025. The strategy found an average of 28 qualifying stocks per year, the signal fired reliably, and the portfolio still returned 5.35% annually vs 7.64% for the S&P 500. That's -2.29% per year, compounding into a 268.1% total return against SPY's 530.7% over 25 years. Japan is the clearest example in this series of a signal that works mechanically but fails structurally.
Contents
- Method
- The Strategy
- Screen
- Results
- When It Works
- When It Fails
- The Japan Discount
- Full Annual Returns
- Limitations
- Run It Yourself
- Part of a Series
Method
- Data source: Ceta Research (FMP financial data warehouse)
- Universe: JPX (Tokyo Stock Exchange), market cap > exchange-specific threshold
- Period: 2000-2025 (25 annual rebalance periods)
- Rebalancing: Annual (January), equal weight top 30 by compression score
- Benchmark: S&P 500 Total Return (SPY)
- Currency note: Returns in Japanese Yen (JPY). Benchmark is USD. Direct comparison has currency effects.
- Cash rule: Hold cash if fewer than 10 stocks qualify
Historical financial data with 45-day lag to prevent look-ahead bias. Full methodology: backtests/METHODOLOGY.md
The Strategy
P/E compression is the inverse of multiple expansion. A stock whose P/E has contracted 15%+ below its own historical average looks cheap relative to itself. Not cheap in absolute terms, but cheap relative to what the market was willing to pay for this company's earnings across multiple business cycles.
The filters:
| Criterion | Metric | Threshold | Why |
|---|---|---|---|
| Valuation compression | Current P/E / 5yr avg P/E | < 0.85 | 15%+ below own history |
| Real earnings | P/E | > 5 | Positive earnings, not distressed |
| Not speculative | P/E | < 40 | Excludes story stocks |
| Profitability | Return on equity | > 10% | Business still earns decent returns |
| Leverage | Debt-to-equity | < 2.0 | Not over-leveraged |
| Liquidity | Market cap | > exchange threshold | Investable |
| History | Prior P/E data | 3+ years | Enough to compute meaningful average |
Ranking: Top 30 by most compressed (lowest current/average ratio), equal weight.
The ROE and D/E filters are the key differentiator from simple low-P/E screens. A stock with a compressed P/E but deteriorating fundamentals is a value trap. The quality filters select for companies where the compression looks like sentiment or cycle-driven repricing, not earnings deterioration.
Screen
WITH fy_pe AS (
 SELECT r.symbol, r.priceToEarningsRatio AS pe, r.dateEpoch,
 ROW_NUMBER() OVER (PARTITION BY r.symbol ORDER BY r.dateEpoch DESC) AS rn,
 AVG(r.priceToEarningsRatio) OVER (
 PARTITION BY r.symbol ORDER BY r.dateEpoch
 ROWS BETWEEN 5 PRECEDING AND 1 PRECEDING
 ) AS avg_pe_5yr,
 COUNT(r.priceToEarningsRatio) OVER (
 PARTITION BY r.symbol ORDER BY r.dateEpoch
 ROWS BETWEEN 5 PRECEDING AND 1 PRECEDING
 ) AS n_prior
 FROM financial_ratios r
 JOIN profile p ON r.symbol = p.symbol
 WHERE r.period = 'FY' AND r.priceToEarningsRatio > 0 AND r.priceToEarningsRatio < 100
 AND p.exchange IN ('JPX')
)
SELECT f.symbol, p.companyName, p.sector,
 ROUND(f.pe, 2) AS current_fy_pe,
 ROUND(f.avg_pe_5yr, 2) AS pe_5yr_avg,
 ROUND(f.pe / f.avg_pe_5yr, 3) AS pe_ratio_to_avg,
 ROUND((1 - f.pe / f.avg_pe_5yr) * 100, 1) AS compression_pct,
 ROUND(k.returnOnEquityTTM * 100, 1) AS roe_pct,
 ROUND(f2.debtToEquityRatioTTM, 2) AS debt_to_equity,
 ROUND(k.marketCap / 1e9, 2) AS mktcap_b
FROM fy_pe f
JOIN key_metrics_ttm k ON f.symbol = k.symbol
JOIN financial_ratios_ttm f2 ON f.symbol = f2.symbol
JOIN profile p ON f.symbol = p.symbol
WHERE f.rn = 1
 AND f.avg_pe_5yr IS NOT NULL
 AND f.n_prior >= 3
 AND f.pe > 5
 AND f.pe < 40
 AND f.pe / f.avg_pe_5yr < 0.85
 AND k.returnOnEquityTTM > 0.10
 AND (f2.debtToEquityRatioTTM IS NULL OR (f2.debtToEquityRatioTTM >= 0 AND f2.debtToEquityRatioTTM < 2.0))
ORDER BY f.pe / f.avg_pe_5yr ASC
LIMIT 30
Results
| Metric | Portfolio | S&P 500 |
|---|---|---|
| CAGR | 5.35% | 7.64% |
| Total Return | 268.1% | 530.7% |
| Max Drawdown | -50.89% | -34.90% |
| Volatility (ann.) | 20.10% | 17.51% |
| Sharpe Ratio | 0.261 | 0.322 |
| Sortino Ratio | 0.457 | — |
| Beta | 0.829 | 1.00 |
| Alpha | -1.00% | — |
| Up Capture | 82.8% | — |
| Down Capture | 86.6% | — |
| Win Rate (vs SPY) | 40.0% | — |
| Cash Periods | 4/25 | — |
| Avg Stocks | 28.0 | — |
The strategy underperforms on every dimension: lower CAGR, deeper max drawdown, worse win rate. The one positive framing is the Sharpe ratio of 0.261, positive means the portfolio did earn more than the risk-free rate on a risk-adjusted basis. It wasn't a complete failure. It just consistently trailed the benchmark.
When It Works
Japan had genuine standout years. These four clustered around macro regime shifts.
| Year | Portfolio | S&P 500 | Excess |
|---|---|---|---|
| 2005 | +37.5% | +7.2% | +30.3% |
| 2009 | +38.8% | +24.7% | +14.1% |
| 2013 | +43.6% | +27.8% | +15.8% |
| 2017 | +31.8% | +21.6% | +10.2% |
2005 was part of a broad Japanese market recovery after the deflationary 1990s. Value stocks caught a bid as the economy found footing.
2009 followed the global financial crisis. Companies whose P/Es compressed in the panic recovered as earnings stabilized, consistent with what the screen found in other markets that year.
2013 coincided with Abenomics. Prime Minister Abe's policy package (aggressive monetary easing, fiscal stimulus, structural reforms) drove a broad Japanese equity rally. Compressed-multiple stocks with decent ROE benefited disproportionately as the yen weakened and corporate earnings expanded.
2017 was a quieter version of the same: a steady global growth environment where quality value names participated without the macro headwinds that hurt other years.
When It Fails
The failure years are more numerous and more consistent.
| Year | Portfolio | S&P 500 | Excess |
|---|---|---|---|
| 2000 | 0.0% | -10.5% | +10.5% (cash) |
| 2001 | 0.0% | -9.2% | +9.2% (cash) |
| 2002 | 0.0% | -19.9% | +19.9% (cash) |
| 2003 | 0.0% | +24.1% | -24.1% (cash) |
| 2008 | -47.9% | -34.3% | -13.6% |
| 2018 | -28.2% | -5.2% | -23.1% |
| 2021 | +8.6% | +31.3% | -22.7% |
| 2024 | +6.5% | +25.3% | -18.8% |
2000-2003: JPX data in the FMP warehouse was thin for the early period. Not enough stocks met the full quality filter set (P/E history, ROE, D/E). The portfolio held cash all four years. This produced accidental defense in 2000-2002 (SPY fell), but missed the 2003 recovery entirely.
2008: The worst active loss year. -47.9% against SPY's -34.3%. Japanese equities got hammered in the global crisis. Companies with compressed P/Es that also had leverage and cyclical exposure fell harder than the broader index.
2018: A sharp global equity selloff hit Japan's export-heavy market particularly hard. -28.2% with -23.1% excess is the worst spread of any active year.
2021 and 2024: The mirror image of the Abenomics years. Global capital rotated aggressively into high-growth, high-multiple names. Compressed-P/E screens hold the opposite of that.
The Japan Discount
The deeper issue isn't one bad year or a data gap. It's structural.
Japanese companies have historically traded at lower multiples than their Western counterparts. The reasons are well-documented: low ROE targets, chronic over-retention of cash and cross-shareholdings (keiretsu), weak shareholder return culture, and a deflationary macro backdrop that depressed nominal earnings growth for nearly two decades. When a Japanese company's P/E compresses below its 5-year average, you're not always looking at a temporarily cheap business. You're often looking at a market that has correctly priced in low capital efficiency.
The P/E compression signal assumes the compressed multiple is anomalous. That there's a "normal" multiple the company should revert to. In the US, that assumption holds reasonably well because US companies operate in an environment where earnings growth and shareholder returns are actively managed. In Japan, the "normal" multiple has itself been structurally low. The market wasn't wrong. It was just reflecting reality.
This explains the signal finding 28 stocks per year. The screen fires because plenty of Japanese companies see P/E fluctuations around their historical averages. But the re-rating that drives the US alpha doesn't follow consistently in Japan, because the underlying ROE expansion and multiple expansion that fuel re-ratings depend on corporate behavior that was, for much of this period, absent.
The landscape may be changing. The Tokyo Stock Exchange launched a governance reform campaign in 2023, pressuring companies trading below book value to improve capital efficiency, increase buybacks, and articulate ROE targets. Early evidence shows some effect. Several major Japanese conglomerates have announced shareholder return programs and cross-holding disposals. If this reforms corporate Japan's capital allocation culture, P/E compression may become a stronger signal going forward. The 2023 and 2024 results (+22.2% and +6.5%) don't yet reflect it clearly, but the 2023 absolute return was solid.
Despite underperforming the benchmark, the strategy's positive Sharpe (0.261) means it wasn't pointless. It earned above the Japanese risk-free rate on a risk-adjusted basis across the full period. That's a floor, not a ceiling.
Full Annual Returns
Years 2000-2003 held cash (fewer than 10 qualifying stocks in JPX data)
| Year | Portfolio | S&P 500 | Excess |
|---|---|---|---|
| 2000 | 0.0% | -10.5% | +10.5% |
| 2001 | 0.0% | -9.2% | +9.2% |
| 2002 | 0.0% | -19.9% | +19.9% |
| 2003 | 0.0% | +24.1% | -24.1% |
| 2004 | +9.1% | +10.2% | -1.1% |
| 2005 | +37.5% | +7.2% | +30.3% |
| 2006 | +18.6% | +13.7% | +5.0% |
| 2007 | -5.7% | +4.4% | -10.1% |
| 2008 | -47.9% | -34.3% | -13.6% |
| 2009 | +38.8% | +24.7% | +14.1% |
| 2010 | +8.2% | +14.3% | -6.1% |
| 2011 | -8.3% | +2.5% | -10.8% |
| 2012 | +11.8% | +17.1% | -5.3% |
| 2013 | +43.6% | +27.8% | +15.8% |
| 2014 | +14.3% | +14.5% | -0.2% |
| 2015 | +0.6% | -0.1% | +0.7% |
| 2016 | +6.5% | +14.4% | -7.9% |
| 2017 | +31.8% | +21.6% | +10.2% |
| 2018 | -28.2% | -5.2% | -23.1% |
| 2019 | +20.7% | +32.3% | -11.6% |
| 2020 | +6.3% | +15.6% | -9.4% |
| 2021 | +8.6% | +31.3% | -22.7% |
| 2022 | -9.4% | -19.0% | +9.6% |
| 2023 | +22.2% | +26.0% | -3.8% |
| 2024 | +6.5% | +25.3% | -18.8% |
Limitations
Currency effects. Portfolio returns are in JPY. The benchmark is SPY in USD. The JPY/USD rate moved materially over this period, which affects any direct comparison. A USD-denominated investor in Japanese equities would have seen different numbers depending on FX moves.
Early cash years. JPX coverage in the FMP data warehouse was thinner for 2000-2003, meaning fewer companies had the 3+ years of P/E history needed to qualify. This produced four cash years at the start of the test, which distorts both the early drawdown stats and the compounding base.
The 2008 drawdown. At -50.89%, the max drawdown is worse than SPY's -34.90% and worse than the US version of this strategy at -42.82%. Japanese equities in general fell harder in 2008 due to yen appreciation and export sector exposure.
Annual rebalancing lag. Rebalancing once per year in January means the portfolio can't respond to mid-year deterioration. The FY P/E history calculation is most reliable with annual filings, so quarterly rebalancing would introduce noise.
Run It Yourself
git clone https://github.com/ceta-research/backtests.git
cd backtests

# Japan backtest
python3 pe-compression/backtest.py --preset japan --output results.json --verbose

# Current screen
python3 pe-compression/screen.py --preset japan
Part of a Series
This is the Japan analysis. We tested the same screen across 19 exchanges globally:
- Global comparison →. The East-West divide across 19 markets
- US analysis →, 9.97% CAGR, +2.32% excess, where it works best
- UK analysis →, 9.02% CAGR, +1.38% excess
- Canada analysis →, 8.75% CAGR, 23.7% down capture
Run It Yourself
Explore the data behind this analysis on Ceta Research. Query our financial data warehouse with SQL, build custom screens, and run your own backtests across 70,000+ stocks on 20 exchanges.
Data: Ceta Research (FMP financial data warehouse), 2000-2025. Returns in JPY. Benchmark: SPY (USD). Full methodology: METHODOLOGY.md. Past performance doesn't guarantee future results.


