
P/E Compression in Switzerland: A Small Universe in an Expensive

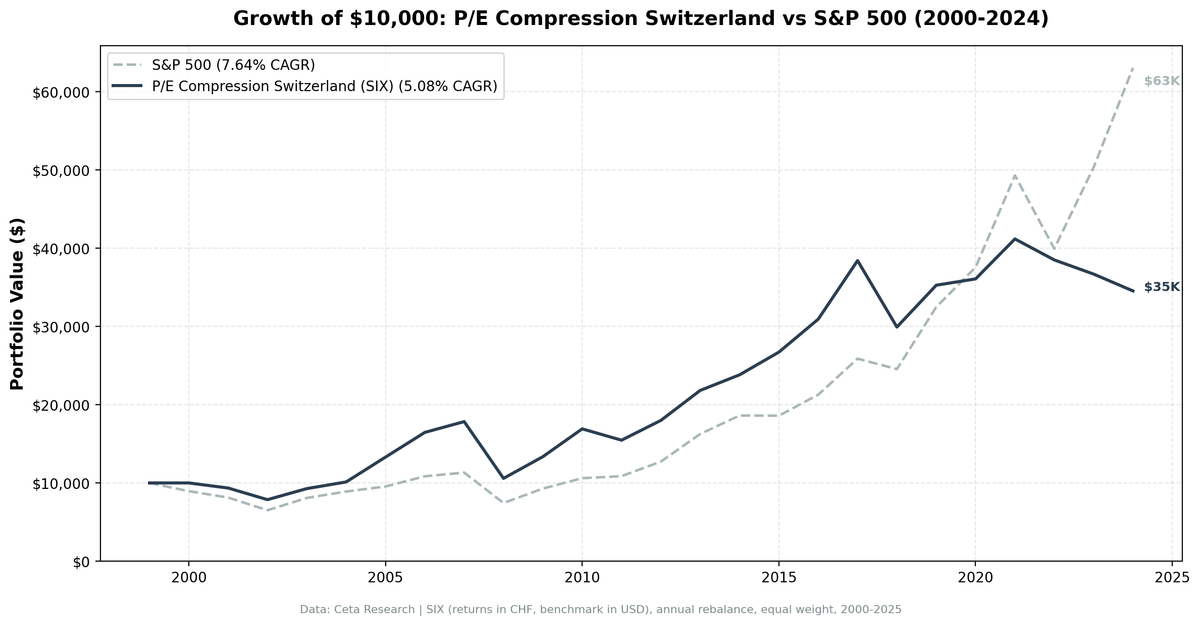
We ran the P/E compression screen on the Swiss Exchange (SIX) for 25 years, 2000-2025. The strategy returned 5.08% annually vs 7.64% for the S&P 500. That's -2.56% per year in underperformance, compounding into 245.5% total return against SPY's 530.7%. Switzerland is the clearest example in this series of a screen constrained by a market that rarely trades cheap, even in downturns.
Contents
- Method
- The Strategy
- Screen
- Results
- When It Works
- When It Fails
- The Expensive Market Problem
- Full Annual Returns
- Limitations
- Run It Yourself
- Part of a Series
Method
- Data source: Ceta Research (FMP financial data warehouse)
- Universe: SIX (Swiss Exchange), market cap > exchange-specific threshold
- Period: 2000-2025 (25 annual rebalance periods)
- Rebalancing: Annual (January), equal weight top 30 by compression score
- Benchmark: S&P 500 Total Return (SPY)
- Currency note: Returns in Swiss Franc (CHF). Benchmark is USD. Direct comparison has currency effects.
- Cash rule: Hold cash if fewer than 10 stocks qualify
Historical financial data with 45-day lag to prevent look-ahead bias. Full methodology: backtests/METHODOLOGY.md
The Strategy
P/E compression targets stocks whose current annual P/E has contracted 15%+ below the company's own 5-year historical average. The quality filters (ROE > 10% and D/E < 2.0) distinguish sentiment-driven repricing from fundamental deterioration.
| Criterion | Metric | Threshold | Why |
|---|---|---|---|
| Valuation compression | Current P/E / 5yr avg P/E | < 0.85 | 15%+ below own history |
| Real earnings | P/E | > 5 | Positive earnings, not distressed |
| Not speculative | P/E | < 40 | Excludes story stocks |
| Profitability | Return on equity | > 10% | Business still earns decent returns |
| Leverage | Debt-to-equity | < 2.0 | Not over-leveraged |
| Liquidity | Market cap | > exchange threshold | Investable |
| History | Prior P/E data | 3+ years | Enough to compute meaningful average |
Ranking: Top 30 by most compressed (lowest current/average ratio), equal weight.
Screen
WITH fy_pe AS (
 SELECT r.symbol, r.priceToEarningsRatio AS pe, r.dateEpoch,
 ROW_NUMBER() OVER (PARTITION BY r.symbol ORDER BY r.dateEpoch DESC) AS rn,
 AVG(r.priceToEarningsRatio) OVER (
 PARTITION BY r.symbol ORDER BY r.dateEpoch
 ROWS BETWEEN 5 PRECEDING AND 1 PRECEDING
 ) AS avg_pe_5yr,
 COUNT(r.priceToEarningsRatio) OVER (
 PARTITION BY r.symbol ORDER BY r.dateEpoch
 ROWS BETWEEN 5 PRECEDING AND 1 PRECEDING
 ) AS n_prior
 FROM financial_ratios r
 JOIN profile p ON r.symbol = p.symbol
 WHERE r.period = 'FY' AND r.priceToEarningsRatio > 0 AND r.priceToEarningsRatio < 100
 AND p.exchange IN ('SIX')
)
SELECT f.symbol, p.companyName, p.sector,
 ROUND(f.pe, 2) AS current_fy_pe,
 ROUND(f.avg_pe_5yr, 2) AS pe_5yr_avg,
 ROUND(f.pe / f.avg_pe_5yr, 3) AS pe_ratio_to_avg,
 ROUND((1 - f.pe / f.avg_pe_5yr) * 100, 1) AS compression_pct,
 ROUND(k.returnOnEquityTTM * 100, 1) AS roe_pct,
 ROUND(f2.debtToEquityRatioTTM, 2) AS debt_to_equity,
 ROUND(k.marketCap / 1e9, 2) AS mktcap_b
FROM fy_pe f
JOIN key_metrics_ttm k ON f.symbol = k.symbol
JOIN financial_ratios_ttm f2 ON f.symbol = f2.symbol
JOIN profile p ON f.symbol = p.symbol
WHERE f.rn = 1
 AND f.avg_pe_5yr IS NOT NULL
 AND f.n_prior >= 3
 AND f.pe > 5
 AND f.pe < 40
 AND f.pe / f.avg_pe_5yr < 0.85
 AND k.returnOnEquityTTM > 0.10
 AND (f2.debtToEquityRatioTTM IS NULL OR (f2.debtToEquityRatioTTM >= 0 AND f2.debtToEquityRatioTTM < 2.0))
ORDER BY f.pe / f.avg_pe_5yr ASC
LIMIT 30
Results
| Metric | Portfolio | S&P 500 |
|---|---|---|
| CAGR | 5.08% | 7.64% |
| Total Return | 245.5% | 530.7% |
| Max Drawdown | -40.68% | -34.90% |
| Volatility (ann.) | 17.37% | 17.51% |
| Sharpe Ratio | 0.264 | 0.322 |
| Sortino Ratio | 0.439 | — |
| Beta | 0.700 | 1.00 |
| Alpha | -0.42% | — |
| Up Capture | 75.04% | — |
| Down Capture | 80.98% | — |
| Win Rate (vs SPY) | 48.0% | — |
| Cash Periods | 1/25 | — |
| Avg Stocks | 15.0 | — |
The results are straightforwardly poor. Lower CAGR, deeper max drawdown, worse win rate, and a down capture of 81%, meaning the portfolio captured most of the S&P 500's losses without capturing the gains. The one constructive number is the Sharpe ratio of 0.264. Positive means the portfolio did earn above the risk-free rate on a risk-adjusted basis. It wasn't a complete failure. It just consistently trailed the benchmark.
When It Works
Switzerland had real standout years, concentrated in the mid-2000s.
| Year | Portfolio | S&P 500 | Excess |
|---|---|---|---|
| 2005 | +31.4% | +7.2% | +24.2% |
| 2006 | +23.7% | +13.7% | +10.1% |
| 2009 | +26.2% | +24.7% | +1.5% |
| 2010 | +26.6% | +14.3% | +12.3% |
| 2015 | +12.2% | -0.1% | +12.3% |
| 2017 | +24.2% | +21.6% | +2.6% |
2005-2006 was the strongest run. Swiss mid-cap industrials and financials had compressed multiples coming out of the 2002-2003 downturn. The re-rating was clean.
2009-2010 followed the global financial crisis pattern seen across other markets in this series. Compressed-P/E stocks with decent ROE recovered as earnings stabilized after the panic.
2015 stood out in a down year for SPY. Swiss defensive stocks held value well while the US market contracted slightly.
When It Fails
| Year | Portfolio | S&P 500 | Excess |
|---|---|---|---|
| 2008 | -40.7% | -34.3% | -6.4% |
| 2018 | -22.1% | -5.2% | -16.9% |
| 2019 | +17.9% | +32.3% | -14.5% |
| 2021 | +14.2% | +31.3% | -17.1% |
| 2023 | -4.7% | +26.0% | -30.7% |
| 2024 | -5.9% | +25.3% | -31.1% |
2008: -40.7%. The max drawdown year. Swiss financials, particularly UBS and Credit Suisse-affiliated names, had compressed P/Es entering 2008 for good reason. The compression signal fired on companies that were correctly being re-rated lower.
2018: A broad selloff hit the Swiss portfolio hard. -22.1% against SPY's -5.2%. With only 15 names, concentration risk amplified the damage.
2023-2024: The most concerning stretch. Two years of negative absolute returns (-4.7%, -5.9%) against strongly positive SPY. The spread of -30.7% and -31.1% is severe. Swiss equities underperformed global markets, and compressed-multiple names within SIX trailed even the broader Swiss market.
The Expensive Market Problem
Switzerland is one of the highest-valued equity markets in the world. Nestlé, Novartis, Roche, ABB, and UBS collectively represent a substantial share of SIX's market cap. These companies are quality compounders. They trade at consistent, premium multiples because the market has good reason to pay for their earnings. Their P/Es don't compress much relative to history. When they do, it's usually during genuine fundamental stress, not sentiment-driven repricing.
This creates a problem for the compression screen. The signal draws from the mid-cap and smaller portion of SIX, avoiding the mega-caps that dominate the index by weight. That leaves roughly 15 qualifying names per year, barely above the 10-stock minimum that triggers the cash rule. Fewer names means more concentration risk and less statistical robustness.
The second structural issue is valuation level. Switzerland's market commands high multiples because its companies tend to have strong balance sheets, stable cash flows, and Swiss franc backing. A P/E that "compresses" in Switzerland may still be expensive in absolute global terms. The signal assumes compression is anomalous. In Switzerland, for many companies, the "compressed" multiple is still their normal operating range, just slightly below the recent high.
The down capture of 81% tells the story mechanically. When global markets fell, Swiss stocks in this screen fell nearly as much. When global markets rose, they only captured 75% of the gains. That's a losing combination in any environment where markets trend upward.
The 25-year result is what it is: 5.08% CAGR, underperforming by 2.56% annually. The positive Sharpe means the strategy earned above Switzerland's risk-free rate, but that's a low bar. For the compression signal to work cleanly, you need a market with more valuation volatility, more sector diversity in mid-caps, and multiples that genuinely mean-revert. SIX has none of those in sufficient quantity.
Full Annual Returns
Year 2000 held cash (fewer than 10 qualifying stocks at the start of data coverage)
| Year | Portfolio | S&P 500 | Excess |
|---|---|---|---|
| 2000 | 0.0% | -10.5% | +10.5% (cash) |
| 2001 | -6.5% | -9.2% | +2.7% |
| 2002 | -15.9% | -19.9% | +4.0% |
| 2003 | +18.0% | +24.1% | -6.1% |
| 2004 | +9.2% | +10.2% | -1.1% |
| 2005 | +31.4% | +7.2% | +24.2% |
| 2006 | +23.7% | +13.7% | +10.1% |
| 2007 | +8.4% | +4.4% | +4.0% |
| 2008 | -40.7% | -34.3% | -6.4% |
| 2009 | +26.2% | +24.7% | +1.5% |
| 2010 | +26.6% | +14.3% | +12.3% |
| 2011 | -8.6% | +2.5% | -11.0% |
| 2012 | +16.4% | +17.1% | -0.7% |
| 2013 | +21.3% | +27.8% | -6.5% |
| 2014 | +9.1% | +14.5% | -5.4% |
| 2015 | +12.2% | -0.1% | +12.3% |
| 2016 | +15.8% | +14.4% | +1.3% |
| 2017 | +24.2% | +21.6% | +2.6% |
| 2018 | -22.1% | -5.2% | -16.9% |
| 2019 | +17.9% | +32.3% | -14.5% |
| 2020 | +2.3% | +15.6% | -13.3% |
| 2021 | +14.2% | +31.3% | -17.1% |
| 2022 | -6.5% | -19.0% | +12.5% |
| 2023 | -4.7% | +26.0% | -30.7% |
| 2024 | -5.9% | +25.3% | -31.1% |
Limitations
Small universe. 15 average stocks, half the target of 30. SIX doesn't produce enough compressed-P/E names with ROE > 10% to fill the portfolio. More concentration means individual positions have a larger effect on annual returns.
Currency effects. Returns are in CHF. The benchmark is SPY in USD. The CHF is one of the strongest currencies globally and appreciated meaningfully against the USD over the 25-year period. A USD-denominated investor would see different returns depending on FX.
The 2008 drawdown. At -40.68%, the max drawdown is worse than SPY's -34.90%, the opposite of what you want from a defensive signal. Swiss financial exposure in the portfolio meant the compression screen selected into 2008's worst performing names.
Recent results weak. 2023 and 2024 were both negative absolute and deeply negative relative to SPY. Whether this is a temporary cycle or a structural shift in how Swiss mid-caps trade is unknown from this data alone.
Run It Yourself
git clone https://github.com/ceta-research/backtests.git
cd backtests

# Switzerland backtest
python3 pe-compression/backtest.py --exchange SIX --output results.json --verbose

# Current screen
python3 pe-compression/screen.py --exchange SIX
Part of a Series
This is the Switzerland analysis. We tested the same screen across 19 exchanges globally:
- Global comparison →. The East-West divide across 19 markets
- US analysis →, 9.97% CAGR, +2.32% excess, where it works best
- UK analysis →, 9.02% CAGR, +1.38% excess
- Canada analysis →, 8.75% CAGR, 23.7% down capture
Run It Yourself
Explore the data behind this analysis on Ceta Research. Query our financial data warehouse with SQL, build custom screens, and run your own backtests across 70,000+ stocks on 20 exchanges.
Data: Ceta Research (FMP financial data warehouse), 2000-2025. Returns in CHF. Benchmark: SPY (USD). Full methodology: METHODOLOGY.md. Past performance doesn't guarantee future results.


