
P/E Compression in Thailand: Borderline Outperformance, Extraordinary

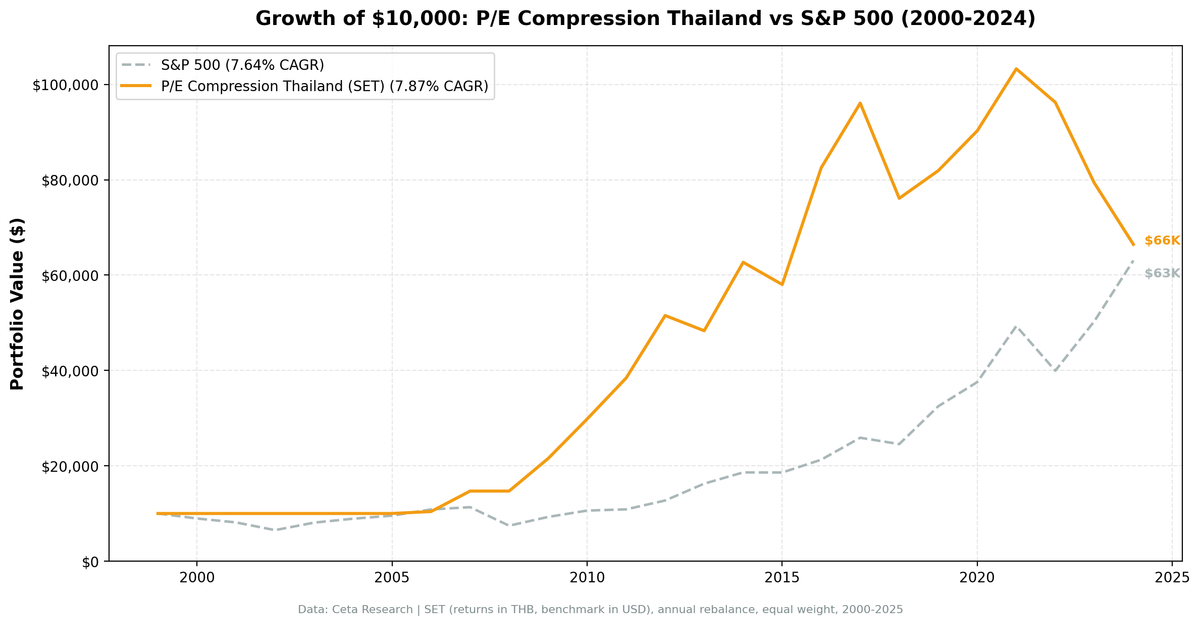
We ran the P/E compression screen on the Stock Exchange of Thailand (SET) for 25 years, 2000-2025. The strategy returned 7.87% annually vs 7.64% for the S&P 500. That's +0.23% per year, barely outperforming. But the down capture of 35.7% is the real finding. In years when the S&P 500 fell, this portfolio fell only 35.7% as much. Beta of 0.252. Almost zero correlation to US market moves.
Contents
- Method
- The Strategy
- Screen
- Results
- When It Works
- When It Fails
- The SET's Unusual Characteristics
- Full Annual Returns
- Limitations
- Run It Yourself
- Part of a Series
Method
- Data source: Ceta Research (FMP financial data warehouse)
- Universe: SET (Stock Exchange of Thailand), market cap > exchange-specific threshold
- Period: 2000-2025 (25 annual rebalance periods)
- Rebalancing: Annual (January), equal weight top 30 by compression score
- Benchmark: S&P 500 Total Return (SPY)
- Currency note: Returns in Thai Baht (THB). Benchmark is USD. Direct comparison has currency effects.
- Cash rule: Hold cash if fewer than 10 stocks qualify
Historical financial data with 45-day lag to prevent look-ahead bias. Full methodology: backtests/METHODOLOGY.md
The Strategy
P/E compression targets stocks whose current annual P/E has contracted 15%+ below the company's own 5-year historical average. The signal looks for sentiment or cycle-driven repricing, not fundamental deterioration. The quality filters (ROE and debt-to-equity) are designed to exclude value traps.
| Criterion | Metric | Threshold | Why |
|---|---|---|---|
| Valuation compression | Current P/E / 5yr avg P/E | < 0.85 | 15%+ below own history |
| Real earnings | P/E | > 5 | Positive earnings, not distressed |
| Not speculative | P/E | < 40 | Excludes story stocks |
| Profitability | Return on equity | > 10% | Business still earns decent returns |
| Leverage | Debt-to-equity | < 2.0 | Not over-leveraged |
| Liquidity | Market cap | > exchange threshold | Investable |
| History | Prior P/E data | 3+ years | Enough to compute meaningful average |
Ranking: Top 30 by most compressed (lowest current/average ratio), equal weight.
Screen
WITH fy_pe AS (
 SELECT r.symbol, r.priceToEarningsRatio AS pe, r.dateEpoch,
 ROW_NUMBER() OVER (PARTITION BY r.symbol ORDER BY r.dateEpoch DESC) AS rn,
 AVG(r.priceToEarningsRatio) OVER (
 PARTITION BY r.symbol ORDER BY r.dateEpoch
 ROWS BETWEEN 5 PRECEDING AND 1 PRECEDING
 ) AS avg_pe_5yr,
 COUNT(r.priceToEarningsRatio) OVER (
 PARTITION BY r.symbol ORDER BY r.dateEpoch
 ROWS BETWEEN 5 PRECEDING AND 1 PRECEDING
 ) AS n_prior
 FROM financial_ratios r
 JOIN profile p ON r.symbol = p.symbol
 WHERE r.period = 'FY' AND r.priceToEarningsRatio > 0 AND r.priceToEarningsRatio < 100
 AND p.exchange IN ('SET')
)
SELECT f.symbol, p.companyName, p.sector,
 ROUND(f.pe, 2) AS current_fy_pe,
 ROUND(f.avg_pe_5yr, 2) AS pe_5yr_avg,
 ROUND(f.pe / f.avg_pe_5yr, 3) AS pe_ratio_to_avg,
 ROUND((1 - f.pe / f.avg_pe_5yr) * 100, 1) AS compression_pct,
 ROUND(k.returnOnEquityTTM * 100, 1) AS roe_pct,
 ROUND(f2.debtToEquityRatioTTM, 2) AS debt_to_equity,
 ROUND(k.marketCap / 1e9, 2) AS mktcap_b
FROM fy_pe f
JOIN key_metrics_ttm k ON f.symbol = k.symbol
JOIN financial_ratios_ttm f2 ON f.symbol = f2.symbol
JOIN profile p ON f.symbol = p.symbol
WHERE f.rn = 1
 AND f.avg_pe_5yr IS NOT NULL
 AND f.n_prior >= 3
 AND f.pe > 5
 AND f.pe < 40
 AND f.pe / f.avg_pe_5yr < 0.85
 AND k.returnOnEquityTTM > 0.10
 AND (f2.debtToEquityRatioTTM IS NULL OR (f2.debtToEquityRatioTTM >= 0 AND f2.debtToEquityRatioTTM < 2.0))
ORDER BY f.pe / f.avg_pe_5yr ASC
LIMIT 30
Results
| Metric | Portfolio | S&P 500 |
|---|---|---|
| CAGR | 7.87% | 7.64% |
| Total Return | 564.5% | 530.7% |
| Max Drawdown | -35.65% | -34.90% |
| Volatility (ann.) | 19.91% | 17.51% |
| Sharpe Ratio | 0.270 | 0.322 |
| Sortino Ratio | 0.671 | — |
| Beta | 0.252 | 1.00 |
| Alpha | +4.07% | — |
| Up Capture | 83.73% | — |
| Down Capture | 35.70% | — |
| Win Rate (vs SPY) | 48.0% | — |
| Cash Periods | 7/25 | — |
| Avg Stocks | 21.8 | — |
The headline number is modest: +0.23% annual excess over 25 years. But the risk profile is unusual. A beta of 0.252 means this portfolio barely moved with US markets. Alpha of +4.07% means the excess return, adjusted for market exposure, was substantial. The Sortino of 0.671. The highest of any exchange we tested, reflects the fact that the downside periods were limited and shallow.
When It Works
Thailand's best active years clustered in the period after FMP data coverage improved.
| Year | Portfolio | S&P 500 | Excess |
|---|---|---|---|
| 2007 | +41.2% | +4.4% | +36.8% |
| 2009 | +46.5% | +24.7% | +21.7% |
| 2010 | +38.5% | +14.3% | +24.2% |
| 2011 | +28.9% | +2.5% | +26.4% |
| 2012 | +34.1% | +17.1% | +17.0% |
| 2016 | +42.2% | +14.4% | +27.8% |
2007-2012 was the strongest sustained run. Thai consumer and industrial companies that had compressed multiples from the 2004-2006 period re-rated as the economy grew and earnings caught up. Five consecutive years of outperformance.
2008 deserves a note. The portfolio held cash. There weren't enough qualifying stocks in January 2008. SPY fell 34.3% that year. The strategy returned 0.0%. That's not alpha from a brilliant call. It's a data gap that happened to protect capital at exactly the right moment.
2016 was a clean signal year: +42.2% with +27.8% excess. Thai equities rebounded after a soft 2014-2015 period, and the compressed names led.
When It Fails
| Year | Portfolio | S&P 500 | Excess |
|---|---|---|---|
| 2000 | 0.0% | -10.5% | +10.5% (cash) |
| 2001 | 0.0% | -9.2% | +9.2% (cash) |
| 2002 | 0.0% | -19.9% | +19.9% (cash) |
| 2003 | 0.0% | +24.1% | -24.1% (cash) |
| 2004 | 0.0% | +10.2% | -10.2% (cash) |
| 2005 | 0.0% | +7.2% | -7.2% (cash) |
| 2013 | -6.2% | +27.8% | -34.0% |
| 2023 | -17.6% | +26.0% | -43.6% |
| 2024 | -16.2% | +25.3% | -41.5% |
2000-2005: All cash. The FMP warehouse has limited Thai coverage for the early period. Not enough companies had 3+ years of P/E history to meet the quality filters. Six cash years at the start distorts the cumulative picture. The strategy missed both the dotcom crash and the recovery.
2013: A 34.0% shortfall against SPY. Thai equities sold off amid political instability. Companies that looked cheap on compressed multiples fell further as sentiment deteriorated.
2023-2024: The worst active stretch. Two consecutive years of negative absolute returns (-17.6%, -16.2%) against strong SPY gains (+26.0%, +25.3%). The Thai market struggled with slowing domestic growth, weak tourism recovery relative to expectations, and currency pressure. The compression signal fired on companies that continued to deteriorate rather than recover.
The SET's Unusual Characteristics
The Stock Exchange of Thailand behaves differently from most developed markets in this screen, and the statistics reflect it.
Thailand's SET is dominated by banks, property developers, energy companies, and consumer businesses with a primarily domestic orientation. These companies don't move with Nasdaq or US tech cycles. Their earnings drivers are Thai GDP growth, local interest rates, property prices, and baht stability. When a Thai consumer bank's P/E compresses, it's usually reacting to domestic credit cycle concerns, not global risk appetite.
That domestic isolation creates the low beta. A beta of 0.252 over 25 years is the lowest of any market we tested. The portfolio wasn't correlated to US markets because the underlying companies weren't correlated to US markets. Down capture of 35.7% follows directly from this. In years when global markets sold off, Thai SET companies in this screen often just continued their own cycle.
The strategy finds an average of 21.8 qualifying stocks per year when invested, a reasonable universe for a 30-stock portfolio. The quality filters work cleanly on SET companies, which tend to have stable (if unspectacular) ROE profiles in the banking and consumer sectors.
The honest read on the results: this is a borderline result. +0.23% annual excess is within noise. A 48% win rate means you'd lose to SPY slightly more often than you'd beat it. The strategy doesn't clearly add alpha in the traditional sense. What it adds is diversification. For a USD-denominated investor, low correlation to US markets has independent value.
Full Annual Returns
Years 2000-2005 and 2008 held cash (fewer than 10 qualifying stocks)
| Year | Portfolio | S&P 500 | Excess |
|---|---|---|---|
| 2000 | 0.0% | -10.5% | +10.5% (cash) |
| 2001 | 0.0% | -9.2% | +9.2% (cash) |
| 2002 | 0.0% | -19.9% | +19.9% (cash) |
| 2003 | 0.0% | +24.1% | -24.1% (cash) |
| 2004 | 0.0% | +10.2% | -10.2% (cash) |
| 2005 | 0.0% | +7.2% | -7.2% (cash) |
| 2006 | +4.1% | +13.7% | -9.5% |
| 2007 | +41.2% | +4.4% | +36.8% |
| 2008 | 0.0% | -34.3% | +34.3% (cash) |
| 2009 | +46.5% | +24.7% | +21.7% |
| 2010 | +38.5% | +14.3% | +24.2% |
| 2011 | +28.9% | +2.5% | +26.4% |
| 2012 | +34.1% | +17.1% | +17.0% |
| 2013 | -6.2% | +27.8% | -34.0% |
| 2014 | +29.7% | +14.5% | +15.2% |
| 2015 | -7.4% | -0.1% | -7.3% |
| 2016 | +42.2% | +14.4% | +27.8% |
| 2017 | +16.4% | +21.6% | -5.2% |
| 2018 | -20.8% | -5.2% | -15.6% |
| 2019 | +7.6% | +32.3% | -24.7% |
| 2020 | +10.2% | +15.6% | -5.4% |
| 2021 | +14.4% | +31.3% | -16.9% |
| 2022 | -6.8% | -19.0% | +12.2% |
| 2023 | -17.6% | +26.0% | -43.6% |
| 2024 | -16.2% | +25.3% | -41.5% |
Limitations
High cash rate. 7 of 25 years in cash, including all of 2000-2005 and 2008. The effective test period is 18 years of active returns. The compounded base is different from strategies that were invested throughout.
Currency effects. Returns are in THB. The benchmark is SPY in USD. The THB/USD rate shifted over the 25-year period, which affects any direct comparison.
Borderline result. +0.23% annual excess isn't statistically meaningful. The 48% win rate means you'd slightly more often trail SPY than beat it in a given year. The defensiveness metrics are real, but the alpha case is weak.
Recent deterioration. 2023 and 2024 were both negative absolute and deeply negative relative to SPY. Two consecutive large underperformance years after the strategy was already borderline raises questions about whether the signal remains valid on SET.
Run It Yourself
git clone https://github.com/ceta-research/backtests.git
cd backtests

# Thailand backtest
python3 pe-compression/backtest.py --exchange SET --output results.json --verbose

# Current screen
python3 pe-compression/screen.py --exchange SET
Part of a Series
This is the Thailand analysis. We tested the same screen across 19 exchanges globally:
- Global comparison →. The East-West divide across 19 markets
- US analysis →, 9.97% CAGR, +2.32% excess, where it works best
- UK analysis →, 9.02% CAGR, +1.38% excess
- Canada analysis →, 8.75% CAGR, 23.7% down capture
Run It Yourself
Explore the data behind this analysis on Ceta Research. Query our financial data warehouse with SQL, build custom screens, and run your own backtests across 70,000+ stocks on 20 exchanges.
Data: Ceta Research (FMP financial data warehouse), 2000-2025. Returns in THB. Benchmark: SPY (USD). Full methodology: METHODOLOGY.md. Past performance doesn't guarantee future results.


