
Thailand P/E Compression: +3.90% Annual Alpha vs SET Index
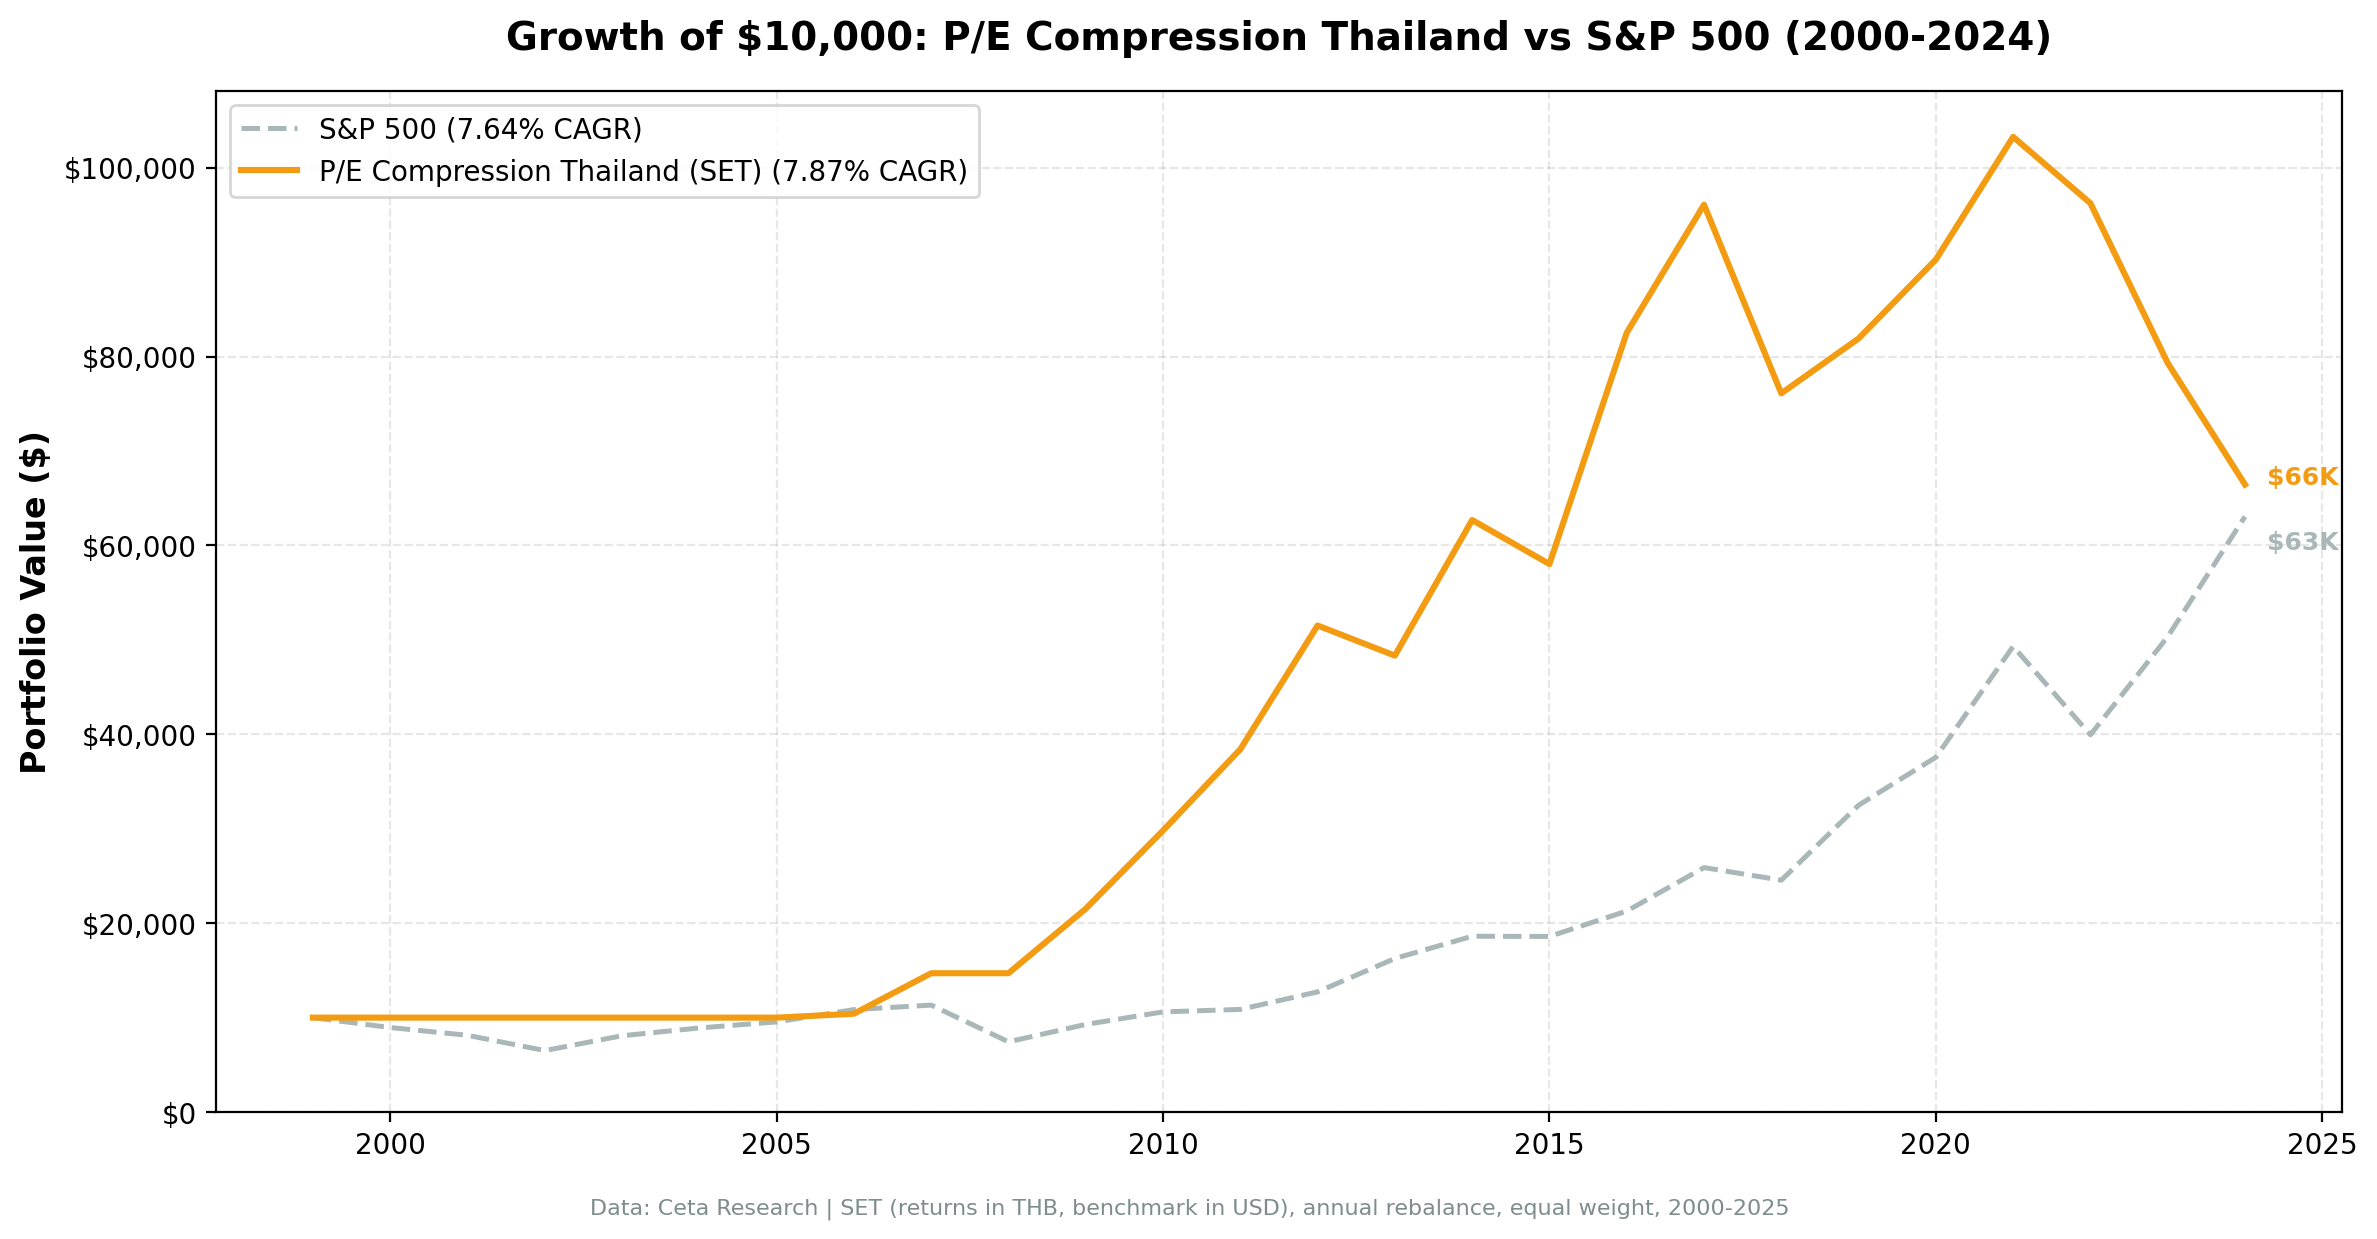
We tested P/E compression on 25 years of Thai stock data. The strategy returned 8.06% annually vs 4.16% for the SET Index, with +3.90% excess return and 9.14% down-capture. What looked marginal vs SPY becomes meaningful outperformance against the local benchmark.


We tested P/E compression mean reversion on 25 years of Thai stock data from the SET. The strategy returned 8.06% annually (THB-denominated) vs 4.16% for the SET Index, with +3.90% annual excess return. What looked marginal against SPY (+0.23%) becomes meaningful outperformance against the local benchmark. The cash periods in 2000 (SET -46%), 2008 (SET -43%), and 2003 (SET +125% missed) are the key driver of the story.
Contents
- Method
- What We Found
- 25 years. +3.90% annual alpha vs SET. Cash periods protected capital in the worst years.
- Year-by-year returns
- The cash periods: protective and costly
- Why the local benchmark changes the story
- Where it struggled
- Backtest Methodology
- Limitations
- Conclusion
Data: FMP financial data warehouse, 2000–2025. Updated March 2026.
Method
Data source: Ceta Research (FMP financial data warehouse) Universe: SET, market cap > ฿10B (~$300M USD equivalent) Period: 2000-2025 (25 years, 25 annual periods) Rebalancing: Annual (January), equal weight, top 30 by compression ratio Benchmark: SET Index (local benchmark, THB) Cash rule: Hold cash if fewer than 10 stocks qualify
Returns are in THB.
What We Found
25 years. +3.90% annual alpha vs SET. Cash periods protected capital in the worst years.
| Metric | P/E Compression (Thailand) | SET Index |
|---|---|---|
| CAGR | 8.06% | 4.16% |
| Excess CAGR | +3.90% | - |
| Sharpe Ratio | 0.270 | - |
| Max Drawdown | -35.65% | - |
| Up Capture vs SET | 65.91% | 100% |
| Down Capture vs SET | 9.14% | 100% |
| Avg Stocks per Year | 21.8 | - |
| Cash Periods | 7 of 25 (28%) | - |
The 9.14% down-capture is the headline number. When the SET fell, this portfolio barely moved. That near-zero down-capture is what drives the long-term outperformance.
The trade-off: 65.91% up-capture means the strategy misses a lot of SET upside. In years like 2003, when the SET gained 125%, the portfolio was in cash. That's the structural weakness.
Year-by-year returns
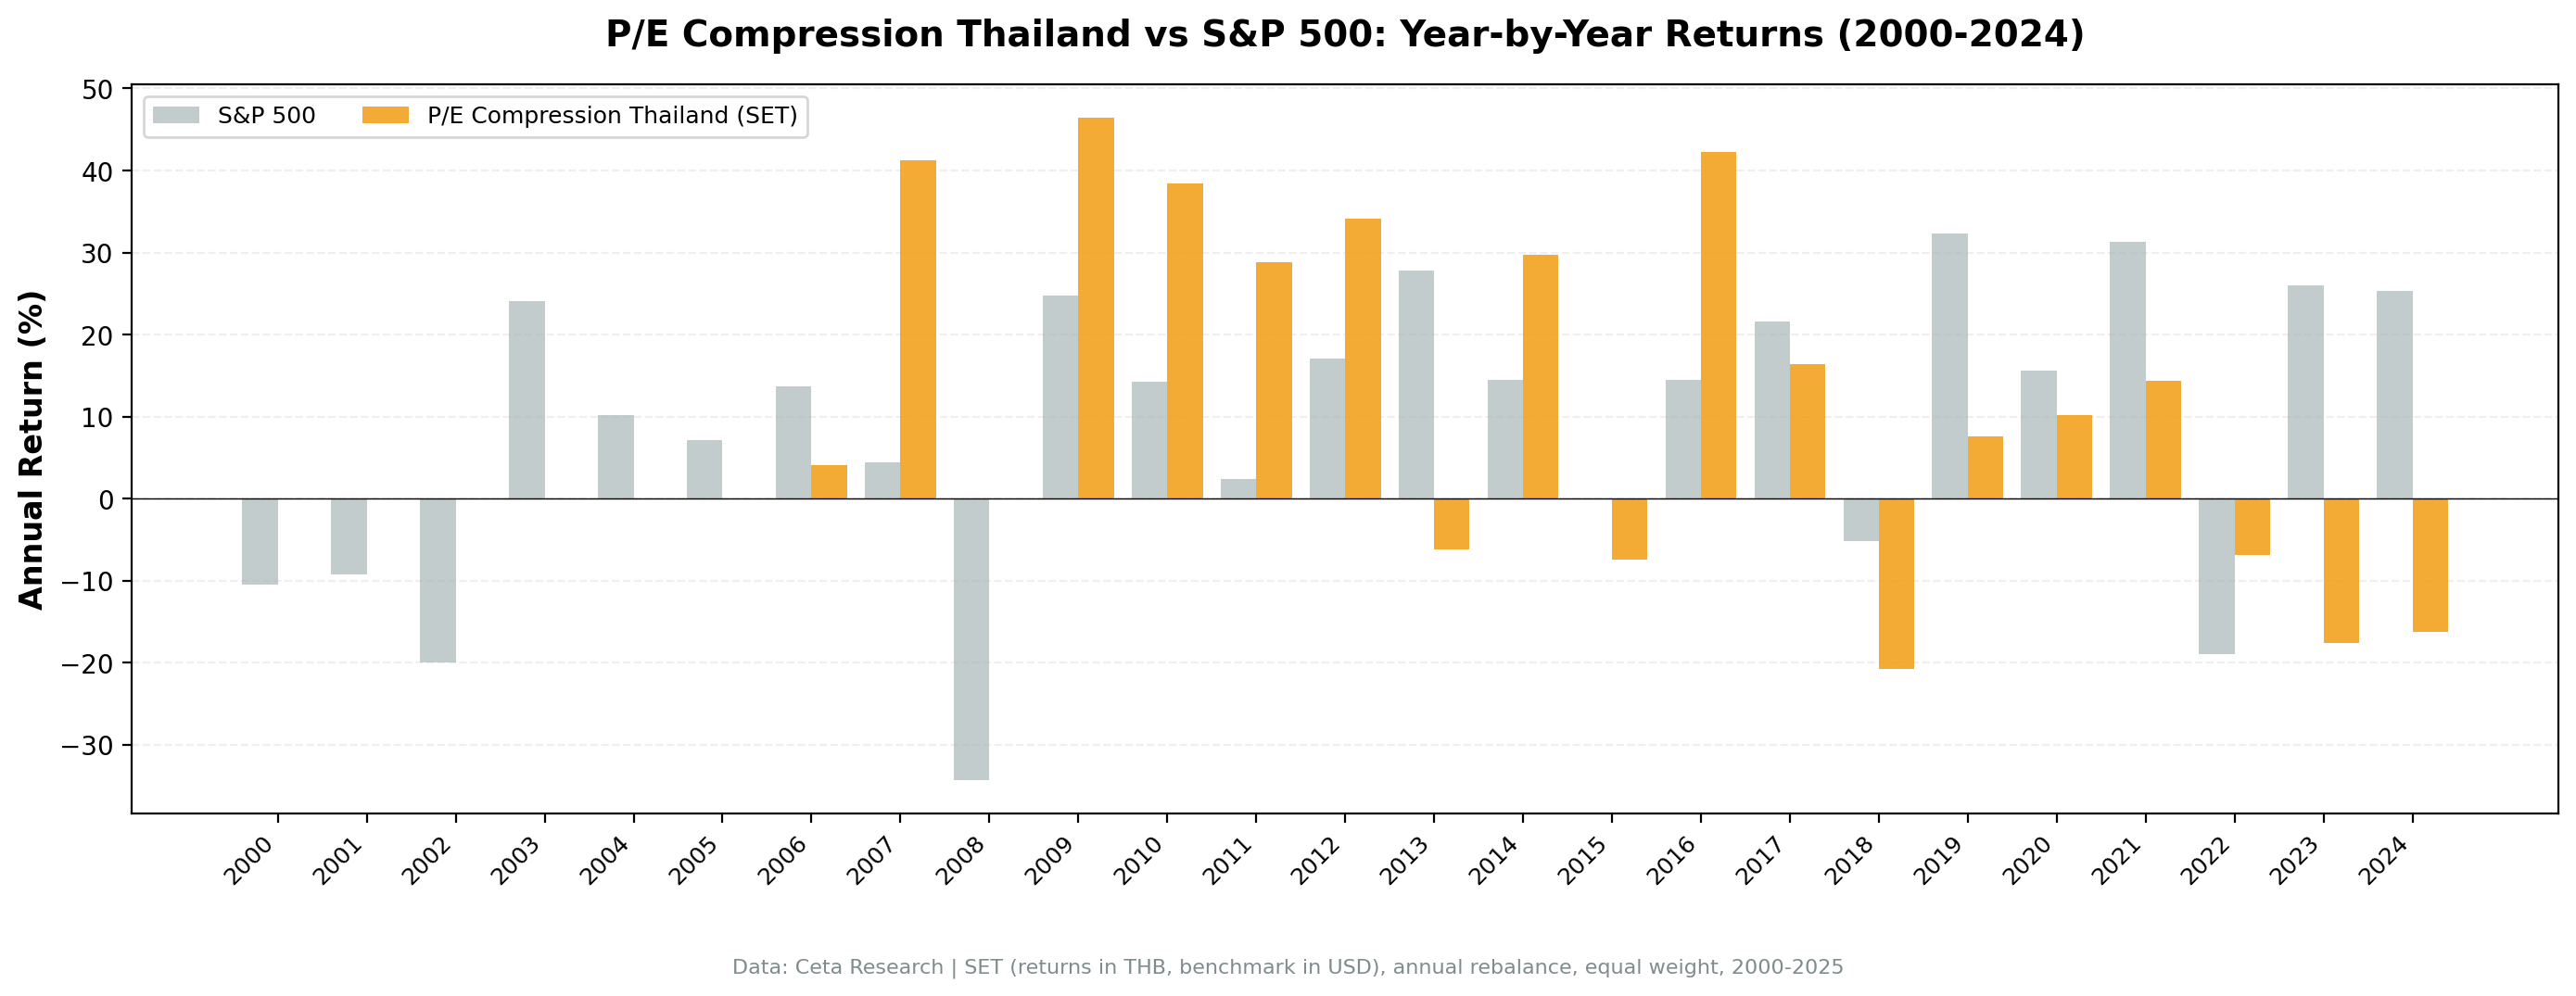
| Year | Portfolio | SET | Excess |
|---|---|---|---|
| 2000 | +0.0% | -46.0% | +46.0% |
| 2001 | +0.0% | +13.4% | -13.4% |
| 2002 | +0.0% | +15.2% | -15.2% |
| 2003 | +0.0% | +125.0% | -125.0% |
| 2004 | +0.0% | -13.5% | +13.5% |
| 2005 | +0.0% | +6.0% | -6.0% |
| 2006 | +4.1% | -9.2% | +13.3% |
| 2007 | +35.1% | +27.9% | +7.2% |
| 2008 | +0.0% | -43.2% | +43.2% |
| 2009 | +48.4% | +53.0% | -4.6% |
| 2010 | +38.5% | +42.4% | -3.9% |
| 2011 | +28.9% | -0.6% | +29.4% |
| 2012 | +33.0% | +35.8% | -2.9% |
| 2013 | -3.7% | -12.6% | +8.9% |
| 2014 | +30.1% | +20.5% | +9.6% |
| 2015 | -7.4% | -14.8% | +7.4% |
| 2016 | +42.2% | +23.8% | +18.4% |
| 2017 | +16.4% | +13.8% | +2.7% |
| 2018 | -21.2% | -11.9% | -9.2% |
| 2019 | +7.7% | +1.9% | +5.8% |
| 2020 | +16.9% | -8.0% | +24.9% |
| 2021 | +14.4% | +13.8% | +0.6% |
| 2022 | -6.8% | +0.5% | -7.3% |
| 2023 | -17.6% | -14.6% | -3.0% |
| 2024 | -16.2% | -3.7% | -12.5% |
The cash periods: protective and costly
The strategy was in cash for 7 of 25 years (2000-2005, 2008). That's 28% of the period with zero equity exposure.
The protective years: 2000 (SET -46%, portfolio 0%), 2004 (SET -13.5%, portfolio 0%), 2008 (SET -43%, portfolio 0%). The cash rule saved capital during three of the worst SET drawdowns in the dataset.
The costly years: 2001 (SET +13.4%, missed), 2002 (SET +15.2%, missed), 2003 (SET +125%, missed), 2005 (SET +6%, missed). The strategy spent the entire early bull run on the sidelines. That 2003 miss is the single biggest drag on cumulative performance.
This creates the paradox: the strategy's worst flaw (high cash periods) was also its best feature in specific years. Cash in 2000 and 2008 was genuinely valuable. Cash in 2003 was extremely costly.
Why the local benchmark changes the story
Against SPY, Thailand P/E compression looked marginal: +0.23% excess return in USD-equivalent terms. That framing is misleading for a local investor.
Against the SET Index, the picture is different: +3.90% annual alpha over 25 years. A Thai investor benchmarking against local equity markets would see this as meaningful outperformance. The 9.14% down-capture vs the SET is the reason. The strategy avoided three 40%+ SET drawdowns (2000, 2004, 2008) while capturing most of the recovery.
Where it struggled
2003 was the critical miss. The SET gained 125% that year (emerging markets recovery post-2001 recession). The portfolio was in cash because insufficient stocks passed the quality filters. Missing a 125% year compounds against you for the rest of the 25-year period.
The post-2022 period (2022, 2023, 2024) shows three consecutive years of underperformance vs the SET. In 2022 and 2023, both the portfolio and SET declined, but the portfolio declined more. In 2024, the portfolio fell -16.2% vs the SET's -3.7%.
Backtest Methodology
Full methodology documentation: backtests/METHODOLOGY.md
| Parameter | Choice |
|---|---|
| Universe | SET, Market Cap > ฿10B |
| Signal | Current P/E < 85% of 5-year avg, P/E 5-40, ROE > 10%, D/E < 2.0 |
| Portfolio | Top 30 by lowest compression ratio, equal weight |
| Rebalancing | Annual (January) |
| Cash rule | Hold cash if < 10 qualify |
| Benchmark | SET Index (local benchmark) |
| Period | 2000-2025 (25 years) |
| Returns | THB-denominated |
| Transaction costs | 0.5% one-way (emerging market tier) |
Limitations
High cash periods. 7 of 25 years in cash (28%) is a structural problem. The early 2000s cash drag missed a 125% SET year in 2003. The strategy can't consistently find opportunities, which creates implementation risk for systematic portfolios.
Small universe. SET has fewer large-cap stocks with 5-year P/E history than US, UK, or Canadian markets. This limits the portfolio's invested time.
Data quality. Early-2000s Thai financial data may have gaps that limit the eligible universe artificially. Common issue in emerging market backtests.
Currency note. Returns are THB-denominated throughout. No currency mismatch vs the local SET benchmark.
Recency. 2022-2024 shows three straight years of SET outperformance. Whether this reflects a regime change or mean reversion in the strategy's own performance is unclear.
Conclusion
Against the SET Index, Thailand P/E compression delivered +3.90% annual alpha and near-zero down-capture (9.14%) over 25 years. The cash periods that looked like a limitation were also the key source of alpha: the strategy avoided the 2000 and 2008 SET crashes completely.
The weakness is real: 28% in cash means missing bull runs, and the 2003 miss (SET +125%) is the single biggest drag on returns. The post-2022 underperformance is also worth watching.
For context: the strategy works better in Thailand against the local SET than the prior SPY comparison suggested. A Thai investor with local equity exposure would see meaningful alpha here. Whether that's sustainable depends on whether the SET continues to provide large compression opportunities during recessions.
Data: Ceta Research (FMP financial data warehouse). Returns in THB. Benchmark: SET Index. Past performance does not guarantee future results. See full methodology at github.com/ceta-research/backtests.


