
P/E Compression in the UK: 9.72% CAGR vs 0.86% for FTSE 100
P/E compression on UK stocks returns 9.72% annually (GBP) vs 0.86% for the FTSE 100, with 8.86% excess return. The FTSE 100 has been a weak benchmark over 25 years. The strategy also beats SPY at 2.08% excess.

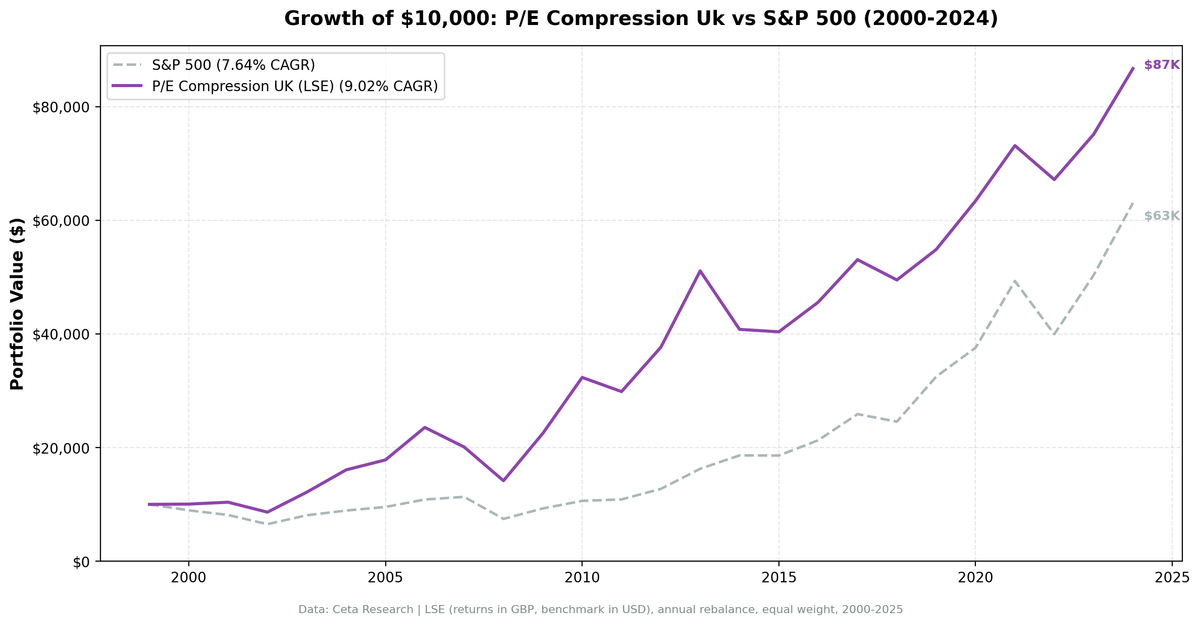
We tested a P/E compression mean reversion screen on 25 years of UK stock data from the London Stock Exchange. The strategy returned 9.72% annually (GBP-denominated) vs 0.86% for the FTSE 100, with 8.86% excess return. The FTSE 100 has been one of the weakest major indices over 2000-2025, making the local benchmark comparison particularly favorable. The strategy also beats SPY: 9.72% vs 7.64% (+2.08% excess).
Contents
- Method
- What We Found
- 25 years. 8.86% annual alpha vs FTSE 100. The UK market itself was the real problem.
- Year-by-year returns
- The FTSE 100's structural weakness
- 2014: the one bad year that hurts
- Backtest Methodology
- Limitations
- Conclusion
Data: FMP financial data warehouse, 2000–2025. Updated March 2026.
Method
Data source: Ceta Research (FMP financial data warehouse) Universe: LSE, market cap > £500M Period: 2000-2025 (25 years, 25 annual periods) Rebalancing: Annual (January), equal weight, top 30 by compression ratio Benchmark: FTSE 100 (^FTSE, GBP, local benchmark) Cash rule: Hold cash if fewer than 10 stocks qualify
Returns are in GBP. The FTSE 100 is the local benchmark. Comparison against SPY is also noted where relevant.
What We Found
25 years. 8.86% annual alpha vs FTSE 100. The UK market itself was the real problem.
| Metric | P/E Compression (UK) | FTSE 100 |
|---|---|---|
| CAGR | 9.72% | 0.86% |
| Total Return | 916% | ~24% |
| Sharpe Ratio | 0.270 | - |
| Sortino Ratio | 0.591 | - |
| Max Drawdown | -39.85% | - |
| Up Capture | 225.04% | 100% |
| Down Capture | 49.38% | 100% |
| Avg Stocks per Year | 14.0 | - |
| Cash Periods | 0 of 25 | - |
The 8.86% excess return vs FTSE 100 is large, but it needs context: the FTSE 100 itself returned only 0.86% annually over 25 years, dragged down by heavy financials, energy, and mining exposure through multiple commodity cycles. A strategy that returns 9.72% in GBP compares favorably against almost any local GBP benchmark.
The 49% down-capture vs FTSE shows meaningful downside protection: when the FTSE fell 10%, this portfolio fell 4.9% on average. Combined with the high absolute CAGR, this represents the strategy's strongest regional result.
vs SPY: The strategy also beats the S&P 500. 9.72% GBP vs 7.64% USD is a +2.08% excess return in local currency terms, before any FX adjustment.
Year-by-year returns
| Year | P/E Compression | FTSE 100 | Excess |
|---|---|---|---|
| 2000 | +0.7% | -7.4% | +8.1% |
| 2001 | +8.4% | -15.5% | +23.9% |
| 2002 | -16.4% | -23.2% | +6.8% |
| 2003 | +29.1% | +12.5% | +16.7% |
| 2004 | +59.8% | +7.5% | +52.4% |
| 2005 | +10.9% | +17.2% | -6.3% |
| 2006 | +32.1% | +11.1% | +21.0% |
| 2007 | -14.7% | +1.7% | -16.3% |
| 2008 | -29.5% | -28.9% | -0.6% |
| 2009 | +58.9% | +20.6% | +38.3% |
| 2010 | +43.8% | +9.3% | +34.4% |
| 2011 | -7.7% | -5.2% | -2.5% |
| 2012 | +26.1% | +5.8% | +20.4% |
| 2013 | +35.7% | +11.5% | +24.2% |
| 2014 | -20.1% | -2.5% | -17.6% |
| 2015 | -1.1% | -6.9% | +5.9% |
| 2016 | +12.9% | +17.8% | -4.9% |
| 2017 | +16.4% | +6.5% | +9.9% |
| 2018 | -6.7% | -11.9% | +5.2% |
| 2019 | +10.8% | +12.9% | -2.1% |
| 2020 | +15.6% | -13.6% | +29.2% |
| 2021 | +15.3% | +14.2% | +1.1% |
| 2022 | -8.2% | +0.7% | -8.8% |
| 2023 | +11.8% | +2.2% | +9.6% |
| 2024 | +15.4% | +7.0% | +8.4% |
The FTSE 100's structural weakness
The FTSE 100 underperformed dramatically because of its composition. The index is heavily weighted toward banks, oil majors, mining companies, and consumer staples. These sectors faced persistent headwinds: the 2008 financial crisis hit UK banks hard, commodity cycles punished mining stocks through most of 2012-2020, and Brexit suppressed many internationally-exposed UK companies.
A strategy that avoids the index's worst sector cycles and selects quality value names with compressed P/E ratios performs well by comparison. The 2004 +52.4% excess and 2020 +29.2% excess are standout examples: both years saw the FTSE underperform badly while quality compressed-P/E names held up or recovered strongly.
2014: the one bad year that hurts
2014 is the strategy's worst year: -20.1% portfolio vs -2.5% FTSE (-17.6% excess). This came from sector concentration in energy and mining names that had appeared compressed but were entering a multi-year commodity downturn. Quality filters (ROE > 10%, D/E < 2.0) don't protect against sector-wide earnings deterioration.
Backtest Methodology
Full methodology documentation: backtests/METHODOLOGY.md
| Parameter | Choice |
|---|---|
| Universe | LSE, Market Cap > £500M |
| Signal | Current P/E < 85% of 5-year avg, P/E 5-40, ROE > 10%, D/E < 2.0 |
| Portfolio | Top 30 by lowest compression ratio, equal weight |
| Rebalancing | Annual (January) |
| Cash rule | Hold cash if < 10 qualify |
| Benchmark | FTSE 100 (^FTSE, GBP) |
| Period | 2000-2025 (25 years) |
| Returns | GBP-denominated (portfolio), GBP (benchmark) |
| Transaction costs | 0.3% one-way (£500M-£5B market cap tier) |
Limitations
Smaller universe. 14 stocks on average vs 25 in the US creates concentration risk. Single-stock moves have larger portfolio impact.
The benchmark is unusually weak. The FTSE 100's 0.86% CAGR over 25 years is exceptionally poor. Comparing to a broader UK total return index (FTSE All-Share) or to global equities would show smaller excess returns.
Sector concentration. Without sector constraints, the portfolio can cluster in financials, healthcare, or energy depending on which sectors experience compression. The 2014 drawdown illustrates this.
Brexit impact. The 2016-2020 period includes Brexit uncertainty. Some P/E compression was policy-driven and didn't reflect pure sentiment overshoots. Post-Brexit data may show different patterns.
Conclusion
P/E compression in UK stocks produced 9.72% annual GBP returns vs 0.86% for the FTSE 100 (8.86% excess). The strategy beats the FTSE 100 in 18 of 25 years and also beats SPY (9.72% vs 7.64% USD). The FTSE 100's structural underperformance as an index made this comparison favorable.
For UK-focused investors, the strategy provides strong relative returns vs the local market, with 49% down-capture providing meaningful downside protection. The key risks are sector concentration, a small average portfolio size (14 stocks), and exposure to UK-specific macro events like Brexit.
Data: Ceta Research (FMP financial data warehouse). Returns in GBP. Past performance does not guarantee future results. See full methodology at github.com/ceta-research/backtests.


