
P/E Mean Reversion in India: 11.14% CAGR Over BSE + NSE Data

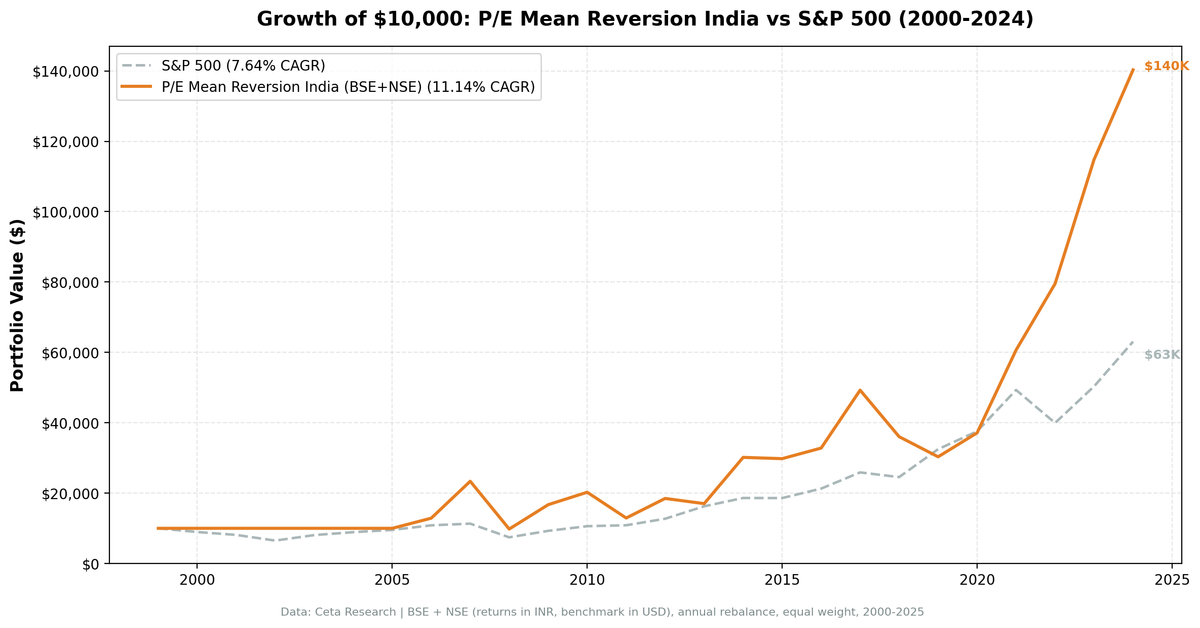
We tested a sector-relative P/E mean reversion screen on 25 years of Indian stock data from BSE and NSE. The signal fires when a stock trades at a 40%+ discount to its sector peers on P/E, filtered for profitability and manageable debt. The strategy returned 11.14% annually vs 7.64% for the S&P 500, with 3.50% excess return, 145% up-capture, and 56% down-capture over the effective backtest period.
Contents
- Method
- What Is Sector-Relative P/E Mean Reversion?
- The Screen
- Sector-Relative P/E Screen for India (SQL)
- What We Found
- 19 effective years. 3.50% annual alpha. Extreme volatility in both directions.
- Year-by-year returns
- 2006–2007: India's bull market
- 2008: worst year
- 2009: dramatic recovery
- 2011 and 2013: domestic slowdowns
- 2014: Modi election rally
- 2019: the NBFC crisis
- 2021–2023: India's bull run
- Crisis comparison
- Backtest Methodology
- Limitations
- Conclusion
India is the most volatile market in this global study. Massive gains, severe drawdowns, and complete decoupling from US market cycles. This isn't a smooth ride.
Method
- Data source: Ceta Research (FMP financial data warehouse)
- Universe: BSE + NSE, market cap > ₹20B INR
- Period: 2000–2024 (25 years), effective: 2006–2024 (19 invested years)
- Rebalancing: Annual (January), equal weight, top 30 by lowest P/E-to-sector ratio
- Benchmark: S&P 500 Total Return (SPY)
- Cash rule: Hold cash if fewer than 10 stocks qualify
Financial data sourced from financial_ratios_ttm for P/E, key_metrics_ttm for ROE. 45-day lag on all financial statements to prevent look-ahead bias.
What Is Sector-Relative P/E Mean Reversion?
This strategy compares each stock's P/E to its sector peers, not to its own history. A tech stock trading at 12x when its sector median is 25x is flagged as deeply discounted. A consumer stock at 14x when its sector trades at 15x isn't.
The bet: when a healthy company trades at a large discount to sector norms, it tends to mean revert. Either the stock re-rates upward, or it gets acquired, or earnings growth closes the gap. This is cross-sectional value, not longitudinal compression.
Signal: - Stock P/E < 60% of sector median P/E (40%+ discount to peers) - P/E range: 3–50 (exclude extreme valuations) - Minimum 5 stocks in sector to calculate a valid median
Quality filters:
| Criterion | Metric | Threshold |
|---|---|---|
| Profitable | Return on Equity | > 8% |
| Manageable debt | Debt-to-Equity | < 2.0 |
Size:
| Criterion | Metric | Threshold |
|---|---|---|
| Meaningful liquidity | Market Cap | > ₹20B INR |
Stocks must pass all filters. The top 30 by lowest P/E-to-sector ratio are selected each year, equal weighted.
The Screen
Sector-Relative P/E Screen for India (SQL)
WITH universe AS (
 SELECT k.symbol, p.companyName, p.exchange, p.sector,
 fr.priceToEarningsRatioTTM AS pe_ttm, k.returnOnEquityTTM AS roe,
 fr.debtToEquityRatioTTM AS de, k.marketCap
 FROM key_metrics_ttm k
 JOIN financial_ratios_ttm fr ON k.symbol = fr.symbol
 JOIN profile p ON k.symbol = p.symbol
 WHERE fr.priceToEarningsRatioTTM BETWEEN 3 AND 50
 AND k.returnOnEquityTTM > 0.08
 AND (fr.debtToEquityRatioTTM IS NULL OR (fr.debtToEquityRatioTTM >= 0 AND fr.debtToEquityRatioTTM < 2.0))
 AND k.marketCap > 20000000000
 AND p.sector IS NOT NULL
 AND p.exchange IN ('BSE', 'NSE')
),
sector_medians AS (
 SELECT sector,
 PERCENTILE_CONT(0.5) WITHIN GROUP (ORDER BY pe_ttm) AS median_pe,
 COUNT(*) AS n_sector_stocks
 FROM universe GROUP BY sector HAVING COUNT(*) >= 5
)
SELECT u.symbol, u.companyName, u.exchange, u.sector,
 ROUND(u.pe_ttm, 2) AS pe_ttm, ROUND(sm.median_pe, 2) AS sector_median_pe,
 ROUND(u.pe_ttm / sm.median_pe, 3) AS pe_ratio_to_sector,
 ROUND((1 - u.pe_ttm / sm.median_pe) * 100, 1) AS discount_pct,
 ROUND(u.roe * 100, 1) AS roe_pct, ROUND(u.de, 2) AS debt_to_equity,
 ROUND(u.marketCap / 1e9, 0) AS mktcap_b_inr
FROM universe u JOIN sector_medians sm ON u.sector = sm.sector
WHERE u.pe_ttm / sm.median_pe < 0.60
ORDER BY u.pe_ttm / sm.median_pe ASC LIMIT 30
Run this query on Ceta Research
What We Found

19 effective years. 3.50% annual alpha. Extreme volatility in both directions.
| Metric | P/E Mean Reversion (India) | S&P 500 |
|---|---|---|
| CAGR | 11.14% | 7.64% |
| Total Return | 1,302.86% | 530.71% |
| Sharpe Ratio | 0.131 | 0.322 |
| Sortino Ratio | 0.257 | 0.556 |
| Max Drawdown | -58.11% | -34.90% |
| Up Capture | 145.28% | 100% |
| Down Capture | 56.14% | 100% |
| Win Rate vs SPY | 56% | - |
| Avg Stocks per Year | 25.7 | - |
| Cash Periods | 6 of 25 (all 2000–2005) | - |
$10,000 grew to ~$140,286 vs $63,071 for SPY. The CAGR is compelling. But the Sharpe ratio of 0.131 tells the real story: India's annual volatility runs 35.34% vs 17.51% for SPY. The excess return comes with a rough ride.
The asymmetry is striking: 145% up-capture means when SPY gains 10%, this portfolio gains 14.5% on average. Down-capture of 56% means SPY's losses were partially absorbed. But that 56% figure doesn't mean smooth protection. It masks years of severe declines that just happen to be offset by years of enormous gains.
One important caveat on the data. The backtest covers 2000–2024, but the strategy holds cash for all six years from 2000 through 2005. FMP's coverage of Indian markets before 2006 is thin: not enough qualifying stocks pass the quality and market cap filters to form a portfolio. The effective backtest runs 2006–2024, covering 19 years. Any interpretation of long-run performance should start from 2006.
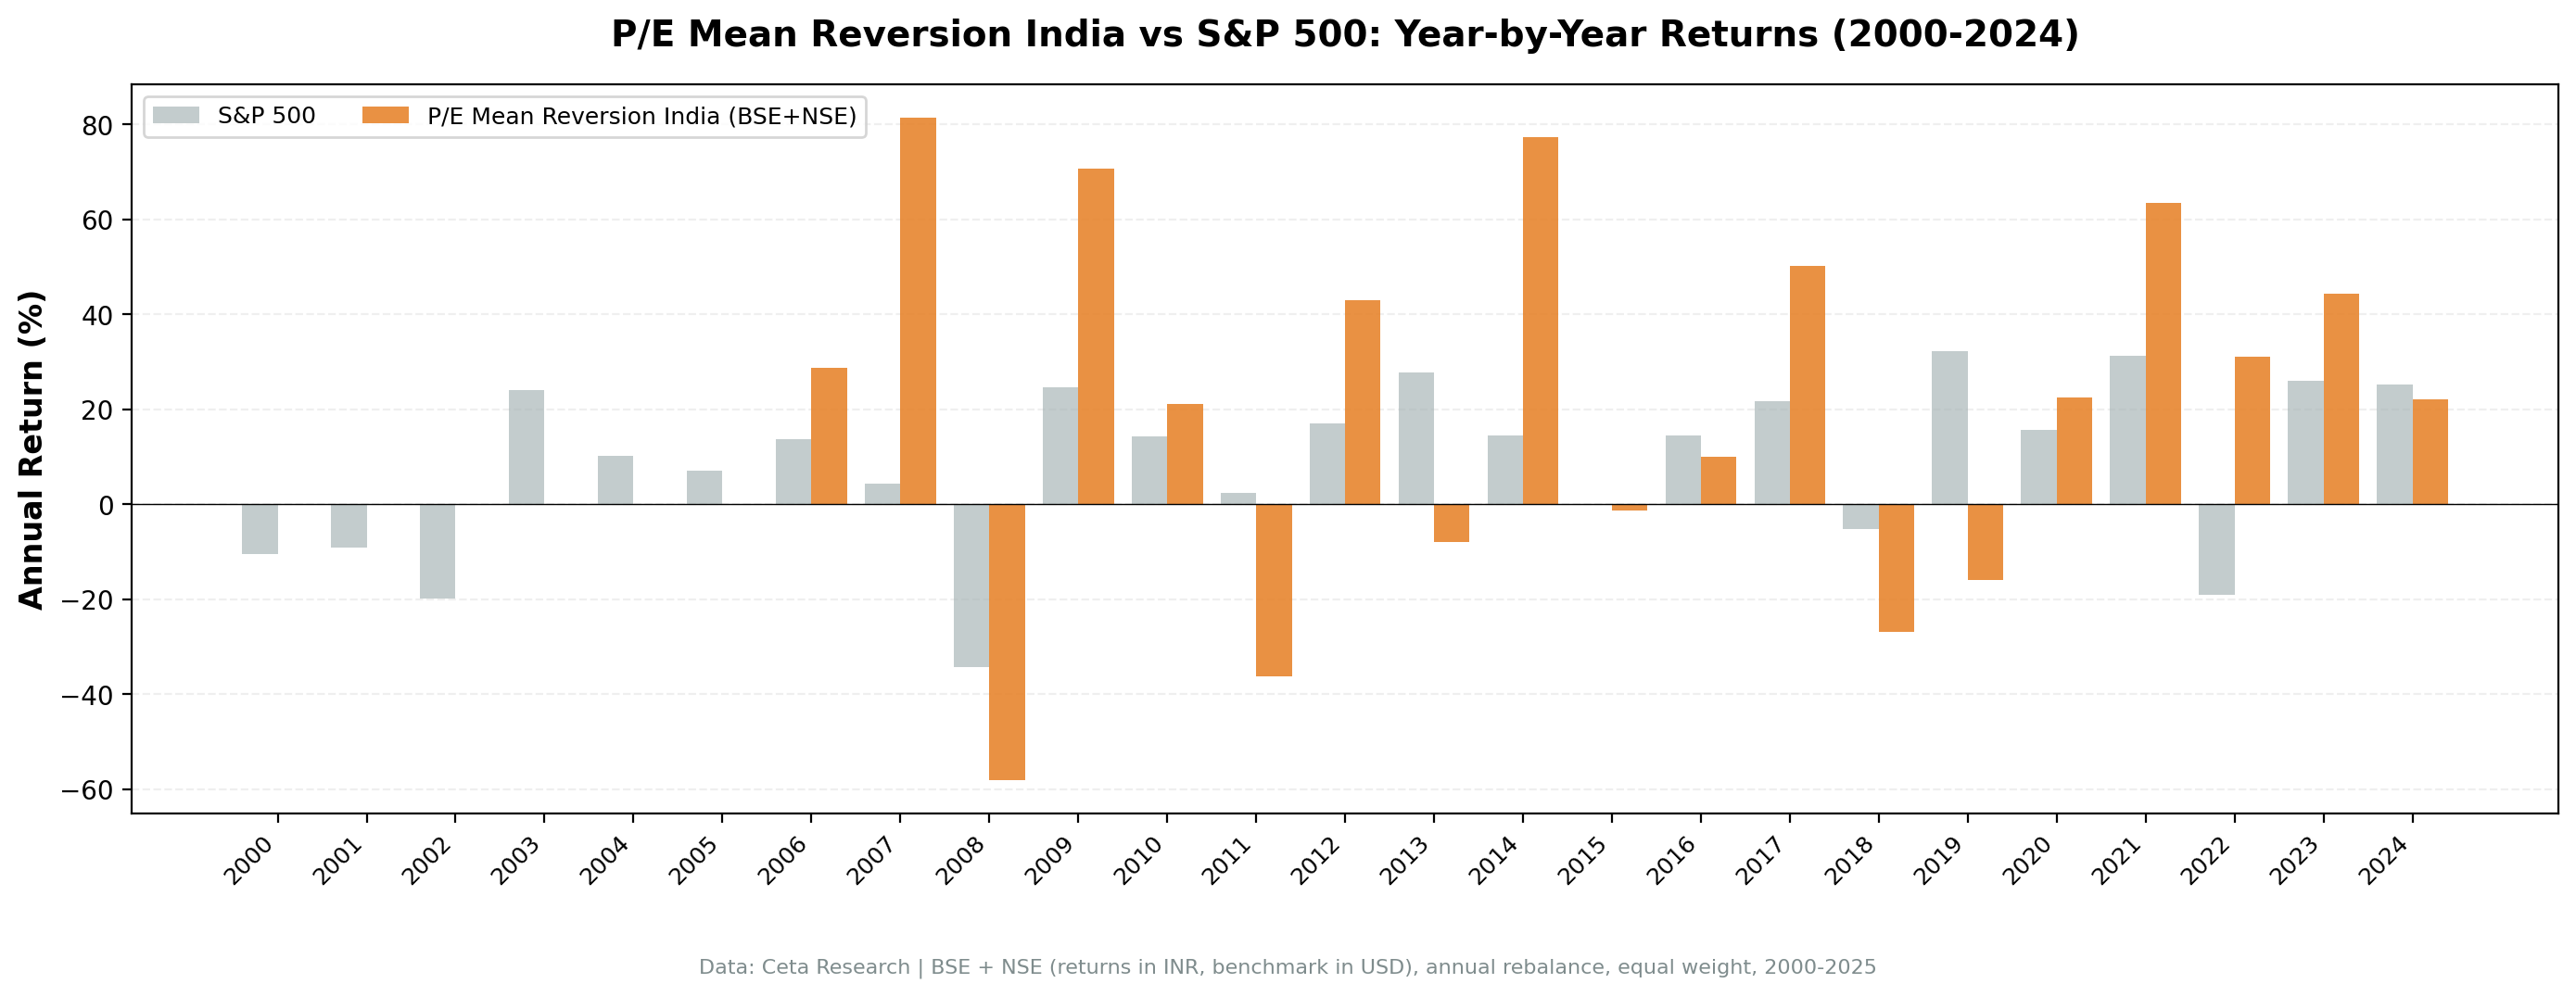
Year-by-year returns
| Year | India P/E MR | S&P 500 | Excess |
|---|---|---|---|
| 2000 | Cash (0.0%) | -10.5% | — |
| 2001 | Cash (0.0%) | -9.2% | — |
| 2002 | Cash (0.0%) | -19.9% | — |
| 2003 | Cash (0.0%) | +24.1% | — |
| 2004 | Cash (0.0%) | +10.2% | — |
| 2005 | Cash (0.0%) | +7.2% | — |
| 2006 | +28.8% | +13.7% | +15.2% |
| 2007 | +81.5% | +4.4% | +77.0% |
| 2008 | -58.1% | -34.3% | -23.8% |
| 2009 | +70.8% | +24.7% | +46.0% |
| 2010 | +21.1% | +14.3% | +6.8% |
| 2011 | -36.1% | +2.5% | -38.6% |
| 2012 | +43.0% | +17.1% | +25.9% |
| 2013 | -8.0% | +27.8% | -35.7% |
| 2014 | +77.3% | +14.5% | +62.8% |
| 2015 | -1.2% | -0.1% | -1.1% |
| 2016 | +10.1% | +14.4% | -4.4% |
| 2017 | +50.2% | +21.6% | +28.6% |
| 2018 | -26.9% | -5.2% | -21.7% |
| 2019 | -15.8% | +32.3% | -48.2% |
| 2020 | +22.4% | +15.6% | +6.8% |
| 2021 | +63.4% | +31.3% | +32.1% |
| 2022 | +31.1% | -19.0% | +50.0% |
| 2023 | +44.4% | +26.0% | +18.4% |
| 2024 | +22.2% | +25.3% | -3.1% |
2006–2007: India's bull market
The strategy started strong. India was in the middle of a sustained economic expansion, and deeply discounted sector-relative value stocks participated fully. +28.8% in 2006, then +81.5% in 2007 as the rally broadened across sectors. The sector-relative signal was firing on large discounts that then closed fast.
This is the strategy doing exactly what it's designed to do: cheap-to-peers stocks catching up when the market is rising broadly.
2008: worst year
-58.1% in a single year. India suffered a severe bear market as global capital fled emerging markets. Quality filters didn't help. When beta amplifies a global sell-off, P/E compression protection breaks down. The max drawdown of -58.11% is the deepest in this global study.
The comparison to SPY (-34.3%) is misleading. SPY is US equities in USD. This portfolio is Indian equities in INR. Different economies, different currencies, different beta. What the 2008 result shows is that Indian equities have higher beta to global risk-off events than US equities. The strategy amplified the drawdown.
2009: dramatic recovery
+70.8% in 2009. This is the flip side of India's high beta. When global markets recovered, Indian value stocks snapped back hard. The 2008 drawdown was severe, but 2009 recovered most of it in a single year.
2011 and 2013: domestic slowdowns
Two painful years for Indian equities that didn't track US markets at all. 2011: -36.1% while SPY was +2.5%. 2013: -8.0% while SPY was +27.8%. These were India-specific corrections driven by inflation, policy uncertainty, and slowing growth. The strategy had no protection. India was its own story.
2014: Modi election rally
+77.3%. The BJP election win in May 2014 triggered a significant re-rating of Indian equities. Investors priced in economic reform and improved business conditions. The sector-relative signal had been sitting on discounted stocks through the 2012–2013 weakness, and the 2014 rally closed those gaps fast. One of the clearest examples of political catalyst driving value mean reversion.
2019: the NBFC crisis
-15.8% while SPY was +32.3%. A -48.2% excess return gap in a single year. This wasn't a global event. India's non-bank financial company (NBFC) sector collapsed after the IL&FS default in late 2018, triggering a domestic credit crunch. Financial sector stocks, which would have been well-represented in a value screen after the 2018 drawdown, continued falling. The strategy picked up exactly the sector the domestic crisis was targeting.
This is the critical risk in India: domestic idiosyncratic events that have nothing to do with global markets. You can't hedge this from outside India.
2021–2023: India's bull run
+63.4% in 2021, +31.1% in 2022 (while SPY fell 19%), +44.4% in 2023. Three extraordinary years. India's domestic economy recovered strongly from COVID, capital flows returned to emerging markets, and corporate earnings accelerated. The 2022 performance is especially notable: while US equities corrected on rate hikes, Indian equities continued rising. Complete decoupling.
Crisis comparison
| Event | India P/E MR | S&P 500 | Gap |
|---|---|---|---|
| Global financial crisis (2008) | -58.1% | -34.3% | -23.8% |
| India domestic slowdown (2011) | -36.1% | +2.5% | -38.6% |
| India NBFC crisis (2019) | -15.8% | +32.3% | -48.2% |
| US COVID recovery (2020) | +22.4% | +15.6% | +6.8% |
| US rate hike cycle (2022) | +31.1% | -19.0% | +50.0% |
The pattern is clear. India amplifies global risk-off events (2008). India can suffer independently from domestic crises (2011, 2019). And when India's own cycle is positive, it runs regardless of what US markets are doing (2021–2023).
Backtest Methodology
Full methodology documentation: backtests/METHODOLOGY.md
| Parameter | Choice |
|---|---|
| Universe | BSE + NSE, Market Cap > ₹20B INR |
| Signal | Stock P/E < 60% of sector median P/E, P/E 3–50, ROE > 8%, D/E < 2.0 |
| Portfolio | Top 30 by lowest P/E-to-sector ratio, equal weight |
| Rebalancing | Annual (January) |
| Cash rule | Hold cash if < 10 qualify |
| Benchmark | S&P 500 Total Return (SPY) |
| Period | 2000–2024 (25 years), effective 2006–2024 |
| Data | Point-in-time (45-day lag on FY financial statements) |
| Transaction costs | 0.1% one-way (size-tiered by market cap) |
Limitations
Extreme volatility. 35.34% annualized standard deviation vs 17.51% for SPY. The Sharpe ratio of 0.131 is low despite a high CAGR. Risk-adjusted returns are weak. If you size this the same as a US equity position, the portfolio swings are uncomfortable.
Severe max drawdown. -58.11% in 2008 is the strategy's worst year and its worst peak-to-trough decline. Investors who entered in 2007 and held through 2008 lost more than half their capital before recovery.
Only 19 effective years. The 2000–2005 cash periods mean this backtest has fewer data points than it appears. There are 19 invested years, not 25.
India-specific crises. The 2019 NBFC crisis caused a -48.2% excess return gap vs SPY in a single year. Domestic Indian credit events, policy changes, and regulatory shocks aren't visible in global indicators. They can't be anticipated from a global macro perspective.
Currency risk. Portfolio returns are in INR. US investors holding Indian equities face INR/USD fluctuations. India has experienced periods of INR depreciation, which would reduce returns when converted to USD.
Down-capture of 56%. This is less protection than UK (42%) or Germany (43%) in the same study. India's high beta means losses can be severe even when the strategy holds sound stocks.
Sector concentration. Without a sector cap, the January screen can cluster heavily in financials or industrials depending on the year. 2018–2019 exposure to Indian financials during the NBFC crisis is an example of this concentration risk materializing.
Conclusion
Sector-relative P/E mean reversion worked in India over 19 effective years, delivering 3.50% annual alpha and growing $10,000 to $140,286 vs $63,071 for SPY. The up-capture of 145% and excess returns during Indian bull markets (2006–2007, 2012, 2014, 2017, 2021–2023) drove the outperformance.
The cost is extreme volatility, a -58% drawdown in 2008, and severe domestic risk that doesn't show up in global signals. The 2019 NBFC crisis is the clearest example: a domestic credit event that had nothing to do with global markets but devastated Indian value stocks.
India rewards this approach when its own economic cycle is favorable. When India is in a domestic slowdown or credit crisis, the strategy amplifies losses. The Sharpe of 0.131 reflects exactly that trade-off: high return, high risk, rough path.
This isn't a replacement for a core equity position. It's a high-octane satellite allocation for investors with genuine conviction in India's long-run growth story and the stomach for 35%+ annual volatility.
Part of a Series: Global | US | UK | Germany
Run It Yourself
Explore the data behind this analysis on Ceta Research. Query our financial data warehouse with SQL, build custom screens, and run your own backtests across 70,000+ stocks on 20 exchanges.
Data: Ceta Research (FMP financial data warehouse). Returns in INR (local currency). Past performance doesn't guarantee future results. See full methodology at github.com/ceta-research/backtests.


