
Piotroski F-Score Across 9 Markets: Where It Works, Where It Doesn't

We ran the same Piotroski F-Score backtest on nine exchanges using next-day close (MOC) execution and local benchmarks. The spread between Score 8-9 and Score 0-2 value stocks is positive on four of nine markets. On the other five, the signal inverts: low-scoring stocks beat high-scoring stocks.
Contents
- Method
- Global Results
- Three Patterns in the Data
- 1. The F-Score works best where value traps are most dangerous
- 2. Growth-driven markets invert the signal
- 3. Developed markets have modest or negative spreads with decent Sharpe ratios
- Avoidance vs Selection: A Global Pattern
- Why the Signal Varies
- Portfolio Construction Implications
- Limitations
- Individual Exchange Write-Ups
- Reproduce the Backtests
But that's the H-vs-L spread. When measured against local benchmarks, the picture shifts. Score 8-9 beats the local market in six of nine exchanges. The F-Score is not a universal quality signal, but it delivers more alpha than the raw spread suggests.
Method
Same design applied to each exchange independently:
- Signal: Piotroski F-Score (9 binary tests on profitability, leverage, efficiency)
- Universe: Exchange-specific value stocks (bottom quintile by P/B, exchange-appropriate market cap filters)
- Period: 21-37 years depending on exchange data availability
- Rebalancing: Annual (April)
- Portfolios: Equal weight, all qualifying stocks at Score 8-9 (long) and Score 0-2 (weak)
- Execution: Next-day close (MOC)
- Benchmark: Local index for each exchange (Nikkei 225, FTSE 100, Hang Seng, ASX 200, S&P 500, KOSPI, TAIEX, SSE Composite, Sensex)
Full methodology and individual exchange write-ups linked at the end.
Global Results
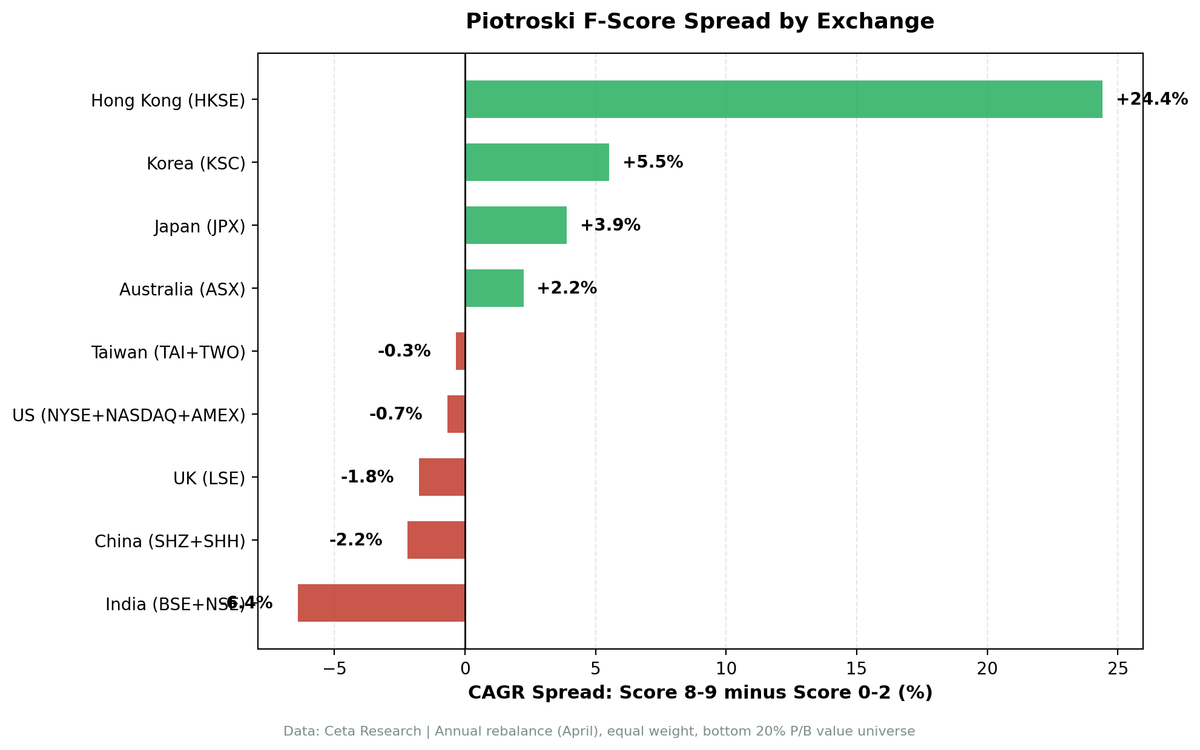
All nine exchanges, sorted by spread:
| Exchange | Score 8-9 CAGR | Score 0-2 CAGR | Spread | Sharpe (8-9) | Benchmark | Excess vs Local |
|---|---|---|---|---|---|---|
| HKSE | 18.8% | -5.7% | +24.5% | 0.190 | Hang Seng | +14.7% |
| KSC | 11.2% | 5.1% | +6.0% | 0.226 | KOSPI | +6.7% |
| ASX | 1.5% | -0.7% | +2.2% | -0.079 | ASX 200 | -3.5% |
| JPX | 5.1% | 3.5% | +1.6% | 0.195 | Nikkei 225 | +4.4% |
| US | 10.6% | 10.9% | -0.3% | 0.297 | S&P 500 | +0.4% |
| Taiwan | 6.8% | 7.2% | -0.4% | 0.226 | TAIEX | -2.0% |
| LSE | 6.7% | 7.8% | -1.1% | 0.113 | FTSE 100 | +2.7% |
| China | 8.7% | 11.5% | -2.8% | 0.162 | SSE Comp. | +5.1% |
| India | 1.9% | 8.6% | -6.7% | -0.107 | Sensex | -9.5% |

Four markets show a positive spread (HKSE, KSC, ASX, JPX). Five show a negative spread (US, Taiwan, LSE, China, India). The range is enormous: from +24.5% (HKSE) to -6.7% (India).
But the spread only tells part of the story. When measured against local benchmarks instead of comparing high vs low scores, Score 8-9 beats the local market in six of nine exchanges (HKSE, KSC, JPX, LSE, China, US). Only India, ASX, and Taiwan show negative excess returns vs their local index.
Three Patterns in the Data
1. The F-Score works best where value traps are most dangerous
The clearest positive spreads come from markets where low-scoring value stocks are genuine capital destroyers. HKSE Score 0-2 returned -5.7% annually. ASX Score 0-2 returned -0.7%. In these markets, the F-Score's avoidance signal does the heavy lifting.
Korea (KSC) and Japan (JPX) show more balanced profiles. Korea's +6.0% spread comes from Score 8-9 outperforming the broad universe while Score 0-2 underperforms. Japan's +1.6% spread is almost entirely avoidance-driven (+4.2% avoidance alpha vs -2.6% selection alpha).
2. Growth-driven markets invert the signal
India (-6.7%) and China (-2.8%) show negative spreads. In both markets, Score 0-2 value stocks beat Score 8-9 value stocks. The likely mechanism: these markets reward turnaround stories. Companies with terrible current fundamentals (low F-Score) that happen to be in sectors or cycles that reverse sharply can generate outsized returns. The F-Score, being backward-looking, tells you to avoid exactly the stocks that produce the biggest recoveries.
India is the most extreme case. Score 8-9 returned just 1.9% CAGR with a negative Sharpe ratio (-0.107) and trails the Sensex by -9.5%. The F-Score actively steers you toward the worst-performing segment of Indian value stocks.
3. Developed markets have modest or negative spreads with decent Sharpe ratios
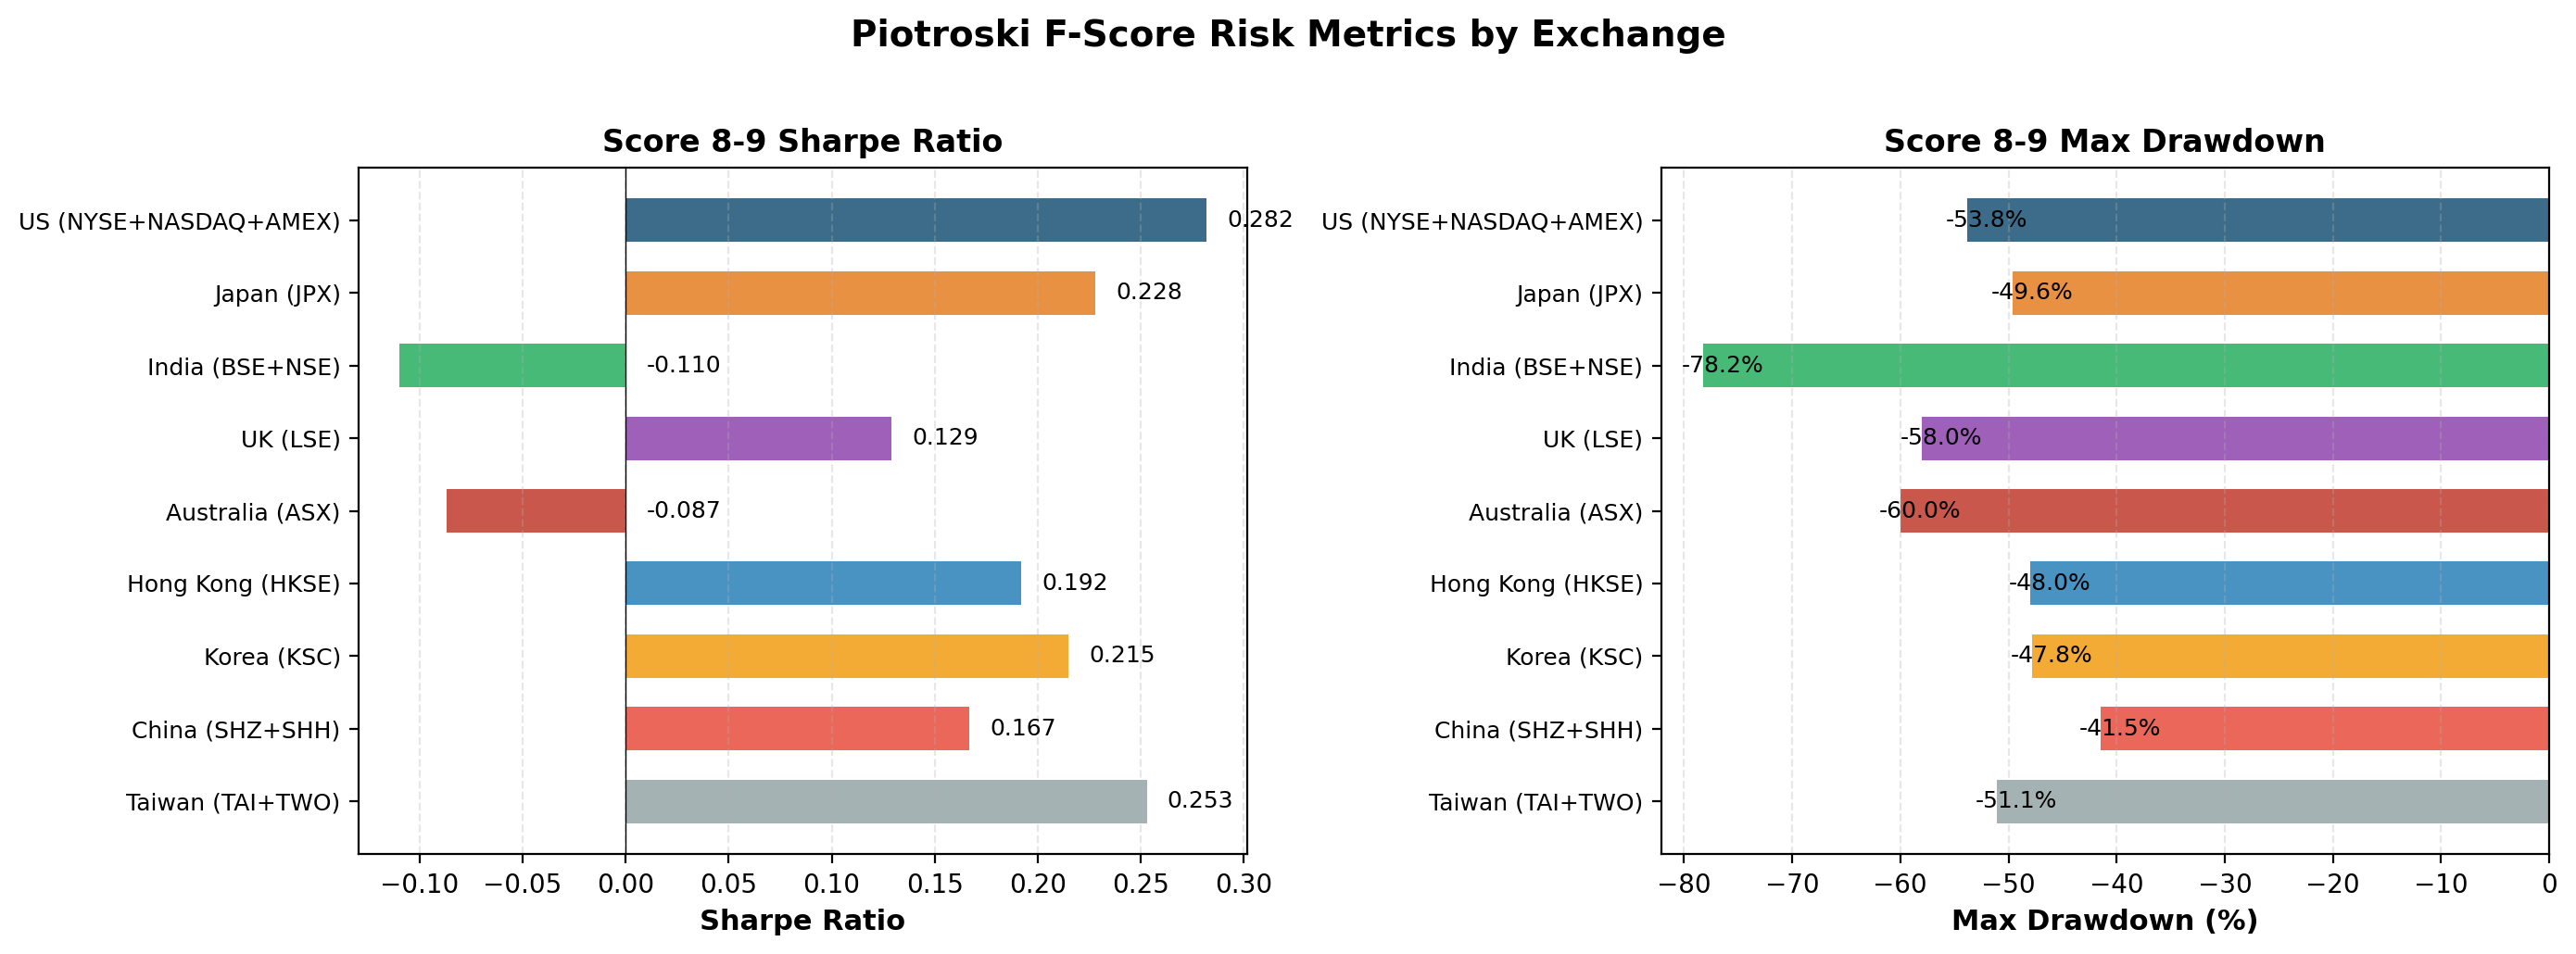
The US (-0.3%), Taiwan (-0.4%), and LSE (-1.1%) all show small negative spreads but relatively decent Sharpe ratios for the Score 8-9 portfolio. The US Score 8-9 Sharpe of 0.297 is the highest in the study. Taiwan's 0.226 is second (tied with KSC).
This suggests that in efficient, well-covered markets, the F-Score's selection signal doesn't add much, but it doesn't hurt badly either. The risk-adjusted profile of Score 8-9 stocks in these markets is acceptable. The issue is that Score 0-2 stocks also perform reasonably well, narrowing or inverting the spread.
Avoidance vs Selection: A Global Pattern
Across all nine markets, we decomposed the F-Score alpha into selection (Score 8-9 vs All Value) and avoidance (All Value vs Score 0-2).
| Exchange | Selection Alpha | Avoidance Alpha |
|---|---|---|
| HKSE | +9.2% | +15.3% |
| KSC | -5.8% | +11.8% |
| JPX | -2.6% | +4.2% |
| ASX | -11.5% | +13.7% |
| US | -2.1% | +1.8% |
| Taiwan | -11.3% | +11.0% |
| LSE | -9.4% | +8.3% |
| China | +2.9% | -5.7% |
| India | -9.0% | +2.2% |
The avoidance signal is positive on eight of nine exchanges. Even in India, where the overall spread is -6.7%, filtering out Score 0-2 stocks saves 2.2% per year relative to the unfiltered value universe. The one exception is China, where avoidance alpha is -5.7%. Low-scoring Chinese value stocks actually outperformed the broad value universe, an unusual pattern that may reflect the turnaround dynamics of state-influenced companies.
The selection signal is negative on seven of nine markets. Buying Score 8-9 stocks underperformed the broad value universe more often than it outperformed.
This is the most important cross-market finding: the F-Score's value is overwhelmingly in telling you what NOT to buy. Using it as a stock picker works only in Hong Kong (with massive caveats on volatility) and China (where the selection signal is modestly positive at +2.9%).
Why the Signal Varies
Three structural factors explain most of the cross-market variation.
Market structure and cyclicality. Australia (-11.5% selection alpha) and the UK (-9.4%) have value universes dominated by mining, energy, and financials. These cyclical sectors produce financial statements that lag the business cycle. The F-Score's backward-looking criteria systematically buy at the top and avoid at the bottom of commodity cycles.
Information efficiency. The US has the highest Score 8-9 Sharpe ratio (0.297) despite a slightly negative spread. High analyst coverage and efficient pricing mean the F-Score's information is already priced in. There's less alpha to capture but also less risk. Markets with thin coverage (HKSE, KSC) show wider spreads but with more noise.
Growth vs value market character. India's market rewards growth and momentum. Companies with deteriorating fundamentals that catch a growth catalyst can produce multi-bagger returns. The F-Score explicitly avoids these stocks. In contrast, Korea and Japan have more value-oriented market structures where fundamental improvement is rewarded incrementally.
Portfolio Construction Implications
Based on nine markets and 21-37 years of data:
Use the F-Score as a floor, not a ceiling. Set a minimum threshold of 3-5 on any value screen. This captures the avoidance alpha (positive on eight of nine exchanges) without concentrating into Score 8-9 (where selection alpha is usually negative).
Don't apply it uniformly across geographies. A Score 8 in Japan means something different than a Score 8 in India. The same nine binary tests interact with different market structures, sector compositions, and information environments.
Weight the Sharpe ratio, not the spread. Hong Kong's +24.5% spread looks incredible until you see the 83.1% volatility. The US's -0.3% spread looks disappointing until you see the 0.297 Sharpe. Risk-adjusted metrics tell the real story.
The avoidance signal scales better than the selection signal. Removing Score 0-2 stocks works on eight of nine exchanges (China being the exception). Restricting to Score 8-9 works on two. A simple "avoid the bottom" rule has near-universal application. A "buy the top" rule does not.
Limitations
Different time periods. Backtests range from 29 years (India) to 40 years (US). Different start dates mean different market cycles covered.
Local currency returns. All returns are in exchange-local currency. Cross-market comparisons don't account for currency movements, which can be substantial over 30+ years.
Varying portfolio depth. Average holdings post-2010 range from 12.8 (HKSE) to 74 (ASX). Thin portfolios produce more volatile results that are harder to interpret.
No transaction costs for some markets. The US backtest includes 0.3-0.5% transaction costs. Regional backtests may not fully account for the higher trading costs in markets like India, Hong Kong, and Korea.
Value universe definition. Bottom P/B quintile means different things in different markets. Japan's P/B distribution has a structural downward bias. India's includes many growth companies that happen to have negative book equity.
Individual Exchange Write-Ups
- US: 32 Years of US Data on a 9-Point Quality Checklist
- Japan: The Avoidance Signal Carries the Weight
- India: The Score That Doesn't Work
- UK: Decent Returns, Wrong Bucket
- Australia: Weak Signal, Strong Avoidance
- Hong Kong: Massive Spread, Massive Caveats
Reproduce the Backtests
Full backtest code is on GitHub: ceta-research/backtests
git clone https://github.com/ceta-research/backtests.git
cd backtests
pip install -r requirements.txt
export CR_API_KEY="your_key_here"

# Run on any supported exchange
python3 piotroski/backtest.py --exchange JPX --verbose
python3 piotroski/backtest.py --exchange BSE,NSE --verbose
python3 piotroski/backtest.py --exchange LSE --verbose
Data: Ceta Research, FMP financial data. 9 exchanges (US, JPX, BSE+NSE, LSE, ASX, HKSE, KSC, SHH+SHZ, TAI+TWO), 21-37 years, annual rebalance, equal weight, value universe (bottom P/B quintile, exchange-specific market cap filters). Past performance does not guarantee future results. Educational content only, not investment advice.


