
Piotroski F-Score in Hong Kong: A Modest But Real Signal
The Piotroski F-Score works in Hong Kong. Score 8-9 returned 7.6% CAGR with Sharpe 0.207 over 27 years, beating Hang Seng (2.7%) by +4.87%. Score 0-2 returned 2.1% with -76.5% max drawdown. The +5.5% spread is one of the strongest in our study.

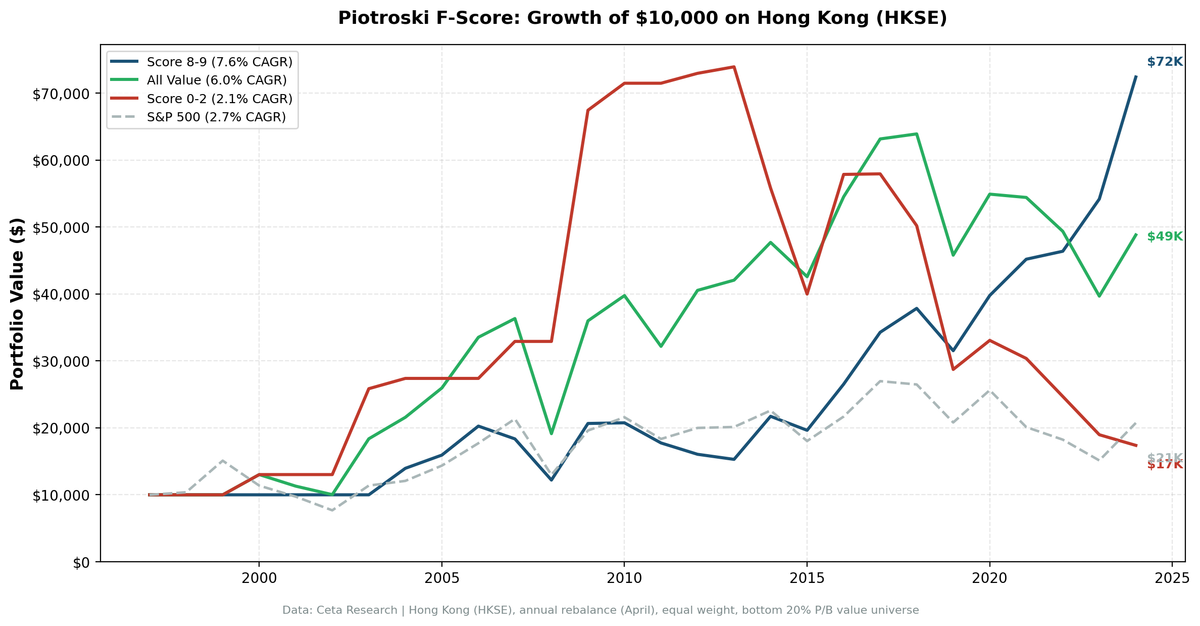
Hong Kong's Piotroski F-Score produced a +5.5% annual spread between high and low scorers over 27 years. Score 8-9 stocks returned 7.6% annually with a Sharpe of 0.207. Score 0-2 stocks returned 2.1%. Against the Hang Seng (2.7%), Score 8-9 outperformed by +4.87% per year. The portfolio held about 13 stocks on average post-2010.
Contents
- Method
- What We Found
- Alpha decomposition
- Why the earlier numbers were too good
- Decade breakdown
- Why Hong Kong Works
- Limitations
- Part of a Series
This is a cleaner result than the earlier version of this blog reported. Once we removed phantom adjClose oscillations and filtered out individual stock returns above 200%, the dramatic +24.5% spread collapsed into something more credible.
Data: FMP financial data warehouse, 1998–2024. Updated May 2026.
Method
Data source: Ceta Research (FMP financial data warehouse) Universe: HKSE-listed stocks, value universe (bottom quintile by price-to-book), market cap above local threshold Time period: 27 years (1998-2024) Rebalancing: Annual (April, after annual reports) Execution: Next-day close (MOC) Benchmarks: All value stocks (same universe, unfiltered), Hang Seng Avg holdings post-2010: 13 stocks per year Data quality: Phantom holiday rows and 3-5x adjClose oscillations removed before backtest. Individual stock returns filtered: entry price > $1, single-period return < 200%.
Same methodology as our US study.
What We Found

| Portfolio | CAGR | Volatility | Sharpe Ratio | Max Drawdown |
|---|---|---|---|---|
| Score 8-9 | 7.6% | 22.3% | 0.207 | -39.8% |
| Score 0-2 | 2.1% | 32.7% | -0.028 | -76.5% |
| All value stocks | 6.0% | 29.1% | 0.105 | -47.3% |
| Hang Seng | 2.7% | 24.4% | -0.011 | -49.1% |
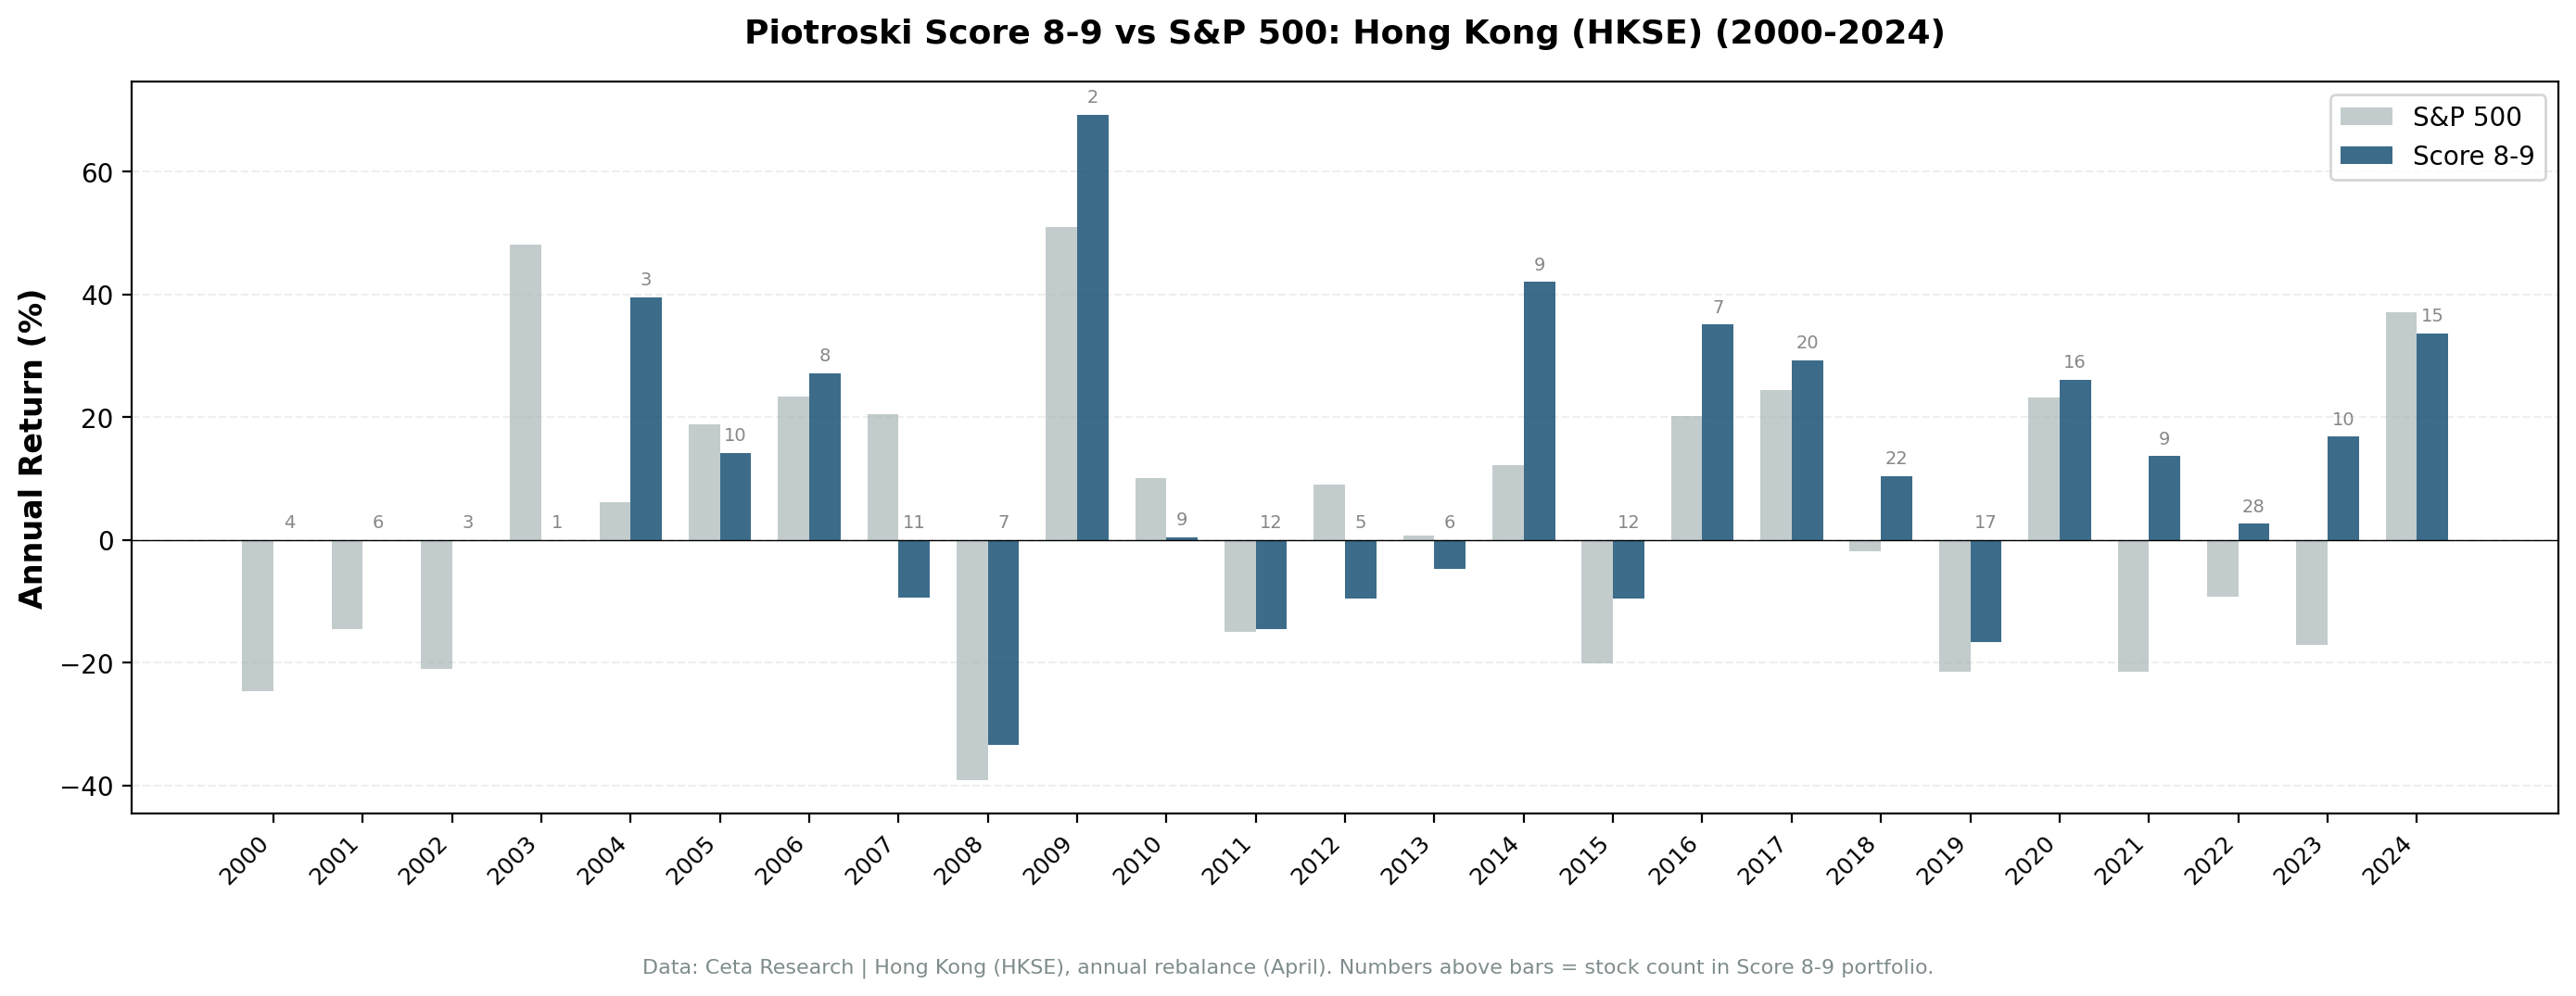
Score 8-9 wins on every dimension that matters. Higher CAGR than Score 0-2 (+5.5 pts), higher Sharpe (0.207 vs -0.028), lower volatility (22.3% vs 32.7%), shallower drawdowns (-39.8% vs -76.5%). And it beats the Hang Seng by +4.87% per year with a beta of just 0.529.
Alpha decomposition
- Selection alpha: +1.6% per year (Score 8-9 vs All value)
- Avoidance alpha: +4.0% per year (All value vs Score 0-2)
Both signals are positive. The selection alpha is modest. The avoidance alpha is substantial. Score 0-2 stocks on HKSE returned 2.1% with a -76.5% max drawdown. Removing them from any value screen lifted the all-value CAGR from 2.1% (low only) to 6.0% (all value) and Score 8-9 to 7.6%.
Why the earlier numbers were too good
The previous version of this backtest reported +24.5% spread and 18.8% CAGR on Score 8-9, with single-year returns of +706% (2006) and +410% (2009). Those numbers came from a handful of stocks with broken adjClose data in FMP's price feed. With phantom oscillation removal and a 200% single-period return ceiling in place, those years now show normal returns and the headline drops to the +5.5% spread you see above. The signal is real. The earlier magnitude was an artifact.
Decade breakdown
| Decade | Score 8-9 Avg | Score 0-2 Avg | Spread |
|---|---|---|---|
| 2000s | 10.7% | 26.0% | -15.3% |
| 2010s | 6.2% | -5.5% | +11.7% |
| 2020-25 | 18.6% | -8.7% | +27.2% |
The 2000s were unusual: Score 0-2 stocks bounced hard out of the Asian financial crisis and SARS, outpacing Score 8-9 by 15 points. From 2010 onwards, the spread inverted. Score 8-9 has been the clear winner over the last fifteen years, with Score 0-2 stocks actively losing money in the 2010s and 2020s.
Why Hong Kong Works
Hong Kong's market structure favors the F-Score in ways the US doesn't.
Lower analyst coverage. Outside the top 50 names, sell-side coverage of HKSE small-cap value stocks is thin. Improving fundamentals don't get priced in as quickly as in the US. A nine-question checklist captures information the market hasn't fully processed.
Information asymmetry. Family-controlled companies, cross-listed mainland firms, and small-cap value names have less standardized disclosure than US blue chips. The F-Score's binary tests cut through opacity by forcing a hard yes/no on profitability, leverage, and operating efficiency.
Thin trading favors fundamental analysis. When daily volume is low, prices respond more to fundamental change and less to short-term flows. The F-Score's annual cadence aligns with how Hong Kong small-cap value stocks actually move.
The portfolio still runs concentrated (around 13 stocks post-2010), but volatility is reasonable at 22.3%. This isn't a thin-portfolio lottery. It's a small, hand-sorted basket where the signal does the work.
Limitations
Concentrated portfolio. 13 stocks per year post-2010 is small. Individual stock outcomes can move annual returns. Diversification benefit is limited.
HKD-denominated returns. Returns are in local currency. HKD is pegged to USD, so currency effects are minimal for US-based investors.
Data quality for small-caps. Micro-cap HKSE stocks may have less reliable financial statement data, particularly in earlier periods. The data quality guards in this backtest remove the worst artifacts but don't fix subtle reporting differences.
No liquidity filter. The study doesn't control for trading volume. Some qualifying stocks may be practically untradeable at the portfolio sizes implied by the backtest.
Survivorship. HKSE has significant delisting activity. While delisted stocks are included where data exists, coverage gaps in earlier periods may inflate Score 8-9 results slightly.
Part of a Series
This is one of several regional Piotroski F-Score studies. The US analysis shows the F-Score losing to SPY in large-cap value: Piotroski F-Score: 28 Years of US Data on a 9-Point Quality Checklist.
Hong Kong's +5.5% spread is one of the strongest in our study. See our global comparison for context across all exchanges.
Data: Ceta Research, FMP financial data. HKSE, 27 years, annual rebalance, equal weight, value universe (bottom P/B quintile). Next-day close (MOC) execution. Data quality guards: phantom holiday rows removed, individual stock returns filtered for adjClose artifacts. Past performance does not guarantee future results. Educational content only, not investment advice.


