
Piotroski F-Score in the UK: Beats the FTSE, Loses to Score 0-2
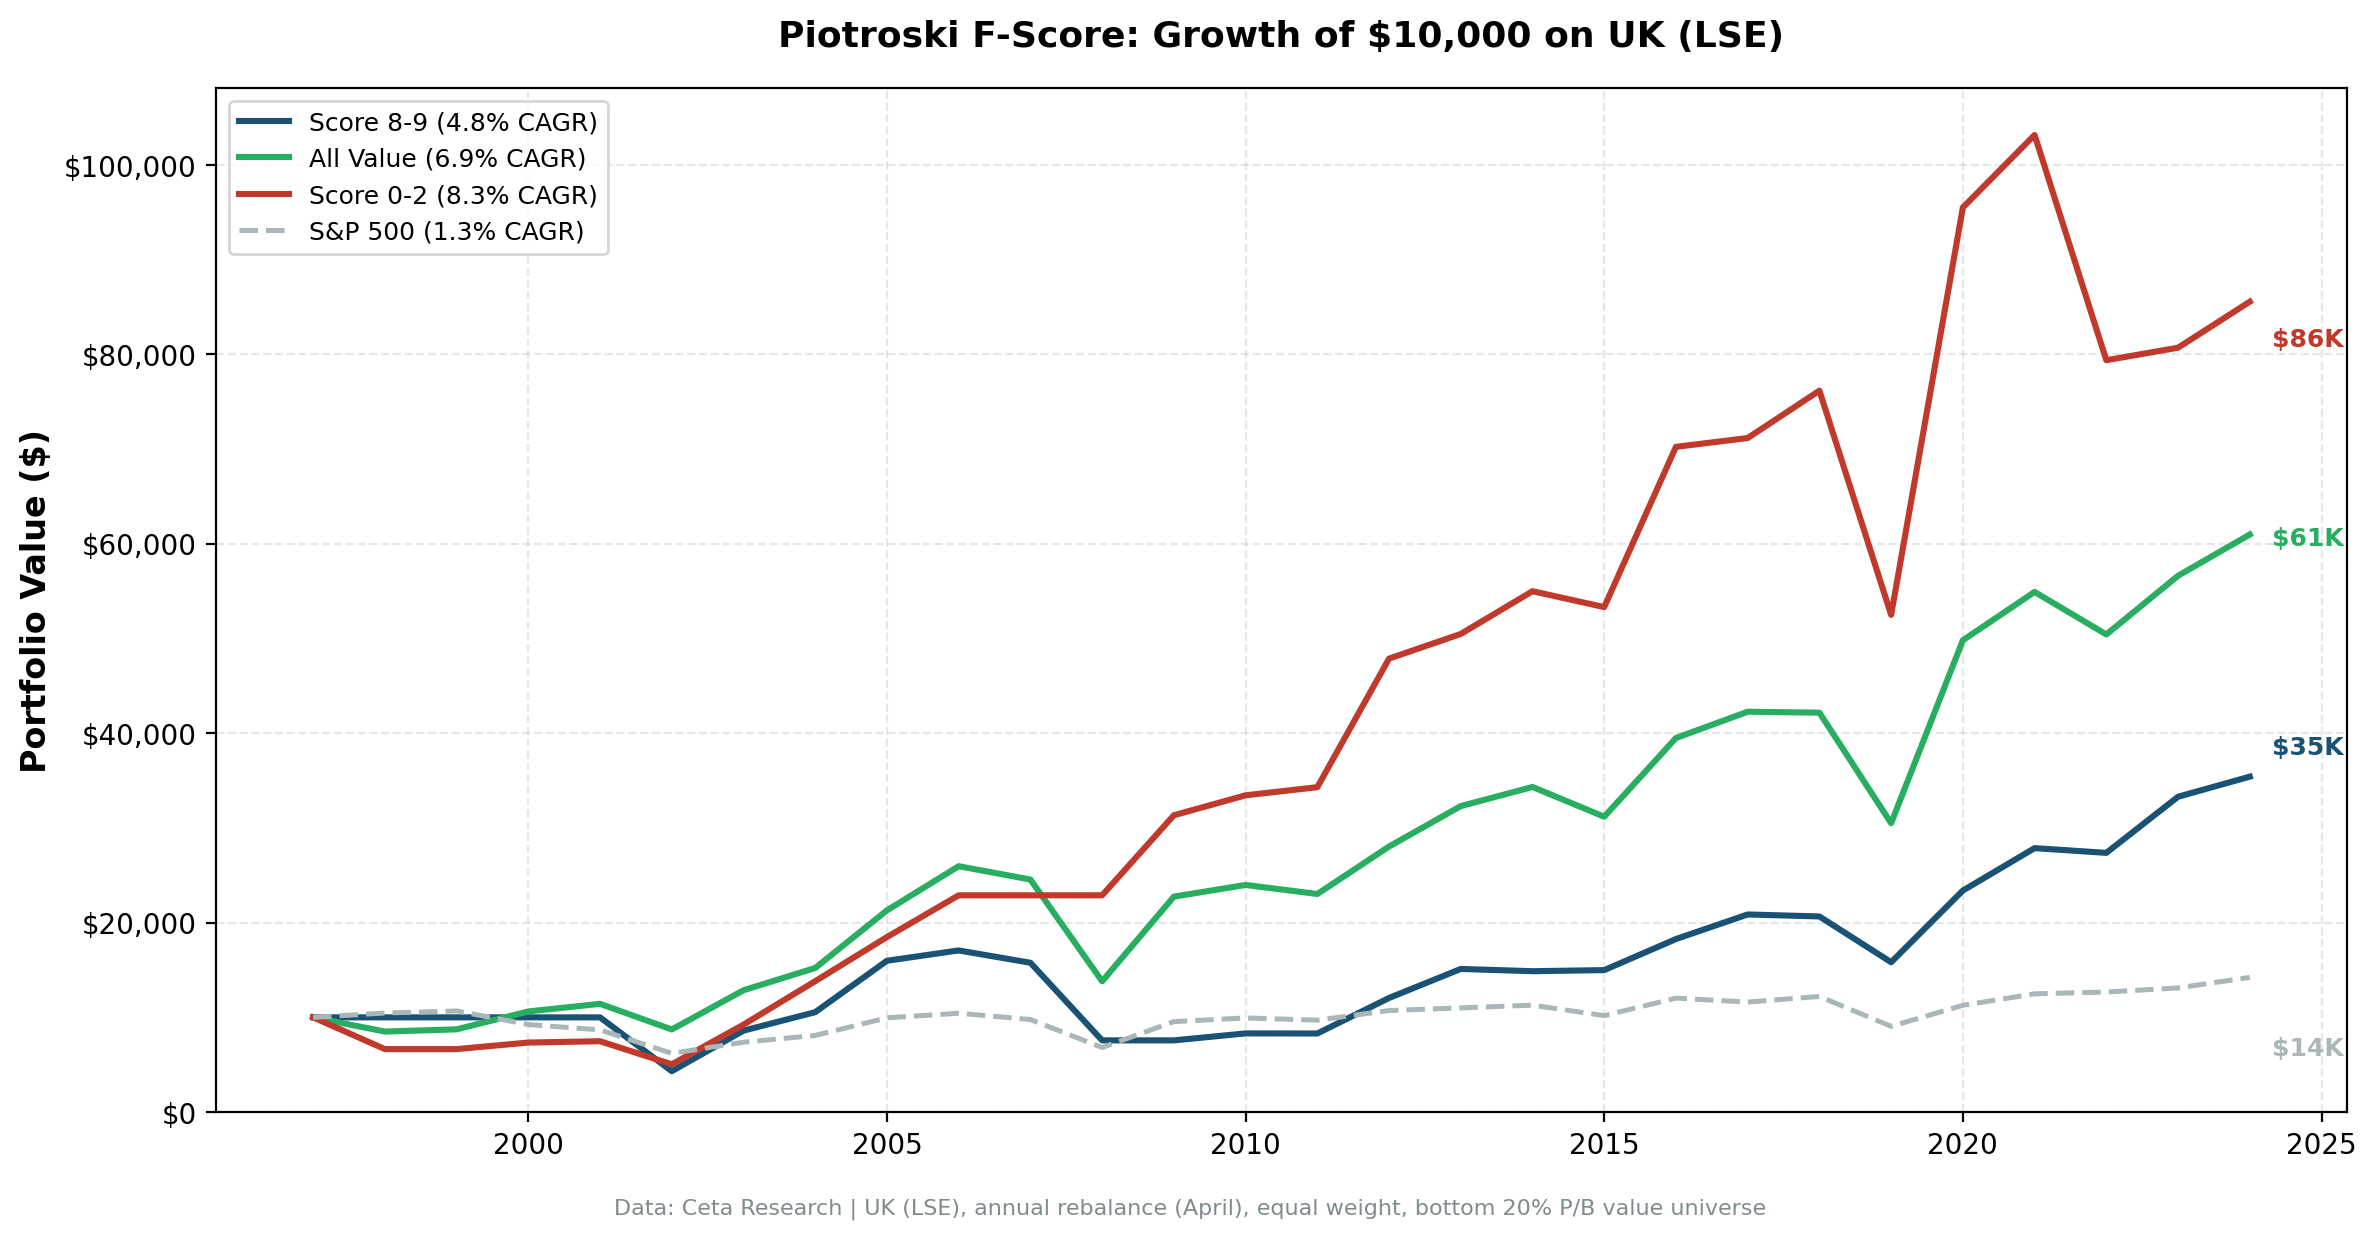
UK Score 8-9 returned 4.8% CAGR over 27 years, beating the FTSE 100 (1.3%) by +3.48%. But the unfiltered value universe returned 6.9% and Score 0-2 returned 8.3%. Spread: -3.5%. Selection alpha -2.1%, avoidance alpha -1.3%.

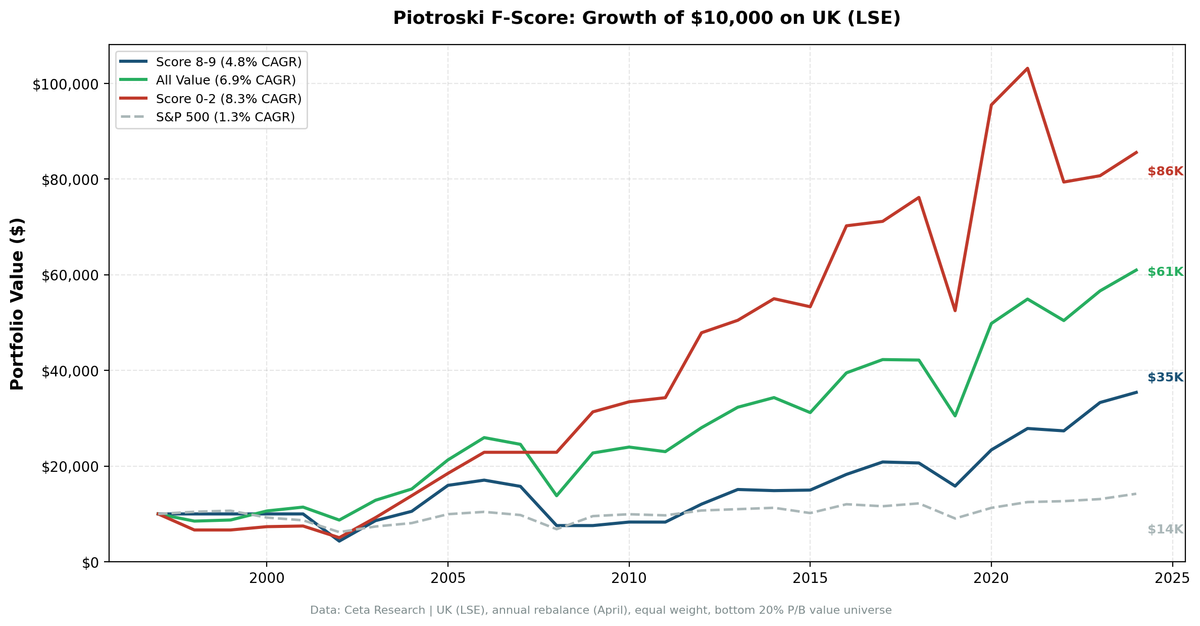
UK value stocks scoring 8-9 on the Piotroski F-Score returned 4.8% annually over 27 years. That's a modest absolute return, but it beats the FTSE 100 (1.3%) by +3.48%. The unfiltered value universe returned 6.9%. Score 0-2 stocks returned 8.3%. The F-Score's selection signal cost you 2.1% per year on the London Stock Exchange.
Contents
- Method
- What We Found
- Alpha decomposition
- Why selection fails on the LSE
- Why both still beat the FTSE 100
- The Practical Implication
- Part of a Series
- Limitations
The spread between high and low scores is -3.5%. Score 0-2 stocks beat Score 8-9. The F-Score doesn't sort UK value stocks in the right direction at the tails. But against the FTSE 100, every cell of the value universe outperforms the benchmark.
Data: FMP financial data warehouse, 1998–2024. Updated May 2026.
Method
Data source: Ceta Research (FMP financial data warehouse) Universe: LSE-listed stocks, value universe (bottom quintile by price-to-book), market cap above local threshold Time period: 27 years (1998-2024) Rebalancing: Annual (April, after annual reports) Execution: Next-day close (MOC) Benchmarks: All value stocks (same universe, unfiltered), FTSE 100 Avg holdings post-2010: 23 stocks per year Data quality: Phantom adjClose oscillations removed, returns filtered for price artifacts
Same methodology as our US study.
What We Found
| Portfolio | CAGR | Volatility | Sharpe Ratio | Max Drawdown |
|---|---|---|---|---|
| Score 8-9 | 4.8% | 28.7% | 0.043 | -56.8% |
| Score 0-2 | 8.3% | 35.1% | 0.121 | -68.1% |
| All value stocks | 6.9% | 28.8% | 0.105 | -53.1% |
| FTSE 100 | 1.3% | 15.8% | -0.138 | -41.9% |
Two numbers stand out. Score 8-9 beats the FTSE 100 by a wide margin (+3.48% per year). And the All Value universe returns 6.9%, better than Score 8-9 but worse than Score 0-2. The F-Score didn't help you pick the best UK value stocks.
Alpha decomposition
- Selection alpha: -2.1% per year (Score 8-9 vs All value)
- Avoidance alpha: -1.3% per year (All value vs Score 0-2)
Both selection and avoidance alphas are slightly negative. Score 0-2 stocks on the LSE actually outperformed the broad value universe by 1.3% per year. This is unusual: in most markets, avoiding low scorers helps. In the UK, it didn't over this window.
Why selection fails on the LSE
The UK's value universe has a structural feature that works against the F-Score: heavy concentration in financials, energy, and mining. These sectors have cyclical earnings patterns that the F-Score's backward-looking metrics misread.
Consider a mining company. Commodity prices surge. Last year's income statement shows record profits, strong cash flow, improving margins. The F-Score gives it an 8 or 9. But by the time annual financials are published and the portfolio rebalances, the commodity cycle may already be turning. The F-Score is buying at the peak of the earnings cycle.
The reverse also applies. A mining stock with a terrible F-Score (declining profits, rising debt) might be at the bottom of the cycle. One year later, it's recovering. This cyclical pattern inverts the F-Score's signal in sectors that dominate UK value.
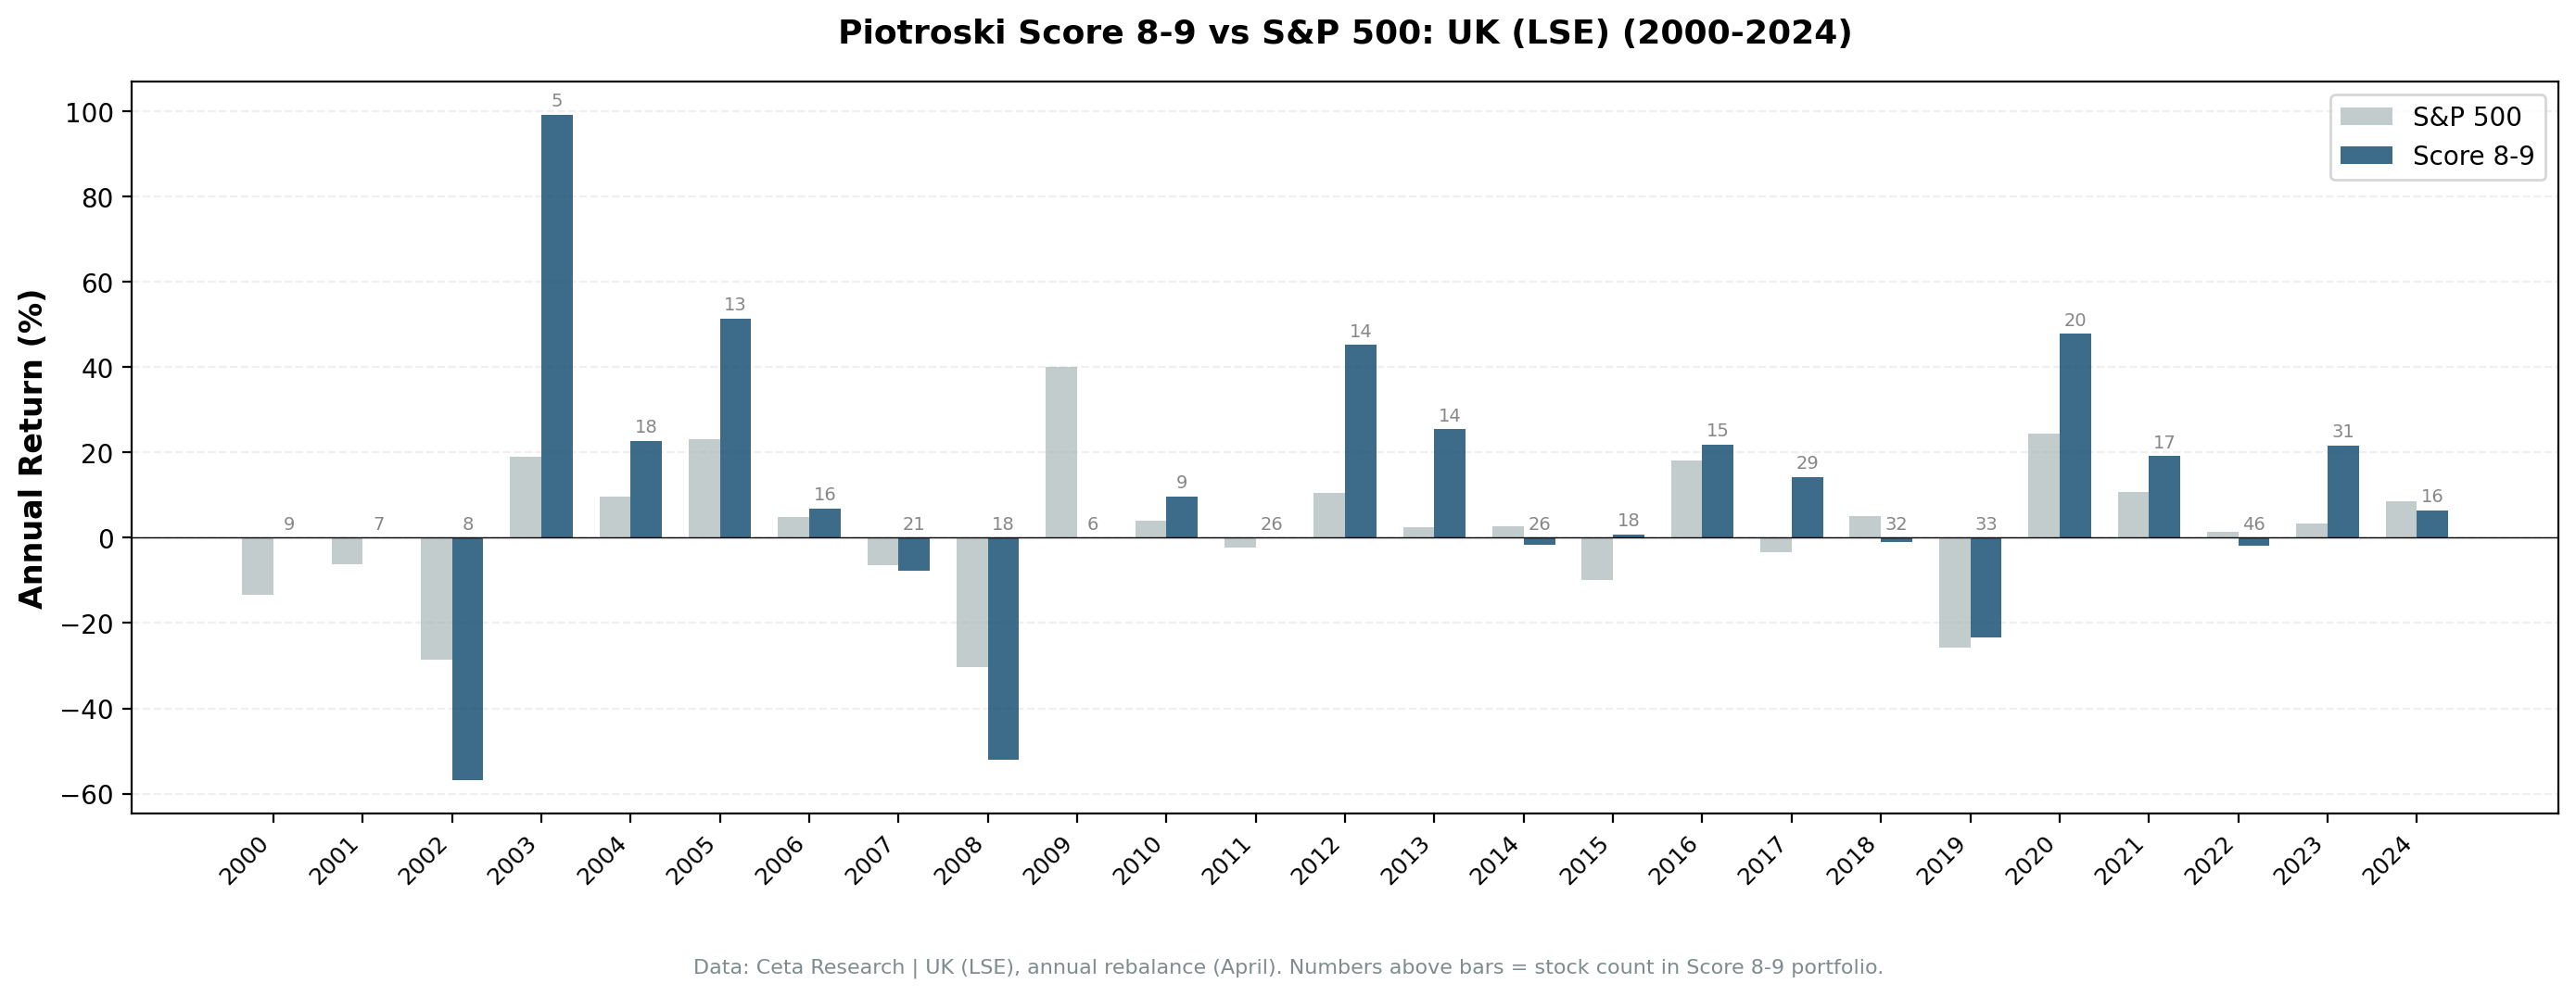
With about 23 stocks per year post-2010, sector concentration risk is meaningful. A few mining or energy names can drive the entire portfolio's relative performance.
Why both still beat the FTSE 100
The FTSE 100 returned just 1.3% CAGR over 1998-2024. That's an unusually low number for a developed-market benchmark. It reflects the FTSE's heavy exposure to slow-growing legacy sectors (oil, banks, telecoms) and the underperformance of UK equities relative to the US during this window. Against a benchmark this weak, all three F-Score cohorts win. Score 8-9 at 4.8% beats it by +3.48%. Score 0-2 at 8.3% beats it by +7.0%. The All Value universe at 6.9% beats it by +5.6%.
The Practical Implication
For UK value investors, the cleanest read of this data is: don't restrict to Score 8-9. The unfiltered value universe outperforms Score 8-9 by 2.1% per year. And the F-Score doesn't reliably remove the worst names either.
If you must use the F-Score on UK stocks, treat it as a sector hedge, not a quality screen. Pair it with a sector cap on mining and energy to dampen the commodity-cycle bias that drives the negative selection alpha.
Part of a Series
This is one of several regional Piotroski F-Score studies. The US analysis shows the F-Score losing to SPY in large-cap value: Piotroski F-Score: 28 Years of US Data on a 9-Point Quality Checklist.
The UK's -3.5% spread puts it in the "doesn't sort correctly" category alongside India (-7.2%) and Canada (-0.2%). See our global comparison for all exchanges.
Limitations
Thin portfolio. 23 stocks per year post-2010 is a moderate sample. Sector concentration in financials and mining amplifies individual stock impact.
GBP-denominated returns. All returns are in local currency. Sterling's decline against USD over portions of the study period affects cross-border comparisons.
Sector composition. The LSE's value universe is dominated by cyclical sectors (financials, energy, materials). The F-Score's backward-looking signals may systematically mistime cyclical stocks.
FTSE 100 benchmark weakness. The FTSE 100 returned just 1.3% CAGR over this window. Beating it is a low bar. The All Value vs Score 8-9 comparison is the more telling result.
Data: Ceta Research, FMP financial data. LSE, 27 years, annual rebalance, equal weight, value universe (bottom P/B quintile). Next-day close (MOC) execution. Data quality guards: phantom holiday rows removed, individual stock returns filtered for adjClose artifacts. Past performance does not guarantee future results. Educational content only, not investment advice.


