
P/TBV Across 15 Markets: Where Hard Assets Pay Off

Fourteen of 15 exchanges beat their local benchmark over 25 years using a Price-to-Tangible-Book strategy. Only Korea underperformed. The strategy works where physical and financial assets are the primary value driver: manufacturing, banking, energy, materials. The one failure, Korea, reveals structural limits worth understanding. But the broad picture is clear: buying cheap, quality hard-asset companies generates alpha against the local index in nearly every market we tested.
Contents
- The Strategy
- Full Results: 15 Exchanges
- The Pattern
- Alpha vs Local Benchmarks: The Down Capture Picture
- Why Korea Is the Only Failure: -1.30% vs KOSPI
- Japan: Modest Alpha Despite the Value Trap
- Singapore: Thin Universe, Thin Edge
- Switzerland: Alpha from the Industrial Slice
- Sharpe Ranking: Risk-Adjusted Picture
- What This Means for a Global Portfolio
- Current Global Screen
- Limitations
- Dedicated Regional Blogs
Data: FMP financial data warehouse, 2000–2025. Updated June 2026.
The Strategy
We screened each exchange for companies with low P/TBV (market cap divided by tangible book value, with goodwill and intangibles removed), applied quality filters of ROE > 8%, ROA > 3%, and operating margin > 10%, then held the 30 cheapest qualifying stocks annually, rebalancing each July with a 45-day filing lag. Market cap thresholds were set per exchange. The minimum portfolio size was 10 stocks; periods below the threshold resulted in a cash position.
The academic grounding comes from Fama and French (1992), who identified book-to-market as one of the most persistent predictors of long-run equity returns. Tangible book goes further: it removes goodwill and acquired intangibles that inflate standard P/B ratios, leaving only hard assets and financial claims.
Full Results: 15 Exchanges
| Exchange | Market | CAGR | vs Local | Sharpe | MaxDD | Cash | Avg Stocks |
|---|---|---|---|---|---|---|---|
| LSE | UK | 10.46% | +9.24% | 0.360 | -38.54% | 0% | 12.6 |
| SHZ_SHH | China | 9.84% | +7.41% | 0.195 | -37.33% | 0% | 25.0 |
| STO | Sweden | 9.25% | +6.70% | 0.370 | -40.46% | 16% | 22.6 |
| TSX | Canada | 9.32% | +5.37% | 0.334 | -36.52% | 0% | 22.7 |
| HKSE | Hong Kong | 6.48% | +4.84% | 0.183 | -24.85% | 0% | 22.4 |
| SIX | Switzerland | 5.83% | +4.09% | 0.281 | -39.77% | 0% | 15.3 |
| NYSE_NASDAQ_AMEX | US | 11.31% | +3.45% | 0.480 | -38.42% | 0% | 21.9 |
| JNB | S. Africa | 10.66% | +2.81%** | 0.076* | -25.74% | 12% | 13.6 |
| NSE | India | 14.64% | +2.58% | 0.297 | -31.67% | 16% | 26.9 |
| JPX | Japan | 5.81% | +2.50% | 0.254 | -47.63% | 8% | 27.2 |
| TAI_TWO | Taiwan | 6.24% | +2.15% | 0.340 | -16.55% | 20% | 27.4 |
| XETRA | Germany | 6.90% | +1.86% | 0.304 | -32.00% | 0% | 16.9 |
| SES | Singapore | 4.49% | +1.82% | 0.099 | -45.80% | 20% | 12.5 |
| SET | Thailand | 5.78% | +0.64% | 0.236 | -24.58% | 12% | 23.3 |
| KSC | Korea | 4.06% | -1.30% | 0.060 | -21.74% | 28% | 27.3 |
*South Africa's Sharpe is low because the risk-free rate is 9% (government bonds). The raw CAGR of 10.66% is real outperformance.
**South Africa has no local index with usable price history in our data, so its excess is measured against SPY rather than a local benchmark.
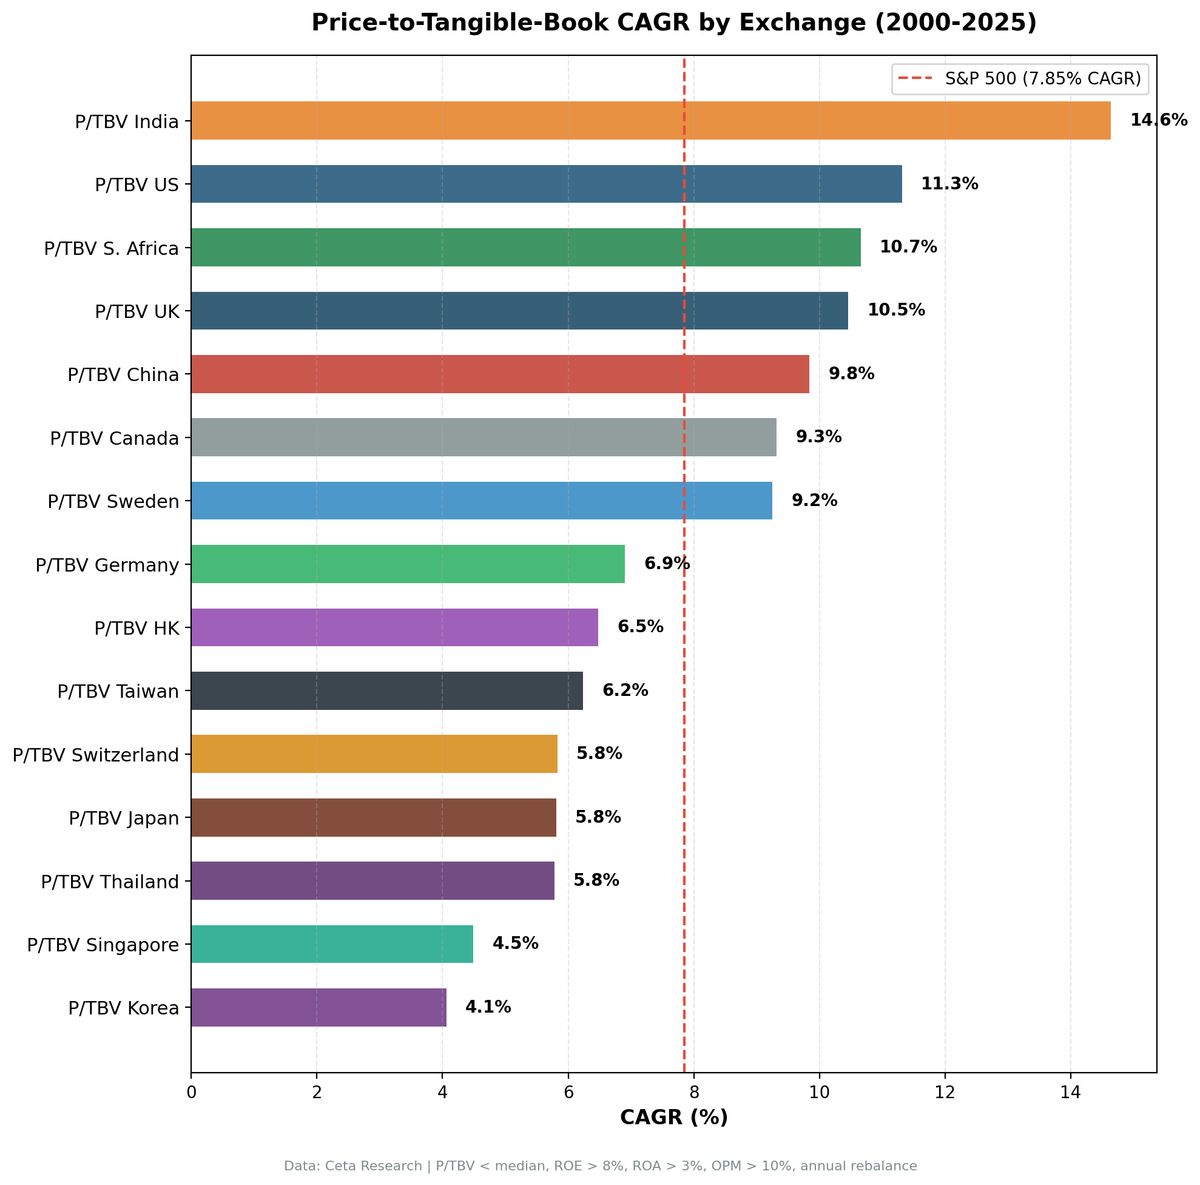
The Pattern
Fourteen exchanges beat their local benchmark. Only Korea underperforms. The strategy generates alpha in markets with very different structures, from the UK's financials-heavy FTSE to China's state-owned industrials to India's manufacturing sector.
The magnitude of alpha varies. The UK leads at +9.24% excess vs the FTSE 100, followed by China at +7.41% vs the SSE Composite. At the other end, Thailand edges out its local index by +0.64%, and Korea is the sole negative at -1.30% vs KOSPI.
The quality filters (ROE, ROA, OPM) prevent the screen from buying distressed asset dumps. They work in most markets. Korea is the exception where structural issues overwhelm the signal.
Alpha vs Local Benchmarks: The Down Capture Picture
The excess return column tells you how much the strategy beats the local index over 25 years. Down capture tells you how it behaves in the bad years.
| Exchange | Down Capture vs Local |
|---|---|
| US | +3.89% |
| China | +31.92% |
| Germany | +34.38% |
| India | +37.20% |
| Sweden | +38.00% |
| Hong Kong | +41.64% |
The US at 3.89% is the defensive standout: the portfolio absorbs about four cents of every dollar of SPY's annual downside. Germany's 34.4% down capture pairs with a 0.608 beta, so the German portfolio takes about a third of the DAX's damage in bad years, which matters because its return edge (+1.86%) is the thinnest in the series.
India's 37.2% down capture means the strategy takes about a third of the Sensex's losses during bad years. That's acceptable given the +2.58% annual excess and the highest absolute CAGR (14.64%) of any exchange.
The UK's +9.24% excess vs the FTSE is the standout. The FTSE 100 is itself a value-heavy, dividend-oriented index. That the P/TBV screen still adds 9 percentage points of annual alpha on top of the FTSE suggests a strong factor premium in UK industrials and financials that the index doesn't fully capture. One caveat: the UK portfolio averages just 12.6 stocks per period after data-quality filtering, the thinnest of any major market here, so treat the magnitude with more caution than the direction.
Why Korea Is the Only Failure: -1.30% vs KOSPI
Korea is the only exchange where the strategy underperformed its local benchmark. The strategy returned 4.06% CAGR against KOSPI's 5.35%, underperforming by 1.30 percentage points annually. With 28% cash (the highest of any exchange), there were too few qualifying periods to build a reliable record.
Three structural issues combine in Korea.
First, chaebol cross-holdings. Korean conglomerates like Samsung, SK, Hyundai, and LG hold stakes in each other through complex ownership chains. Goodwill and intangibles are stripped from tangible book in our calculation, but the remaining "tangible" book often includes non-core financial assets, subsidiaries at book value, and receivables from related parties. The signal is noisy because the balance sheets don't reflect clean economic ownership of productive assets.
Second, the real value in Korea's leading companies is intangible. Samsung's semiconductor IP, SK Hynix's process technology, LG Chem's battery chemistry: these are the actual value drivers. Tangible book strips them out and points the screen toward the wrong companies, those with lots of physical assets but weaker competitive positions.
Third, Korean P/TBV stocks trade at persistent discounts partly because of governance concerns. Foreign investors price in a Korea discount for minority shareholders. A stock trading cheaply relative to tangible book in Korea might stay cheap indefinitely, which is exactly what happened across most of our 25-year window.
Japan: Modest Alpha Despite the Value Trap
Japan puzzles people. Toyota, Panasonic, Hitachi, Mitsubishi Electric: exactly the kind of heavy manufacturing businesses where P/TBV should identify cheap, high-quality companies. The strategy returned 5.81% CAGR, beating the Nikkei's 3.31% by +2.50% annually. That's a real edge, but it comes with the worst max drawdown of any exchange at -47.63%.
Japanese companies maintain low P/TBV intentionally, through conservative accounting, high cash hoarding, cross-shareholdings, and limited payout policies. Warren Buffett famously bought stakes in Japanese trading houses (Itochu, Marubeni, Mitsubishi, Mitsui, Sumitomo) in 2020 at prices around or below book value, with several below 0.8x. The discount reflects governance and capital allocation culture, not just mispricing.
The +2.50% annual edge shows the factor does work in Japan, just slowly. The quality filters help by screening out the worst capital allocators. But the deep drawdowns (-47.63%) and the 8% cash periods make this a bumpy ride for a modest premium.
Singapore: Thin Universe, Thin Edge
Singapore's +1.82% excess vs its local index is real but fragile. The average holding was 12.5 stocks per period, well below the 20+ we consider meaningful for portfolio diversification. Singapore's exchange is large by market cap, but the universe of companies that simultaneously pass the quality filters and the mktcap threshold is thin.
With 12.5 average holdings and 20% cash periods, the results are dominated by individual company outcomes rather than a systematic factor. The strategy returned 4.49% CAGR (vs 2.68% for the local benchmark), but that number reflects concentrated positions more than a repeatable screening approach.
Switzerland: Alpha from the Industrial Slice
Switzerland returned 5.83% CAGR, +4.09% vs the SMI. The Swiss market is dominated by Nestle, Roche, and Novartis: companies whose value is almost entirely in brands, patents, and research pipelines. Stripping goodwill and intangibles from their book value leaves a denominator that dramatically understates their economic worth. The P/TBV ratio appears high, excluding the best-known Swiss companies from the screen.
What passes the screen instead are Swiss industrials and financials with more physical asset intensity. These businesses don't drive the headline index returns, but they delivered just over 4 percentage points of annual alpha over the SMI. The strategy captures the right slice of the Swiss market for a tangible-book signal, even if it's not the slice most investors associate with Switzerland.
Sharpe Ranking: Risk-Adjusted Picture
When you adjust for volatility, the rankings shift.
| Exchange | Sharpe |
|---|---|
| US | 0.480 |
| Sweden | 0.370 |
| UK | 0.360 |
| Taiwan | 0.340 |
| Canada | 0.334 |
| Germany | 0.304 |
| India | 0.297 |
| Switzerland | 0.281 |
| Japan | 0.254 |
| Thailand | 0.236 |
| China | 0.195 |
| Hong Kong | 0.183 |
| Singapore | 0.099 |
| South Africa | 0.076 |
| Korea | 0.060 |
The US has the best Sharpe ratio: 0.48. It generates excess return with the least volatility. India's highest absolute CAGR (14.64%) comes with enough variance to push its Sharpe below Sweden and the UK.
China's Sharpe of 0.195 is modest despite its CAGR of 9.84%. Chinese markets are more volatile, and the high CAGR includes some extraordinary years (2006: +138.1% driven by a domestic speculative bubble) that inflate the compound return while also inflating variance.
South Africa's 0.076 Sharpe is an artifact of the 9% risk-free rate, not poor absolute performance. The raw return of 10.66% and +2.81% excess vs SPY are real outperformance. When your benchmark for risk-free return is a 9% government bond, almost any equity strategy will look poor on Sharpe.
What This Means for a Global Portfolio
The natural application of this data is diversification. With 14 of 15 exchanges generating positive alpha vs their local benchmark, the strategy works globally with only one exception. The UK (+9.24%), China (+7.41%), and Sweden (+6.70%) offer the largest excess returns. India has the highest absolute CAGR at 14.64%, though its edge over the Sensex is a more modest +2.58%.
Korea is the only exchange where the strategy underperforms its local index. Singapore and Thailand generate positive alpha, but the thin edge (+1.82% and +0.64% respectively) combined with concentrated portfolios and high cash periods makes them less reliable.
The most interesting portfolio construction question is which combination of exchanges provides the best risk-adjusted return with genuine diversification. The UK and Germany together with the US gives you three different economic cycles, three different currencies, and high excess returns in each market.
Current Global Screen
The current global P/TBV screen across all 15 exchanges is available at cetaresearch.com/data-explorer?q=S6XE_b2IbT. You can run the query yourself to see which companies currently pass the screen in each market.
Limitations
All returns are in local currency. Currency movements between markets will affect USD-based investors in ways not captured here.
The 2000-2003 period for some exchanges (notably Sweden, South Africa) includes cash periods that coincided with the dot-com crash. This inflates those exchanges' early cumulative returns in ways that aren't repeatable.
Mktcap thresholds were set per exchange and may not capture the full investable universe, particularly for smaller exchanges (Singapore, Sweden in early years).
Survivorship bias is partially mitigated by using the full FMP database including delisted companies, but this varies by exchange and time period. Emerging markets before 2005 have thinner data coverage than developed markets.
Dedicated Regional Blogs
- US: NYSE/NASDAQ/AMEX
- India: NSE
- UK: London Stock Exchange
- Germany: XETRA
- China: Shanghai/Shenzhen
- Sweden: Stockholm Stock Exchange
- Canada: Toronto Stock Exchange
- Hong Kong: HKSE
Data: Ceta Research (FMP financial data warehouse), 2000-2025. 15 exchanges. Annual rebalance, July. Equal weight, top 30 by P/TBV ascending per exchange. Local benchmark used for excess return and capture ratios per exchange.
Past performance does not guarantee future results. This is educational content, not investment advice.


