
P/TBV Strategy in Sweden: 9.25% CAGR and +6.70% Alpha Over the OMX Stockholm 30

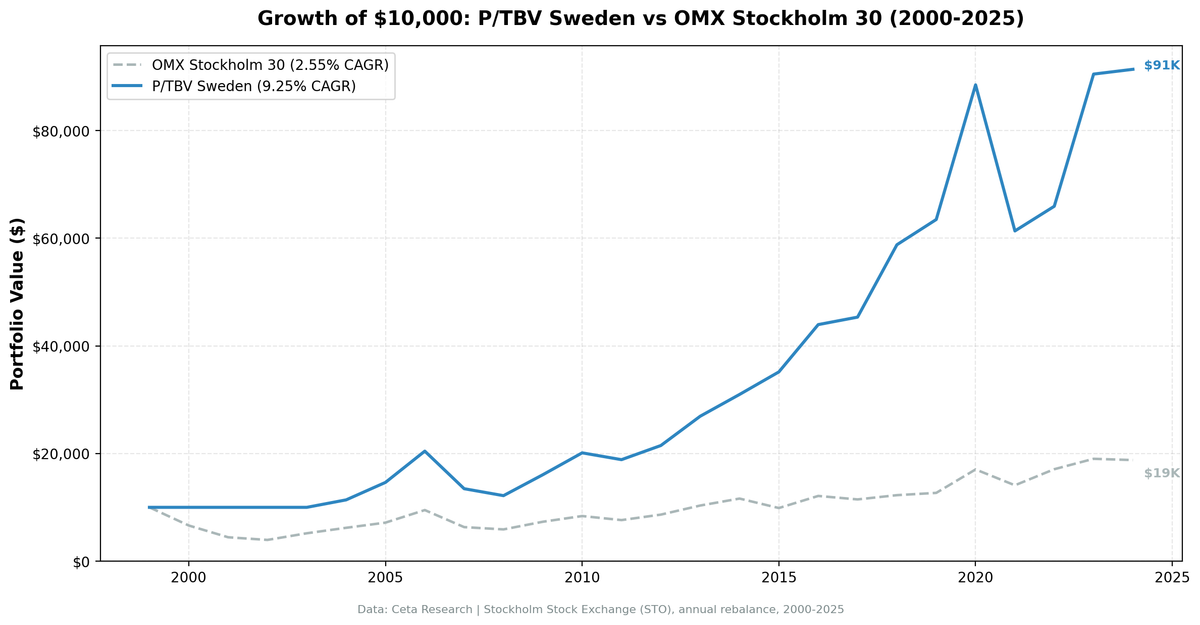
Swedish industrial companies, sorted by the ratio of market cap to tangible book value, returned 9.25% annually from 2000 to 2025, beating the OMX Stockholm 30 by 6.70 percentage points. The OMX returned just 2.55% annualised over the same period. The strategy spent four years in cash at the start, which accidentally sidestepped the dot-com crash, and then compounded steadily on the back of Nordic industrials. Down capture of 38.0% means the strategy absorbs less than 40% of the OMX's losses in bad years, and it beat the benchmark in 16 of 21 invested years (76% win rate).
Contents
- What the Strategy Does
- The Cash Years (2000-2003)
- Annual Returns
- The 2007-2008 Story
- The Problem Years
- 2015 and 2018: The Standout Years
- Full Backtest Statistics
- Why Sweden Works for P/TBV
- What This Means for a Portfolio
- Current Screen
- Limitations
Data: FMP financial data warehouse, 2000–2025. Updated June 2026.
What the Strategy Does
We screen the Stockholm Stock Exchange by P/TBV (price to tangible book value), apply three quality filters (ROE > 8%, ROA > 3%, operating margin > 10%), then hold the 30 cheapest qualifying stocks by P/TBV, rebalancing each July. The market cap floor is 5 billion SEK (roughly $460M USD). P/TBV strips goodwill and intangibles from the denominator, leaving only physical and financial assets, which suits a market dominated by manufacturers, banks, and engineering companies.
The academic basis comes from Fama and French (1992), who found that book-to-market ratio is one of the most reliable long-run predictors of equity returns. Tangible book goes further: it avoids the distortions that goodwill and acquired intangibles create in standard P/B ratios.
The Cash Years (2000-2003)
The strategy held no position from 2000 through 2003. The qualifying universe on the Stockholm exchange didn't reach 10 stocks at the 5B SEK threshold until 2004, when Swedish industrials had accumulated enough FY reporting history in the FMP database to pass the quality filters.
That turned out to be a windfall. The OMX Stockholm 30 fell 33.73% in 2000, 32.98% in 2001, and 11.15% in 2002. Sweden's market was devastated by the dot-com crash, but the strategy was entirely in cash. When the universe finally hit the minimum threshold in 2004, it entered on clean footing.
This isn't a repeatable advantage. It's path-dependent luck from the data coverage timeline. We're noting it because it explains why the cumulative chart looks unusually strong in the early years.
Annual Returns
| Year | Sweden P/TBV | OMX Stockholm 30 | Excess |
|---|---|---|---|
| 2000 | 0% (cash) | -33.73% | +33.73% |
| 2001 | 0% (cash) | -32.98% | +32.98% |
| 2002 | 0% (cash) | -11.15% | +11.15% |
| 2003 | 0% (cash) | +31.32% | -31.32% |
| 2004 | +13.86% | +19.62% | -5.76% |
| 2005 | +28.51% | +15.49% | +13.03% |
| 2006 | +39.71% | +32.59% | +7.12% |
| 2007 | -34.14% | -33.35% | -0.79% |
| 2008 | -9.59% | -6.72% | -2.88% |
| 2009 | +31.93% | +24.08% | +7.85% |
| 2010 | +25.32% | +14.50% | +10.81% |
| 2011 | -6.29% | -8.98% | +2.68% |
| 2012 | +13.93% | +13.32% | +0.61% |
| 2013 | +25.32% | +19.52% | +5.80% |
| 2014 | +15.03% | +12.53% | +2.49% |
| 2015 | +13.53% | -15.14% | +28.67% |
| 2016 | +24.99% | +22.77% | +2.22% |
| 2017 | +3.16% | -5.32% | +8.48% |
| 2018 | +29.66% | +6.89% | +22.78% |
| 2019 | +7.98% | +3.45% | +4.53% |
| 2020 | +39.41% | +34.34% | +5.07% |
| 2021 | -30.67% | -17.27% | -13.40% |
| 2022 | +7.47% | +21.18% | -13.71% |
| 2023 | +37.25% | +11.31% | +25.94% |
| 2024 | +0.98% | -1.24% | +2.22% |
The 2007-2008 Story
These two years stand out. In 2007, the OMX fell 33.35% and Swedish P/TBV stocks fell 34.14%, essentially tracking the index down. But in 2008, the OMX lost another 6.72% while the strategy lost 9.59%. The combined two-year drawdown was painful, but the strategy recovered faster: +31.93% in 2009 versus the OMX's +24.08%.
The reason is structural. Swedish industrials like SSAB, Atlas Copco, and SKF held hard assets: steel mills, machine tools, precision manufacturing equipment. When markets panicked, these businesses kept generating cash. Their book values didn't evaporate. The P/TBV screen had selected the cheapest among already-tangible companies, so there was limited valuation air to let out.
The Problem Years
2021 was the worst relative year: -30.67% vs the OMX's -17.27%, a 13-point gap. Peak QE, meme stocks, high-multiple tech dominating returns. Low-P/TBV industrials and materials companies were exactly what the market didn't want that year. Growth-at-any-price won. Value lost badly across most markets, not just Sweden.
2022 showed +7.47% vs the OMX's +21.18%, a 14-point gap. The OMX rallied hard while the strategy's quality-industrial holdings lagged the broader recovery.
These years reflect an honest weakness: when market sentiment strongly favors growth over value, or when the index rallies on sectors outside the strategy's universe, the strategy underperforms. That's not a flaw in the construction. It's the nature of any value-tilted approach.
2015 and 2018: The Standout Years
Two years worth examining closely. In 2015, the strategy returned +13.53% while the OMX fell 15.14%, a 29-point swing. And in 2018, +29.66% versus the OMX's +6.89%. Both years reflect periods when the global capital expenditure cycle favored industrial equipment companies. Companies like Volvo, Sandvik, and Atlas Copco, all candidates for a low-P/TBV industrial screen, benefited from strong equipment orders from Asia and Europe. The tangible book screen captured the cheap end of this cycle, and those holdings delivered.
Full Backtest Statistics
| Metric | Value |
|---|---|
| CAGR (2000-2025) | 9.25% |
| OMX Stockholm 30 CAGR | 2.55% |
| Excess return | +6.70% |
| Sharpe ratio | 0.37 |
| Max drawdown | -40.46% |
| Up capture | 120.31% |
| Down capture | 38.0% |
| Beta | 0.694 |
| Alpha | 6.87% |
| Invested periods | 21 of 25 years |
| Avg stocks held | 22.6 |
| Cash periods | 4 (2000-2003) |
The up capture of 120.31% means the strategy captures more than 100% of the OMX's positive years. That's unusual for a value strategy and reflects Swedish industrials' sensitivity to global growth cycles. The 38.0% down capture is the real edge: in OMX down years, the strategy absorbs less than 40% of the losses.
Why Sweden Works for P/TBV
Sweden's economy is built on industrials, materials, and financials. Ericsson is the outlier, but the market's weight is in Volvo, SSAB, Sandvik, Hexagon, SKF, SEB, Handelsbanken. These companies hold real assets: factories, equipment, loan books with collateral. Stripping goodwill from book value doesn't destroy their balance sheets the way it would for a pharmaceutical company or a consumer brand.
The quality filters matter here. Without ROE > 8% and ROA > 3%, the screen would include distressed industrials with cheap book values for bad reasons. The filters ensure we're buying cheap-relative-to-assets companies that are still generating returns, not just buying the cheapest balance sheets in the market.
What This Means for a Portfolio
Sweden adds 6.70% annual excess return vs the OMX Stockholm 30 with a beta of 0.694. It's not fully correlated with the domestic index, which provides real diversification value. The 38.0% down capture means you get meaningful downside protection in local terms.
The 2000-2003 cash period was fortuitous but not structural. If you'd started this strategy in 2001 with a universe that cleared 10 stocks, the early years would look different. Treat the cash period as historical artifact, not repeatable design.
Over 25 years, $100K grows to roughly $914K at 9.25% CAGR vs $188K at the OMX's 2.55%. The 6.70% difference compounds dramatically.
Current Screen
The live P/TBV screen for Stockholm-listed companies is available at cetaresearch.com/data-explorer. Run the query yourself: which Swedish industrials currently trade at the lowest tangible book multiples while clearing the quality filters.
Limitations
The 4-year cash period from 2000-2003 is the largest data artifact in this backtest. It inflates cumulative returns because it happened to coincide with the dot-com crash. We can't replicate that coincidence.
Mktcap threshold of 5B SEK is modest. Some microcap distortion is possible in thin years when the universe sits at 10-15 stocks. The avg of 22.6 stocks per invested period mitigates this, but the early invested years (2004-2006) had thinner coverage.
Currency: all returns are local currency (SEK). For USD-based investors, SEK/USD fluctuations add a layer of variance not captured here.
Data: Ceta Research (FMP financial data warehouse), 2000-2025. Universe: Stockholm Stock Exchange, mktcap > 5B SEK. Annual rebalance, July. Equal weight, top 30 by P/TBV ascending.
Past performance does not guarantee future results. This is educational content, not investment advice.


