
Revenue Surprise Momentum Across 9 Exchanges: What Local Benchmarks Reveal
We tested revenue surprise momentum on 9 exchanges using local benchmarks. US: +1.92% excess vs S&P 500. UK: +2.24% vs FTSE — but barely. India looks good in absolute terms but underperforms the Sensex by 1.87% annually.

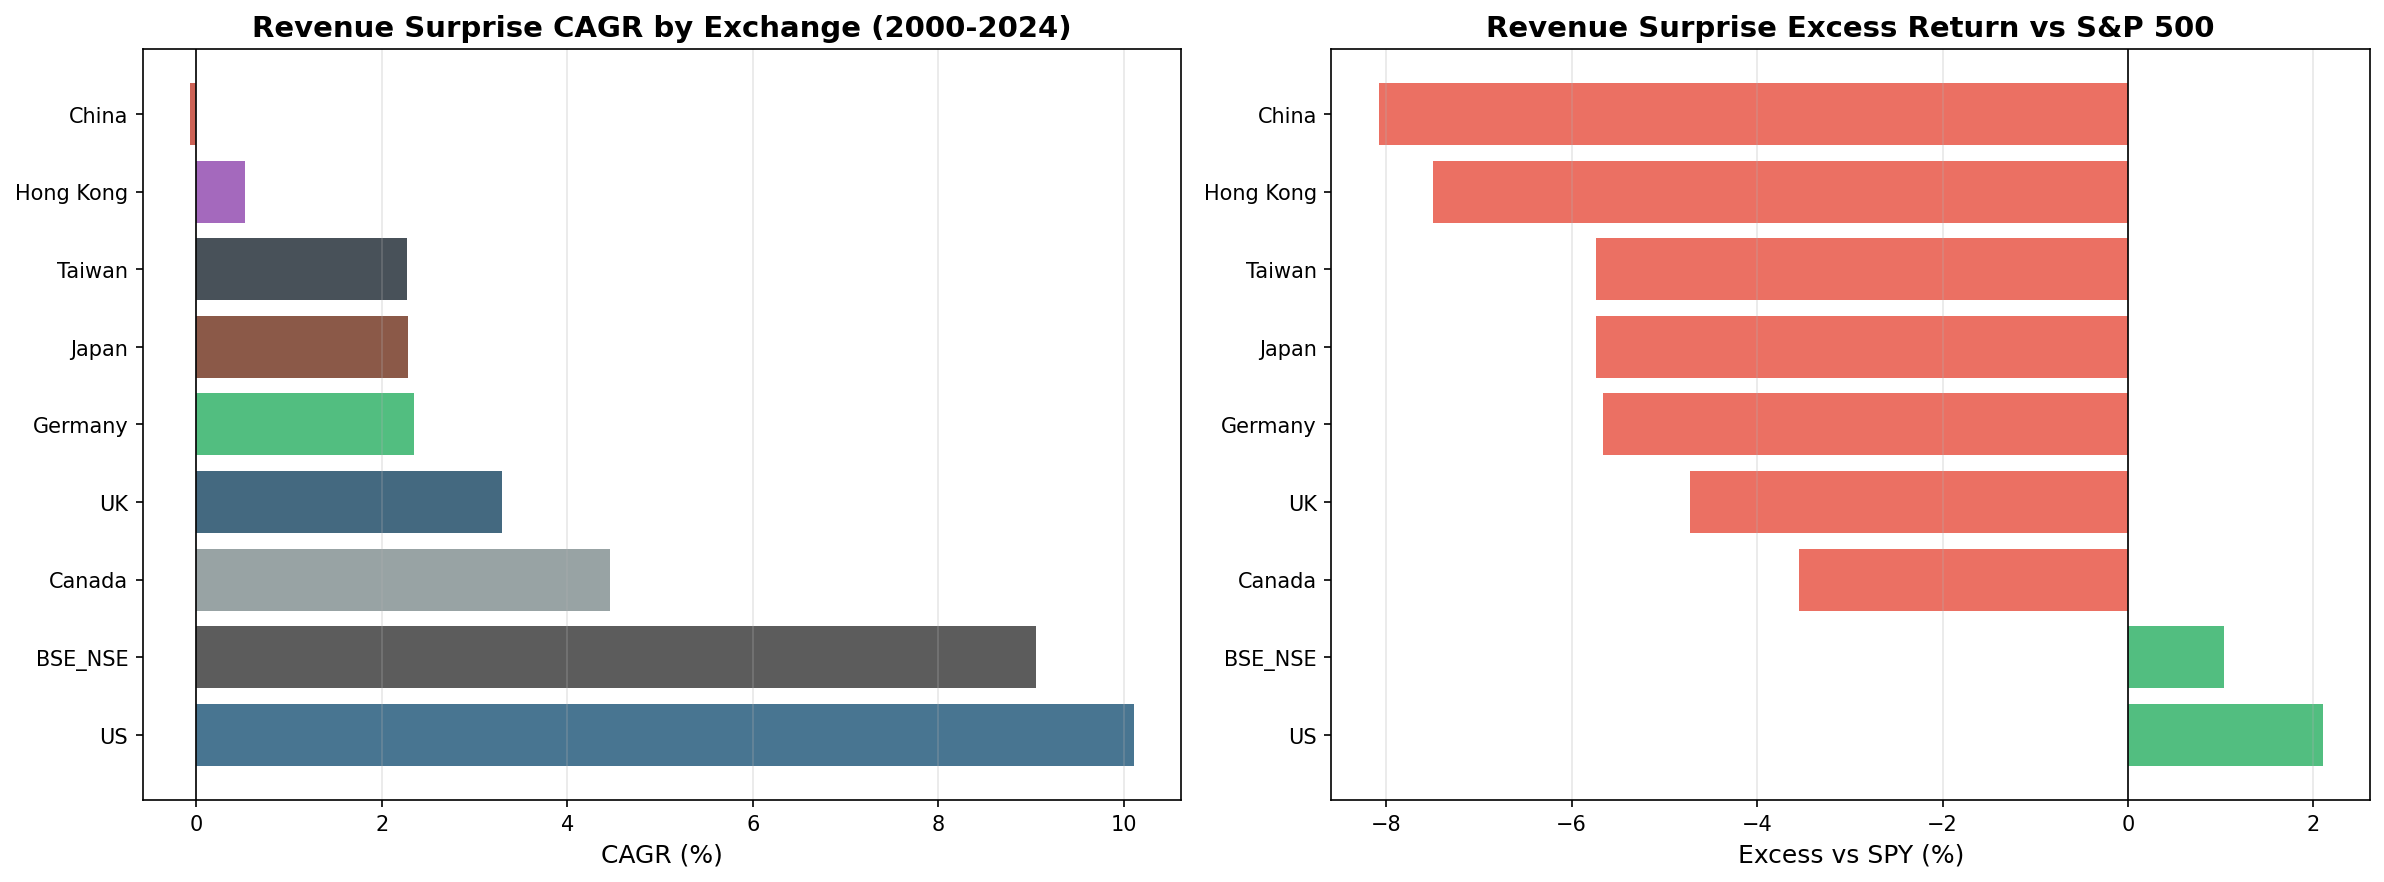
We ran revenue surprise momentum (buying stocks that beat quarterly analyst revenue estimates) on 9 stock exchanges worldwide from 2000 to 2025. Using local currency benchmarks for each market, two exchanges show positive excess: the US (+1.92% vs S&P 500) and the UK (+2.24% vs FTSE 100). Every other exchange underperforms its local index, and most do so with significant cash periods because the underlying data doesn't exist historically.
Contents
- Method
- What We Found
- US and UK show positive excess. Everyone else doesn't.
- Max Drawdowns
- The Data Availability Problem
- US: The Cleanest Result
- UK: Positive Excess, With Caveats
- India: High Absolute Return, Negative vs Sensex
- Germany: 0% Cash, Severe Drawdown, No Alpha
- What This Means
- Individual Exchange Posts
- References
The data infrastructure problem is real, but it's not the only story.
Data: FMP financial data warehouse, 2000–2025. Updated March 2026.
Method
Data source: Ceta Research (FMP financial data warehouse) Period: 2000–2025 (25 years, 103 quarterly periods) Rebalancing: Quarterly (January, April, July, October), equal weight Benchmark: Local currency index for each exchange (Sensex for India, FTSE 100 for UK, DAX for Germany, etc.) Transaction costs: Size-tiered model (0.1–0.5% one-way based on market cap) Cash rule: Hold cash if fewer than 10 stocks qualify at a rebalance date Execution: MOC (signal from prior quarter's filings, executed at next trading day's close)
Revenue surprise signal (all filters must pass):
| Filter | Threshold |
|---|---|
| Revenue surprise | 0% < surprise < 50% (beat estimates, exclude outliers) |
| ROE | > 8% |
| Debt/Equity | < 2.5 |
| Market cap | Exchange-specific threshold (local currency) |
The strategy requires two data sources joined together: quarterly revenue actuals from income_statement (periods Q1/Q2/Q3/Q4) and quarterly analyst consensus estimates from analyst_estimates (period='quarter'). This join is where most international markets fall apart.
What We Found
US and UK show positive excess. Everyone else doesn't.

| Exchange | CAGR | Benchmark | Bench CAGR | Excess | Sharpe | Cash % | Avg Stocks |
|---|---|---|---|---|---|---|---|
| US (NYSE+NASDAQ+AMEX) | 9.94% | S&P 500 | 8.02% | +1.92% | 0.384 | 0% | 29.3 |
| UK (LSE) | 3.59% | FTSE 100 | 1.36% | +2.24% | 0.005 | 45% | 15.9 |
| Canada (TSX) | 4.47% | TSX Composite | 5.08% | -0.62% | 0.113 | 12% | 29.2 |
| Japan (JPX) | 2.40% | Nikkei 225 | 3.40% | -1.00% | 0.251 | 75% | 26.4 |
| Hong Kong (HKSE) | 0.48% | Hang Seng | 1.77% | -1.29% | -0.139 | 42% | 27.1 |
| Taiwan (TAI+TWO) | 2.74% | TAIEX | 4.38% | -1.64% | 0.167 | 75% | 30.0 |
| India (NSE) | 9.25% | Sensex | 11.12% | -1.87% | 0.144 | 45% | 29.3 |
| Germany (XETRA) | 2.26% | DAX | 5.12% | -2.86% | 0.013 | 0% | 22.1 |
| China (SHZ+SHH) | 0.23% | SSE Composite | 4.19% | -3.97% | -0.230 | 75% | 30.0 |
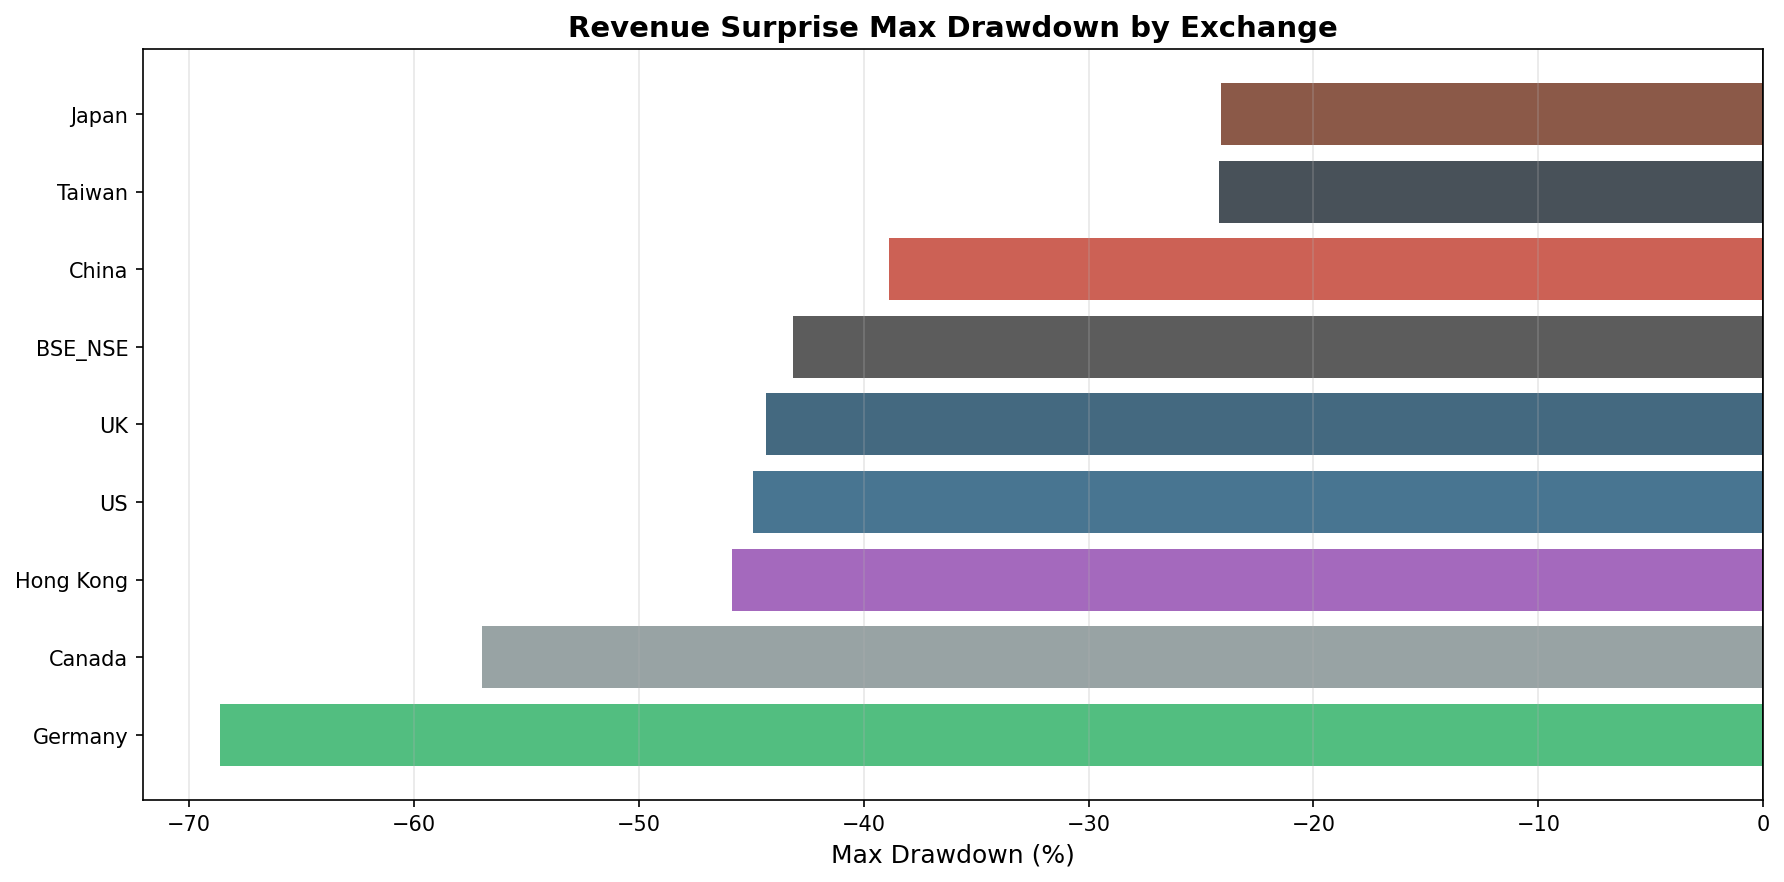
Max Drawdowns
| Exchange | Max Drawdown | Invested % |
|---|---|---|
| Germany (XETRA) | -69.2% | 100% |
| Canada (TSX) | -56.9% | 88% |
| Hong Kong (HKSE) | -45.7% | 58% |
| UK (LSE) | -43.7% | 55% |
| US (NYSE+NASDAQ+AMEX) | -43.7% | 100% |
| India (NSE) | -41.1% | 55% |
| China (SHZ+SHH) | -40.0% | 25% |
| Japan (JPX) | -26.0% | 25% |
| Taiwan (TAI+TWO) | -21.3% | 25% |
Japan and Taiwan show shallow max drawdowns (-21 to -26%) because the portfolio held cash for 75% of the period. When the signal did fire, those positions lost money, but not often enough to produce a large drawdown number.
Germany's -69.2% is the most concerning result for a fully-invested exchange. With 0% cash and an average of 22 stocks, bad quarters in 2001-2003 and 2008-2009 on a concentrated portfolio drove severe losses.
The Data Availability Problem
The core issue for non-US exchanges isn't strategy design for most markets. It's the data pipeline.
Revenue surprise requires quarterly analyst consensus revenue estimates: not annual estimates, not forward guidance, but backward-looking consensus estimates for each fiscal quarter. In the US, this data exists comprehensively from the early 1990s onward. For international markets, this coverage is thin at best, absent at worst:
| Exchange | Coverage Start | Cash % | Root Cause |
|---|---|---|---|
| US (NYSE+NASDAQ+AMEX) | 1992+ | 0% | Full historical quarterly estimates |
| Canada (TSX) | ~2000 | 12% | Partial quarterly coverage, gaps early years |
| India (NSE) | ~2005 (patchy) | 45% | Quarterly estimates sparse before 2015 |
| UK (LSE) | ~2005 | 45% | Annual estimates dominant, quarterly patchy |
| Hong Kong (HKSE) | ~2005 | 42% | Limited mid-cap coverage |
| Germany (XETRA) | ~2000 | 0% | Coverage exists but mid-cap gaps |
| Japan (JPX) | ~2011 | 75% | Semi-annual reporting, limited quarterly coverage |
| Taiwan (TAI+TWO) | ~2011 | 75% | Same as Japan |
| China (SHZ+SHH) | ~2010 | 75% | Forward-looking estimates only, limited backfill |
Japan, Taiwan, and China spend 75% of the test in cash. The signal couldn't fire because matching quarterly actuals against quarterly consensus was impossible in most quarters. The 25% of invested periods cluster in recent years (2015–2025).
US: The Cleanest Result
The US runs 103 of 103 quarters fully invested, no cash. The signal fired every quarter for 25 years. CAGR 9.94%, S&P 500 8.02%, excess +1.92%, Sharpe 0.384.
Up capture 110.3%, down capture 93.1%. The strategy captures more market upside and slightly less downside. Over 25 years that asymmetry compounds to a 1,047% total return vs the market's 628%.
The two worst stretches: 2013-2015 (QE multiple expansion undercut fundamental signals) and 2020-2021 (Fed stimulus inflated tech multiples while revenue surprises on beaten-down names meant less). Outside those periods, the strategy tracks reasonably close to the market with a consistent positive tilt.
UK: Positive Excess, With Caveats
The UK is the one non-US market where revenue surprise shows positive excess vs the local benchmark: +2.24% vs FTSE 100, over 25 years.
That number needs context. The FTSE 100 returned only 1.36% CAGR over this period, a weak benchmark. UK large-caps significantly underperformed global equities over 2000-2025 due to sector composition (energy, materials, financials, consumer staples) and the structural headwinds from Brexit uncertainty. Beating 1.36% annually is a lower bar than beating the S&P 500.
The strategy was also only invested 55% of the time (57 of 103 quarters). With 45% cash and a Sharpe ratio of 0.005 (essentially zero risk-adjusted return), the UK result is statistically fragile.
The honest interpretation: the revenue surprise signal may work in the UK for the periods where data exists, but the combination of a weak local benchmark, sparse historical analyst coverage, and near-zero Sharpe means this isn't actionable without much more evidence.
India: High Absolute Return, Negative vs Sensex
India (NSE) returned 9.25% CAGR, which looks strong until you compare it to the Sensex, which returned 11.12% CAGR over the same period. Excess return vs the local benchmark: -1.87%.
The old presentation (comparing Indian stocks to SPY) showed +1.03% excess because the Indian market structurally outperformed US equities over this period. That was a currency and market comparison artifact, not alpha. Using the correct local benchmark reveals the strategy underperformed India's own index.
With 45% cash (signal only available from ~2005-2010 onward), and negative excess vs the Sensex in the invested periods, India doesn't support the strategy, even though the absolute CAGR looks impressive.
Germany: 0% Cash, Severe Drawdown, No Alpha
Germany (XETRA) ran 0% cash, with enough qualifying stocks every quarter for 25 years. But results were poor: 2.26% CAGR vs 5.12% DAX, excess -2.86%, and a maximum drawdown of -69.2%.
This drawdown reflects what happens when quarterly analyst coverage exists but the portfolio is concentrated in mid-cap cyclicals. A portfolio of 22 German industrial/chemical/materials stocks beating quarterly revenue estimates still fell severely in 2001-2003 and 2008-2009. The data was there, the signal fired, and the stocks still underperformed.
Germany tells you data availability is necessary but not sufficient. The signal needs both data and a market structure where the revenue beat is informative about future price.
What This Means
Revenue surprise momentum is reliable in the US and possibly marginal in the UK. For every other exchange tested, the signal either lacks the historical data to fire consistently, or fires but doesn't produce positive excess vs the local market.
The explanation isn't the same for all markets: - Japan, Taiwan, China: data problem. Signal can't run. - India: data partially available but Indian market growth makes local benchmark too hard to beat. - Germany: data exists but mid-cap concentration amplifies drawdowns without return premium. - UK: marginally positive but weak benchmark, sparse data, near-zero Sharpe.
For investors in US equities: the signal works. 1.9% excess CAGR over 25 years is real and the mechanism is sound. Quarterly rebalancing is non-negotiable.
For investors in other markets: check whether quarterly consensus revenue estimates exist in sufficient depth for your target market. If they don't, the signal won't fire. If they do, check whether the local market structure allows fundamental signals to produce alpha. Data availability doesn't guarantee it.
Run the US revenue surprise screen on Ceta Research
Individual Exchange Posts
- Revenue Surprise Momentum: US Results (9.94% CAGR, +1.92% excess, 25 years fully invested)
References
- Jegadeesh, N. & Livnat, J. (2006). "Revenue Surprises and Stock Returns." Journal of Accounting and Economics, 41(1–2), 147–166.
- Bushee, B. & Raedy, J. (2006). "Factors Affecting the Implementability of Stock Market Trading Strategies." Working Paper, University of Pennsylvania. (Context: data availability constraints on implementability)
- Griffin, J., Ji, X. & Martin, S. (2003). "Momentum Investing and Business Cycle Risk: Evidence from Pole to Pole." Journal of Finance, 58(6), 2515–2547. (Cross-market momentum analysis)
Data: Ceta Research, FMP financial data warehouse. 9 exchanges, quarterly rebalance, equal weight, transaction costs included, MOC execution, 2000–2025. Returns in local currency vs local index benchmark.
Past performance does not guarantee future results. This is educational content, not investment advice.


