
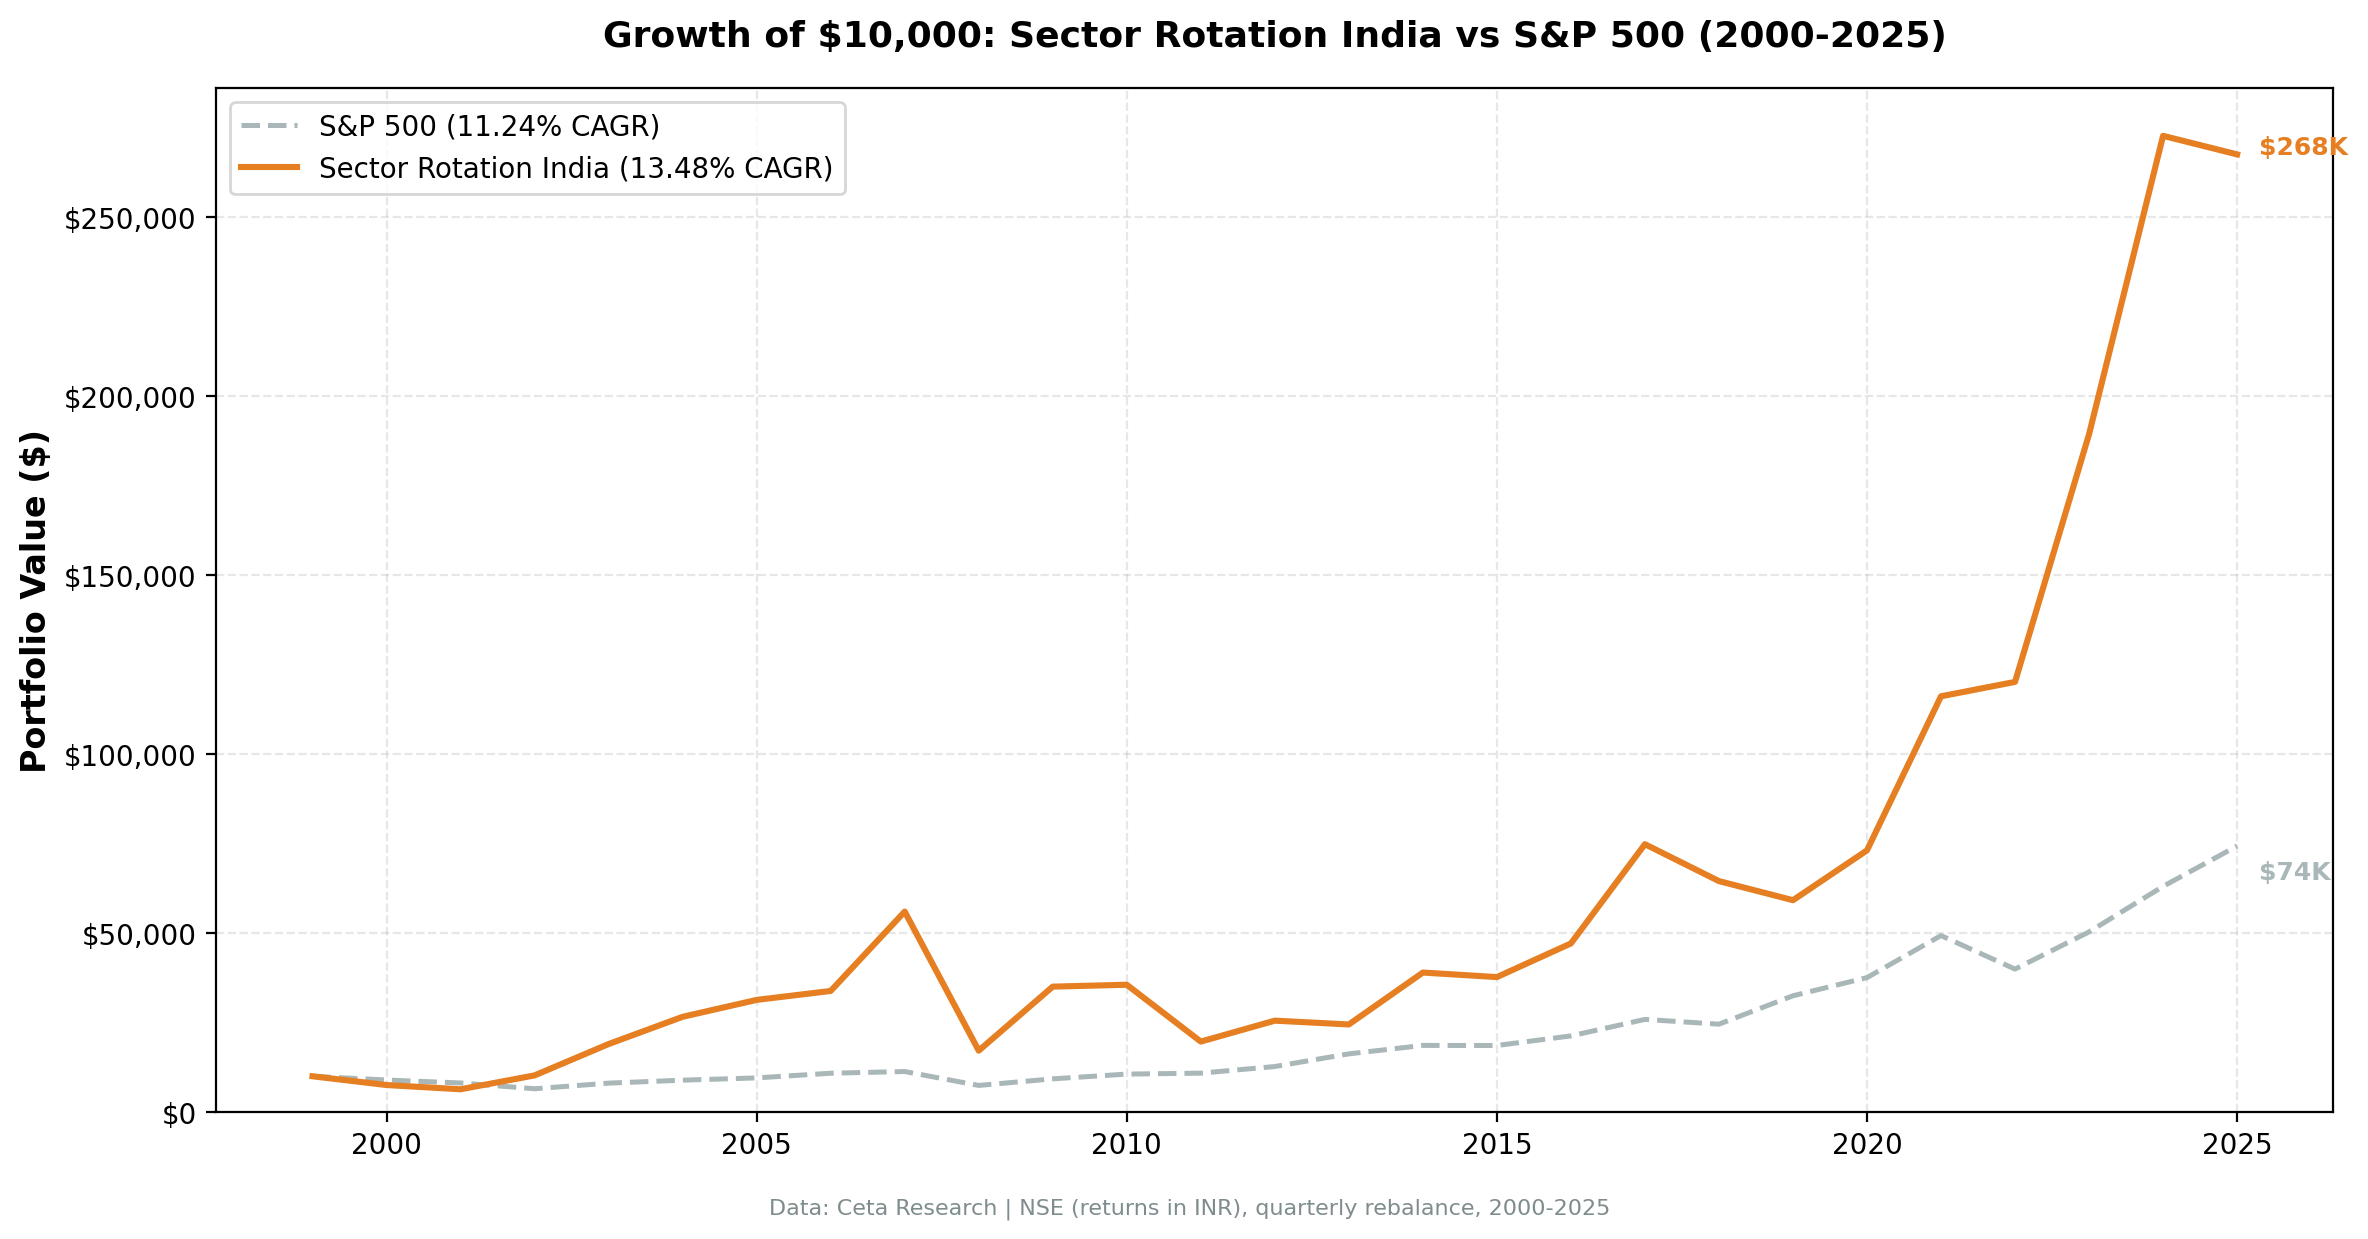
Sector Mean Reversion in India: 13.48% CAGR, 2576% Total Return, and a 72% Drawdown
Buying the two most out-of-favor sectors on NSE each quarter returned 13.48% annually over 26 years, +2.23% above Sensex. The cost: a -72.65% max drawdown and 38% annualized volatility that tests any strategy's durability.

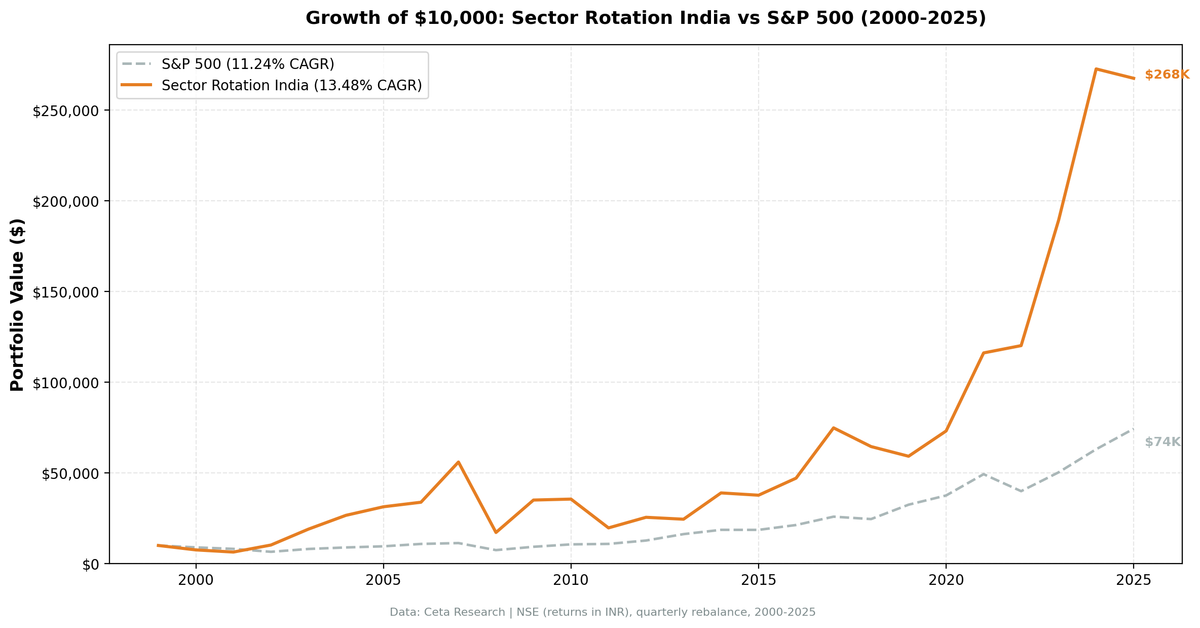
India's sector mean reversion strategy returned 13.48% annually on NSE from 2000 to 2025, turning INR 10,000 into INR 267,593 (2,576% total return). The Sensex grew at 11.24% annually over the same period. That's +2.23% excess CAGR vs the local benchmark. The catch: a -72.65% max drawdown and 38% annualized volatility that will end most investors' patience before the compounding does its work.
Contents
- Method
- What We Found
- Most Selected Sectors (104 quarters)
- Notable Years
- Full Annual Returns
- Backtest Methodology
- Limitations
- Takeaway
- Part of a Series
- References
Data: FMP financial data warehouse, 2000–2025. Updated March 2026.
Method
Data source: Ceta Research (FMP financial data warehouse) Universe: NSE (India), market cap > INR 20B (~$240M USD) Period: 2000-2025 (26 years, 104 quarterly periods) Rebalancing: Quarterly (January, April, July, October) Signal: Buy all stocks in the bottom 2 sectors by 12-month trailing equal-weighted return Portfolio construction: Equal weight all qualifying stocks in selected sectors Benchmark: Sensex (^BSESN, INR) Cash rule: Hold cash if fewer than 5 stocks qualify Currency note: Returns are in INR. Benchmark is Sensex (also INR). This is a like-for-like comparison.
Historical financial data with 45-day lag to prevent look-ahead bias. Full methodology: backtests/METHODOLOGY.md
What We Found
India has one of the highest raw CAGRs of any exchange tested, but the Sensex itself grew at 11.24% annually over 26 years. So the strategy's +2.23% excess vs local benchmark tells a more measured story than the raw CAGR suggests.
| Metric | Portfolio | Sensex |
|---|---|---|
| CAGR | 13.48% | 11.24% |
| Excess CAGR | +2.23% | — |
| Total Return | 2576% | — |
| Max Drawdown | -72.65% | — |
| Annualized Volatility | 38.02% | — |
| Sharpe Ratio | 0.183 | — |
| Win Rate (vs Sensex) | 45.19% | — |
| Up Capture | 132.83% | — |
| Down Capture | 120.31% | — |
| Avg Stocks per Period | 71.7 | — |
| Cash Periods | 3 of 104 | — |
The up/down capture profile is the key number. The strategy captures 132.83% of Sensex upside and 120.31% of Sensex downside. You get more of the rallies and more of the crashes. The Sharpe of 0.183 is low, reflecting that the raw return doesn't compensate adequately for the volatility relative to a risk-free rate. India rewards mean reversion, but not as dramatically as comparing to SPY suggested.
The win rate of 45.19% means the strategy beat Sensex in fewer than half of all quarters. The outperformance comes from the wins being larger than the losses.
Most Selected Sectors (104 quarters)
| Sector | Quarters Selected |
|---|---|
| Utilities | 39 |
| Real Estate | 31 |
| Communication Services | 29 |
| Healthcare | — |
| Technology | — |
| Consumer Defensive | — |
Utilities dominated, appearing in 39 of 104 quarters. India's utility sector goes through extended regulatory and tariff cycles, making it prone to multi-year underperformance followed by recovery. Real Estate reflects India's property cycles. Communication Services appeared often as Indian telco went through multiple rounds of price wars, spectrum battles, and consolidation.
Notable Years
2003: +85.54%. Post-dot-com recovery coincided with India's early infrastructure boom. The Sensex returned 79.09% that year. The strategy beat it by +6.45%.
2004-2005: Large split. The strategy gained 40% in 2004 while Sensex gained 10.83%. Then in 2005, Sensex surged 40.59% while the strategy returned 17.75%. The contrarian tilt means you lag in momentum-driven years and lead in recovery years.
2006: Underperformance. Sensex returned 48.48% in 2006, the strategy returned only 7.97%. This is the cost of being in beaten-down sectors when the broader market is surging. The sectors selected weren't the ones leading the rally.
2008: -69.36%. The strategy dropped 69.36%, the Sensex dropped 51.34%. The strategy amplified the crash. Buying beaten-down cyclical sectors right into the global financial crisis meant holding the hardest-hit names when everything fell.
2009: +104.21%. The recovery was proportionally stronger: 104.21% vs Sensex 76.32%. The sectors destroyed in 2008 recovered violently. If you held through the crash, the rebound more than compensated.
2011: -44.64%. Communication Services and Real Estate were selected. Both kept falling. The Sensex fell 24.53%. The strategy amplified the decline. This is the core risk in mean reversion: sometimes sectors keep going down.
2021: +58.87%. COVID recovery. Communication Services and sectors beaten down during the 2018-2020 period reverted aggressively. Sensex returned 22.85%.
2023: +57.58%. Strong recovery year. Strategy returned 57.58% vs Sensex 17.53%.
Full Annual Returns
| Year | Portfolio | Sensex | Excess |
|---|---|---|---|
| 2000 | -24.47% | -25.23% | +0.76% |
| 2001 | -15.70% | -18.65% | +2.96% |
| 2002 | +60.89% | +2.93% | +57.95% |
| 2003 | +85.54% | +79.09% | +6.45% |
| 2004 | +40.05% | +10.83% | +29.22% |
| 2005 | +17.75% | +40.59% | -22.84% |
| 2006 | +7.97% | +48.48% | -40.51% |
| 2007 | +65.52% | +46.79% | +18.74% |
| 2008 | -69.36% | -51.34% | -18.02% |
| 2009 | +104.21% | +76.32% | +27.89% |
| 2010 | +1.50% | +17.10% | -15.60% |
| 2011 | -44.64% | -24.53% | -20.11% |
| 2012 | +29.68% | +27.04% | +2.63% |
| 2013 | -4.15% | +5.96% | -10.11% |
| 2014 | +59.25% | +33.51% | +25.74% |
| 2015 | -3.25% | -8.12% | +4.87% |
| 2016 | +24.93% | +3.79% | +21.14% |
| 2017 | +58.86% | +27.14% | +31.72% |
| 2018 | -13.78% | +6.15% | -19.93% |
| 2019 | -8.27% | +15.98% | -24.25% |
| 2020 | +23.53% | +15.74% | +7.80% |
| 2021 | +58.87% | +22.85% | +36.02% |
| 2022 | +3.46% | +3.35% | +0.11% |
| 2023 | +57.58% | +17.53% | +40.04% |
| 2024 | +44.02% | +11.20% | +32.83% |
| 2025 | -1.90% | +7.28% | -9.18% |
The pattern: wins are more concentrated (2002, 2004, 2007, 2009, 2014, 2017, 2021, 2023, 2024) but losses come in clusters (2005-2006, 2010-2011, 2018-2019). The win rate below 50% means you need to stay in for the clustered wins to pay off.
Backtest Methodology
| Parameter | Value |
|---|---|
| Signal | 12-month trailing equal-weighted sector return |
| Selection | Bottom 2 sectors each quarter |
| Universe | NSE, market cap > INR 20B |
| Portfolio | Equal weight all qualifying stocks in selected sectors |
| Rebalancing | Quarterly (Jan, Apr, Jul, Oct) |
| Cash rule | Hold cash if < 5 qualifying stocks |
| Transaction costs | Size-tiered model |
| Data lag | 45 days (prevents look-ahead bias) |
| Period | 2000-2025 (104 quarterly periods) |
| Benchmark | Sensex (^BSESN, INR) |
Limitations
Down capture above 100%. The strategy captures 120.31% of Sensex downside. When the Indian market falls, this portfolio tends to fall harder. That's what you expect from a strategy that systematically buys the most out-of-favor sectors.
Maximum drawdown of -72.65%. A 72.65% drawdown requires a 266% return just to break even. The recovery from 2008-2009 happened, but living through a 69% loss in a single year while holding requires an exceptionally long time horizon and tolerance for pain.
Concentrated sector bets. Utilities and Real Estate appeared in over 30 quarters each. This isn't broad sector diversification. In years when both underperform simultaneously (2011, 2013, 2019), the portfolio has no hedge.
Modest alpha vs local benchmark. The +2.23% annual excess vs Sensex is real but not extraordinary. It's achieved with 38% volatility vs Sensex's lower volatility. A Sensex index fund would give you 11.24% CAGR with lower drawdowns and less complexity.
Data quality. NSE data before 2005 is thinner than post-2010. Early returns should be read with extra caution. The reduction in average stock count to 71.7 (vs the BSE+NSE combined universe) also means less diversification per quarter.
Low win rate. The strategy beat Sensex in fewer than half of all quarters (45.19%). The outperformance is concentrated in specific recovery periods. If you enter at the wrong time or exit during a losing stretch, you may underperform the index badly.
Takeaway
India rewards sector mean reversion, but the comparison benchmark matters. The 13.48% CAGR is strong in absolute terms, but the Sensex itself compounded at 11.24% annually over 26 years. The strategy adds +2.23% annually vs the local index, with substantially more volatility, a worse Sharpe, and drawdowns that exceed 70%.
The strategy works best in India's recovery years: after the 2008 crash, after sector-specific selloffs, and in post-cycle recoveries. The years when India's momentum-driven winners surge (2005-2006, 2019) are years when this contrarian approach lags badly.
For a US investor comparing to SPY: India at 13.48% CAGR outperforms SPY (8.02%) by roughly +5.5% annually. But that's a currency-mixed comparison (INR returns vs USD benchmark). The actual value added for a local investor is +2.23% vs Sensex.
Part of a Series
- US analysis → — 10.63% CAGR, +2.61% vs S&P 500
- Korea analysis → — Best risk-adjusted globally: 0.39 Sharpe, 65.6% down capture
- Global comparison → — 14 exchanges, the full picture
References
Moskowitz, T. J., & Grinblatt, M. (1999). Do industries explain momentum? Journal of Finance, 54(4), 1249-1290.
Data: Ceta Research, FMP financial data warehouse. Universe: NSE. Quarterly rebalance, equal weight, 2000-2025. Returns in INR. Benchmark: Sensex (^BSESN). Past performance does not guarantee future results.


