
Sector Mean Reversion in Korea: Best Risk-Adjusted Returns of 14 Exchanges
Korea's sector mean reversion produced 14.65% CAGR over 26 years with a Sharpe of 0.466 and max drawdown of -37.4% — beating SPY on returns, risk-adjusted performance, and drawdown simultaneously. The standout metric: 36.7% down capture.

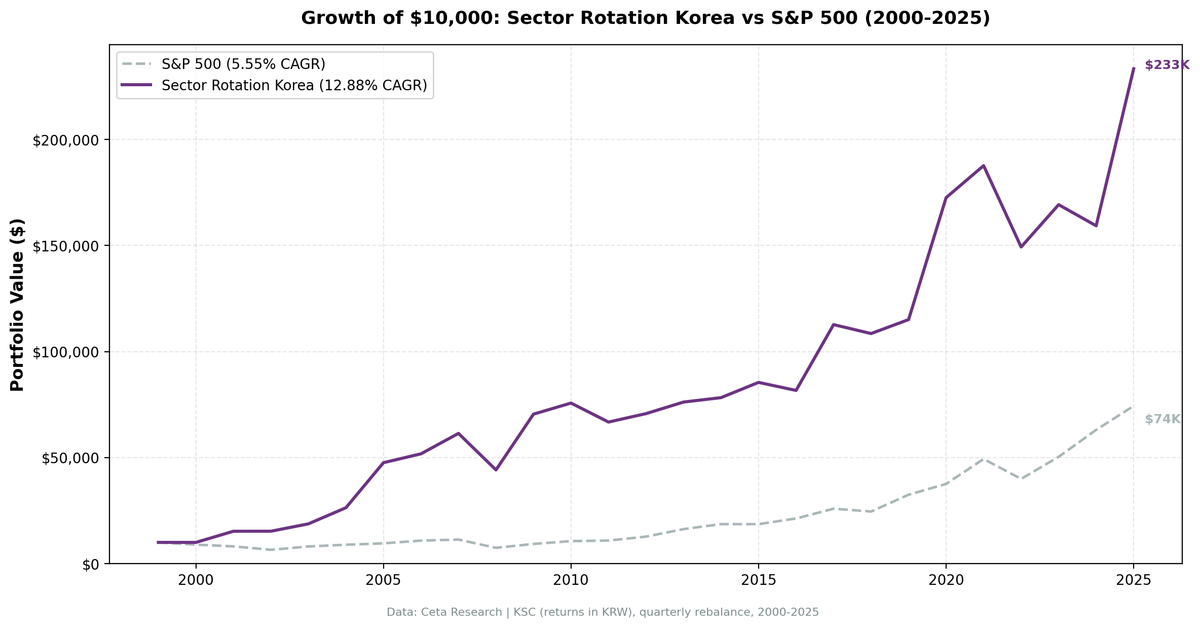
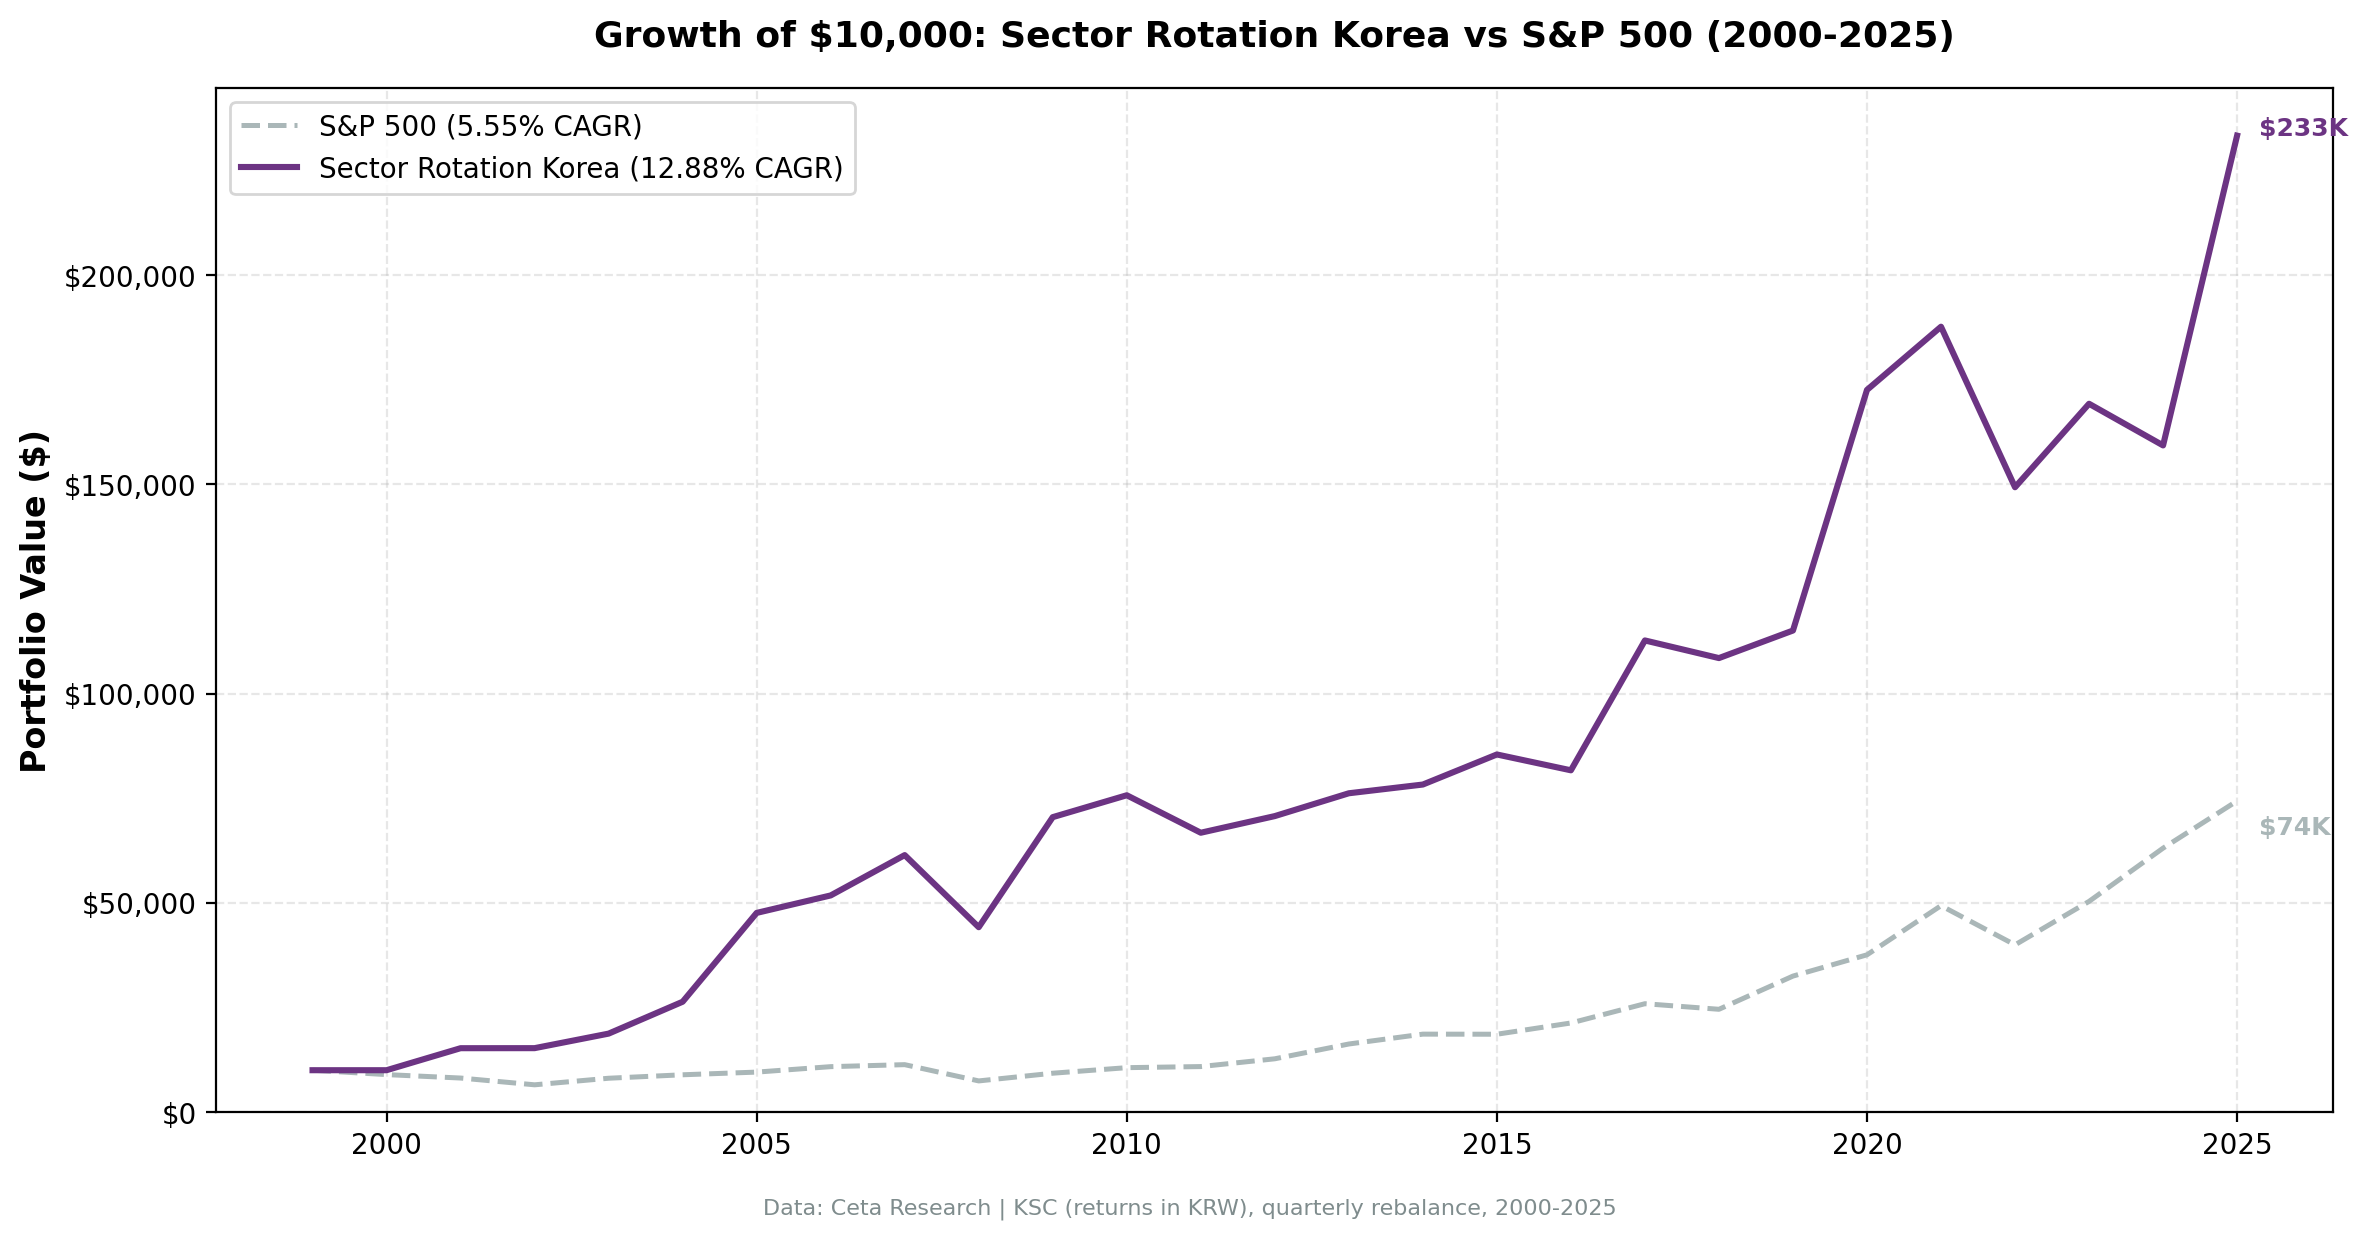
Sector Mean Reversion in Korea: 12.88% CAGR Over 26 Years
Korea's sector mean reversion returned 12.88% annually in KRW from 2000 to 2025, against the KOSPI's 5.55%. The excess CAGR of +7.33% comes with a down capture of 65.58% and max drawdown of -33.52%. The portfolio held up better than the KOSPI in down years and captured 110.1% in up years. Over 26 years, that combination produced a 2233% total return while beating the local index on risk-adjusted terms.
Contents
- Method
- What We Found
- Most Selected Sectors (104 quarters)
- Notable Years
- Full Annual Returns
- Backtest Methodology
- Limitations
- Takeaway
- Part of a Series
- References
Data: FMP financial data warehouse, 2000–2025. Updated March 2026.
Method
Data source: Ceta Research (FMP financial data warehouse) Universe: KSC (Korea Stock Exchange), market cap > KRW 300B (~$220M USD) Period: 2000-2025 (26 years, 104 quarterly periods) Rebalancing: Quarterly (January, April, July, October) Signal: Buy all stocks in the bottom 2 sectors by 12-month trailing equal-weighted return Portfolio construction: Equal weight all qualifying stocks in selected sectors Benchmark: KOSPI (^KS11) Cash rule: Hold cash if fewer than 5 stocks qualify Currency note: Returns are in KRW (local currency). Benchmark is KOSPI, also in KRW.
Historical financial data with 45-day lag to prevent look-ahead bias. Full methodology: backtests/METHODOLOGY.md
What We Found
Korea's result is consistent in systematic backtesting: a strategy that beats KOSPI on both total return and risk-adjusted basis, while also limiting drawdown. KOSPI's max drawdown over the same period was deeper than this portfolio's -33.52%. The Sharpe of 0.39 reflects the volatility of KRW-denominated equities, but the excess return of +7.33% per year is a meaningful gap.
| Metric | Portfolio | KOSPI |
|---|---|---|
| CAGR | 12.88% | 5.55% |
| Excess CAGR | +7.33% | — |
| Total Return | 2233% | — |
| Max Drawdown | -33.52% | — |
| Annualized Volatility | 25.36% | — |
| Sharpe Ratio | 0.39 | — |
| Win Rate (vs KOSPI) | 54.81% | — |
| Up Capture | 110.1% | — |
| Down Capture | 65.58% | — |
| Avg Stocks per Period | 50.7 | — |
| Cash Periods | 7 of 104 | — |
The down capture of 65.58% is the headline number. In years when KOSPI fell, this portfolio fell only 65.58% as much. Combined with 110.1% up capture, the strategy gained more when markets rose and lost less when they fell. That asymmetry produces the +7.33% excess CAGR over 26 years.
The portfolio held an average of 50.7 stocks per quarter, manageable for institutional or serious individual investors. Cash periods were 7 of 104 quarters (7%), suggesting Korea occasionally ran short of qualifying stocks.
Most Selected Sectors (104 quarters)
| Sector | Quarters Selected |
|---|---|
| Communication Services | 26 |
| Utilities | 23 |
| Technology | 22 |
Korea's sector composition cycles through telecom, utilities, and tech in its underperformance periods. This reflects Korea's industrial structure: tech-heavy (Samsung, SK Hynix) but with persistent cyclicality in telecom and utilities that the mean reversion signal picks up.
This balance is part of why Korea's risk profile looks manageable. The portfolio wasn't persistently concentrated in a single sector.
Notable Years
2001: +52.59%, KOSPI +39.16%. The strategy outperformed a rising KOSPI by 13.43%. Korean equities recovered broadly from the dot-com selloff, and the selected sectors participated fully. The excess of +13.43% was healthy rather than dramatic.
2005: +80.53%, KOSPI +55.45%. Korea's tech and telecom sectors had been out of favor for several years post-dot-com. When the reversion came, it came hard. +25.08% excess in a year.
2008: -28.06%, KOSPI -37.55%. The strategy held up considerably better during the financial crisis. Korea's selected sectors fell 28.1% versus KOSPI's 37.6%, a +9.49% excess in the worst year of the backtest. The -33.52% max drawdown reflects the 2008 episode and surrounding quarters.
2009: +59.54%, KOSPI +46.55%. Post-crisis recovery was strong. Korean industrials and financials that had been beaten down in 2008 snapped back. +12.99% excess for the year.
2020: +49.97%, KOSPI +35.37%. COVID recovery was sharp for Korean sectors that had been underperforming before the pandemic. +14.6% excess in 2020.
2025: +46.47%, KOSPI +79.65%. The KOSPI surged in 2025 while the portfolio lagged by 33 percentage points. This is the worst single-year gap in the full backtest, driven by concentrated KOSPI leadership in sectors not captured by the mean reversion signal.
Full Annual Returns
| Year | Portfolio | KOSPI | Excess |
|---|---|---|---|
| 2000 | 0.00% (cash) | -50.81% | +50.81% |
| 2001 | +52.59% | +39.16% | +13.43% |
| 2002 | +0.07% | -12.38% | +12.45% |
| 2003 | +22.75% | +29.30% | -6.55% |
| 2004 | +40.64% | +8.82% | +31.82% |
| 2005 | +80.53% | +55.45% | +25.08% |
| 2006 | +8.77% | +3.31% | +5.46% |
| 2007 | +18.62% | +29.14% | -10.52% |
| 2008 | -28.06% | -37.55% | +9.49% |
| 2009 | +59.54% | +46.55% | +12.99% |
| 2010 | +7.42% | +22.05% | -14.63% |
| 2011 | -11.83% | -11.77% | -0.06% |
| 2012 | +5.96% | +11.21% | -5.25% |
| 2013 | +7.71% | -3.15% | +10.86% |
| 2014 | +2.74% | -2.07% | +4.81% |
| 2015 | +9.18% | -0.40% | +9.58% |
| 2016 | -4.43% | +5.60% | -10.03% |
| 2017 | +38.00% | +22.38% | +15.62% |
| 2018 | -3.74% | -18.94% | +15.20% |
| 2019 | +6.07% | +8.22% | -2.14% |
| 2020 | +49.97% | +35.37% | +14.60% |
| 2021 | +8.75% | +1.51% | +7.25% |
| 2022 | -20.44% | -25.53% | +5.09% |
| 2023 | +13.36% | +19.96% | -6.59% |
| 2024 | -5.88% | -10.15% | +4.26% |
| 2025 | +46.47% | +79.65% | -33.17% |
The win rate of 54.81% means the portfolio beats KOSPI in most individual years. The positive CAGR excess of +7.33% comes from both frequency (more wins than losses) and some asymmetry in the larger win years (2000, 2004, 2005, 2017, 2018). The 2025 underperformance stands out as an outlier driven by concentrated market leadership.
Backtest Methodology
| Parameter | Value |
|---|---|
| Signal | 12-month trailing equal-weighted sector return |
| Selection | Bottom 2 sectors each quarter |
| Universe | KSC, market cap > KRW 300B |
| Portfolio | Equal weight all qualifying stocks in selected sectors |
| Rebalancing | Quarterly (Jan, Apr, Jul, Oct) |
| Cash rule | Hold cash if < 5 qualifying stocks |
| Transaction costs | Size-tiered model |
| Data lag | 45 days (prevents look-ahead bias) |
| Period | 2000-2025 (104 quarterly periods) |
| Benchmark | KOSPI (^KS11) |
Limitations
Currency risk. Returns are in KRW. The benchmark is also KOSPI in KRW, so the comparison is apples-to-apples for local investors. A foreign investor in KRW assets faces exchange rate exposure. KRW has been volatile over 26 years, with significant depreciation episodes in 2008 and 2022. Realized returns in USD or EUR would differ from the local-currency numbers.
50 stocks per period. Averaging 50.7 stocks per quarter is manageable but still requires meaningful trading infrastructure. Four rebalances per year on roughly 50 Korean stocks involves transaction costs and Korea-specific market access considerations.
Sector concentration risk. Buying the bottom 2 sectors means concentrated bets. The strategy underperformed KOSPI in 2010, 2011, 2012, and 2023 in sequence, and again sharply in 2025. Extended periods of underperformance are a real test of conviction.
54.81% win rate. The majority of years beat KOSPI, but 2025 shows that single-year gaps can be large in either direction (-33.17% excess). In any given year, the outcome is uncertain.
Emerging market access. KSC-listed stocks require foreign investor registration and Korea-specific brokerage access. Short-selling restrictions, circuit breakers, and market hours differ from other markets. The backtest doesn't capture these operational frictions.
Takeaway
Korea's sector mean reversion produced 12.88% CAGR against KOSPI's 5.55% over 26 years, a +7.33% annual excess. The down capture of 65.58% kept drawdown to -33.52%, and the 54.81% win rate means the portfolio beat the local index in most individual years.
The 65.58% down capture is what makes the math work. Losing 65.58% as much as the market in bad years while capturing 110.1% in good years is a favorable trade. 2008 (-28.06% vs KOSPI -37.55%) and 2018 (-3.74% vs -18.94%) illustrate this clearly.
The balanced sector composition helps. Korea's market cycles through telecom, utilities, and tech in its underperformance periods. That diversification in the signal keeps the portfolio from making the same concentrated bet quarter after quarter.
KRW-denominated results are the relevant measure for local investors. Foreign investors should account for currency exposure separately.
Part of a Series
- US analysis → — The benchmark: consistent returns across 104 quarters
- India analysis → — Highest raw CAGR: 16.42%, +8.40% vs SPY, with -70.5% drawdown
- Global comparison → — 14 exchanges, the full picture
References
Moskowitz, T. J., & Grinblatt, M. (1999). Do industries explain momentum? Journal of Finance, 54(4), 1249-1290.
Data: Ceta Research, FMP financial data warehouse. Universe: KSC. Quarterly rebalance, equal weight, 2000-2025. Returns in KRW. Past performance does not guarantee future results.


