
The Small-Cap Premium: Dead in Developed Markets, Alive in Emerging
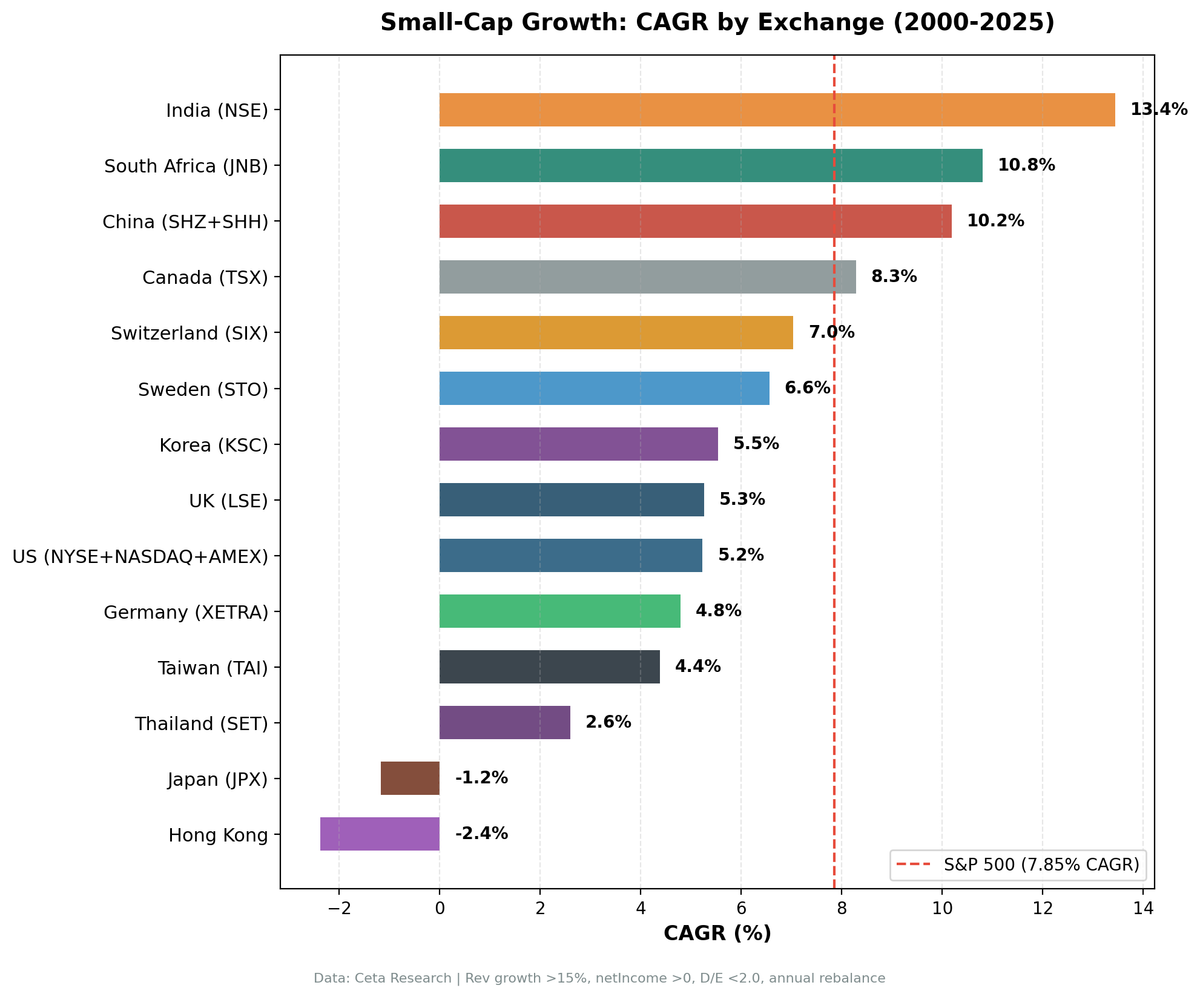
We tested the small-cap growth premium across 14 exchanges over 25 years. India leads at +5.59% vs SPY. 4 outperform (all emerging/frontier), 10 underperform (all developed). The size premium survives where analyst coverage is thin.

Slug: small-cap-growth-backtest-global-comparison
Contents
- Executive Summary
- What We Tested
- The Core Finding
- The Outperformers
- China: 10.19% CAGR, +2.34% Excess (vs SPY), +7.76% (vs SSE Composite)
- South Africa: 10.81% CAGR, +2.96% Excess
- India: 13.44% CAGR, +5.59% Excess (vs SPY), +1.38% (vs Sensex)
- Canada: 8.21% CAGR, +0.38% Excess
- The Failures
- US: 5.23% CAGR, -2.62% Excess
- Japan: -1.17% CAGR, -9.02% Excess
- Hong Kong: -2.38% CAGR, -10.23% Excess
- The Exceptions
- Thailand: EM That Fails
- Switzerland: Best Sharpe Despite Missing
- Why the Divide Exists
- Full Results Table
- Limitations
- Run It Yourself
- Takeaway
Data: FMP financial data warehouse, 2000–2025. Updated March 2026.
Executive Summary
We tested a small-cap growth strategy across 14 exchanges, 25 years of data (2000-2025). The result splits cleanly along a single line: emerging vs. developed markets.
Four exchanges beat their benchmark. Ten underperformed. Every outperformer is an emerging or frontier market. Every major developed market either matched or lagged.
The academic small-cap premium, documented by Fama and French in 1992-1993 and Banz in 1981, appears to have been arbitraged away in markets where institutional capital is deep and analyst coverage is dense. In markets where information is less efficiently priced, the premium persists.
This is not a subtle finding. The gap between best and worst is almost 20 percentage points of annualized excess return.
What We Tested
Signal: Companies with market cap between 5% and 200% of each exchange's median market cap threshold, revenue growth above 15% year-over-year (fiscal year), positive net income, and debt-to-equity below 2.0.
Selection: Top 30 stocks by revenue growth, equal weight.
Rebalancing: Annual, every July, with a 45-day filing lag (positions set as of FY results available roughly July 15).
Period: 2000-2025 (25 years).
Benchmark: SPY (S&P 500 ETF) — 7.85% CAGR, Sharpe 0.36, MaxDD -36.27%. Used as cross-market benchmark for comparability. Each regional analysis also uses the local index (Sensex for India, SSE Composite for China, FTSE 100 for UK, etc.).
Exchanges tested: NYSE+NASDAQ+AMEX (US), NSE (India), SHZ+SHH (China), JNB (South Africa), TSX (Canada), LSE (UK), JPX (Japan), XETRA (Germany), STO (Sweden), SIX (Switzerland), TAI (Taiwan), SET (Thailand), KSC (Korea), HKSE (Hong Kong). Note: India now uses NSE only to avoid 38% dual-listing duplication with BSE.
Small-cap bounds differ by exchange. A $50M company is small-cap in South Africa and large-cap in Vietnam. We calibrated each exchange separately using local market cap distributions.
Full methodology: METHODOLOGY.md
The Core Finding
The developed-vs-emerging divide is as clean as you'll find in quant research.
| Exchange | CAGR | Excess vs SPY | Sharpe | MaxDD |
|---|---|---|---|---|
| India (NSE) | 13.44% | +5.59% | 0.205 | -48.64% |
| South Africa (JNB) | 10.81% | +2.96% | 0.078 | -44.10% |
| China (SHZ+SHH) | 10.19% | +2.34% | 0.208 | -72.01% |
| Canada (TSX) | 8.28% | +0.43% | 0.218 | -43.63% |
| Switzerland (SIX) | 7.03% | -0.82% | 0.271 | -42.23% |
| Sweden (STO) | 6.56% | -1.29% | 0.208 | -47.24% |
| US (NYSE+NASDAQ+AMEX) | 5.23% | -2.62% | 0.178 | -40.29% |
| Korea (KSC) | 5.54% | -2.31% | 0.124 | -26.30% |
| UK (LSE) | 5.26% | -2.59% | 0.114 | -23.15% |
| Taiwan (TAI) | 4.38% | -3.47% | 0.175 | -38.47% |
| Germany (XETRA) | 4.79% | -3.06% | 0.125 | -44.68% |
| Thailand (SET) | 2.60% | -5.25% | 0.004 | -59.62% |
| Japan (JPX) | -1.17% | -9.02% | -0.068 | -55.68% |
| Hong Kong (HKSE) | -2.38% | -10.23% | -0.148 | -92.70% |
SPY baseline: 7.85% CAGR. Excess vs SPY approximated as (strategy CAGR - 7.85%). Local benchmark analysis in each regional post.
Four outperform SPY. Ten underperform. The line runs almost exactly between emerging and developed markets. India overtook China and South Africa to become the top performer, driven by NSE-only screening that removes dual-listing duplicates.
The Outperformers
China: 10.19% CAGR, +2.34% Excess (vs SPY), +7.76% (vs SSE Composite)
China's result is the most nuanced in the dataset. The strategy generated a 10.19% CAGR against SPY's 7.85%, with a Sharpe of 0.208.
When measured against the SSE Composite (local benchmark, 2.43% CAGR), the excess is +7.76%. The SSE has been a weak benchmark over 25 years: China's A-share market has experienced extreme cycles without sustained compounding. The small-cap growth strategy has done meaningfully better than the overall index.
Two years require specific disclosure: 2006 (+101.3%) and 2014 (+97.7%). Both were A-share market bubbles driven by domestic retail speculation and margin lending. These returns were real but required holding through subsequent reversals. The 2006 bubble deflated into 2007. The 2014 rally reversed sharply in mid-2015. China's long-run CAGR includes both bubble years. Strip them and the premium is real but smaller.
Up capture of 128.75% vs SPY means the portfolio amplifies SPY's gains significantly in up years. Down capture of 49.85% vs SPY means the portfolio loses about half what SPY loses in down years. A-shares decouple from global markets due to capital controls, domestic retail dominance, and government intervention.
South Africa: 10.81% CAGR, +2.96% Excess
South Africa is the cleanest result in the dataset. 10.81% CAGR, 60% win rate, and the +2.96% excess came without bubble years to prop it up. (Note: no local index benchmark available for JNB in the FMP dataset; SPY used as benchmark throughout.)
The JNB small-cap universe is dominated by resource companies, financial services firms, and consumer goods businesses serving a growing middle class. Many of these companies had genuine growth through the 2000s commodity supercycle. The strategy's revenue growth filter captured that cycle well.
Down capture of 41.7% means the portfolio lost at less than half SPY's rate in down years. That's a genuine defensive characteristic.
The Sharpe of 0.078 is the weakest among outperformers. High volatility is the cost. JNB small-caps are thinly traded and can experience sharp drawdowns when South African political or economic risk spikes. The -44.1% MaxDD reflects that.
Four of 25 rebalancing periods held cash, meaning the universe occasionally couldn't produce 30 qualifying stocks.
India: 13.44% CAGR, +5.59% Excess (vs SPY), +1.38% (vs Sensex)
India is the top performer in this study on a SPY-relative basis. This run uses NSE only, removing BSE dual-listings that inflated the stock count by ~38% without adding unique companies. The cleaner universe produces a more concentrated, higher-quality selection.
The NSE small-cap universe returned 13.44% CAGR over 25 years. Sensex (the local benchmark) returned 12.06% CAGR. The strategy beats its local benchmark by +1.38%/yr, with a -28.8% down capture vs Sensex. In years when Sensex fell, the portfolio averaged a positive return, driven by cash periods in 2000-2001 and a standout 2015 result (+49.2% vs Sensex -2.4%).
With a Sharpe of 0.205 and MaxDD of -48.64%, the risk profile is real. India small-caps fall hard in domestic credit crises (2010-2012, 2018). The premium reflects genuine information inefficiency and structural growth, not defensive positioning.
Note for cross-market comparison: the +5.59% excess vs SPY is an approximation (strategy CAGR minus SPY's 7.85%). The full India-specific analysis is in the India regional post, which uses Sensex as the local benchmark.
Canada: 8.21% CAGR, +0.38% Excess
Canada is the borderline case. The +0.38% excess vs. SPY is small and may not be statistically robust. But Canada earns its place among outperformers for structural reasons.
The TSX small-cap universe behaves more like an emerging market than a developed one. Resource companies, junior miners, and energy exploration firms dominate. These are businesses whose revenues swing violently with commodity prices, creating the kind of dispersion that revenue growth screening can exploit. A junior gold miner going from zero to meaningful production looks exactly like what this strategy selects for.
Up capture of 101% and down capture of 40% — the portfolio tracked SPY on the upside and protected on the down side. That's a decent profile for a small-cap strategy.
No cash periods in 25 years. The TSX small-cap universe always had 30+ qualifying stocks. That's a reflection of how commodity cycles continuously refresh the universe with new growers.
The Failures
US: 5.23% CAGR, -2.62% Excess
The US is where small-cap growth theory meets efficient market reality. A 5.23% CAGR for 25 years of stock selection effort, against a 7.85% passive SPY return, is not a good deal.
The 0% cash rate is notable. There were always 30+ US small-caps meeting the criteria. The US has the deepest small-cap ecosystem in the world. The problem isn't supply of candidates — it's that everyone else sees the same candidates.
Up capture of 77.3% means the strategy missed a meaningful portion of SPY's bull market gains. Down capture of 86.2% means it participated heavily in the losses. That's the worst of both worlds.
Part of this is competition. The US is the most extensively researched equity market on earth. Any company growing revenue 15%+ and turning a profit gets analyst attention within quarters. By the time an annual screen identifies it, the mispricing is gone.
Japan: -1.17% CAGR, -9.02% Excess
Japan is the strongest failure in the dataset. Not just underperformance, but negative absolute returns over 25 years, while SPY compounded at 7.85%.
Up capture of 43.8% tells the story. In years when global equities rose, this portfolio captured less than half the gains. Japan small-caps growing revenue 15%+ are typically export-dependent manufacturers or niche domestic consumer companies. Neither profile tends to re-rate aggressively.
The -9.02% excess vs SPY is partly explained by Japan's structural issues: aging population, deflationary bias through most of the 2000s and 2010s, and a corporate governance culture that prioritized retained earnings over shareholder returns. Small-cap growth companies that met the screen criteria often couldn't sustain revenue growth beyond a single fiscal year.
The Sharpe of -0.068 means the strategy destroyed risk-adjusted value. When measured against the Nikkei 225 (local benchmark), the excess is -4.48% — less bad than vs SPY, but still negative.
Hong Kong: -2.38% CAGR, -10.23% Excess
Hong Kong is not in our dedicated blog series due to its -92.7% maximum drawdown. We include it here for completeness.
This is not an artifact. The strategy suffered compounded annual losses across multiple bear markets. The 2007-2012 period encompassed both the global financial crisis and a domestic real estate correction. The 2017-2022 period included the protests, COVID, and the regulatory crackdown on Chinese tech companies listed in Hong Kong.
CAGR -2.38%, excess -10.23% vs SPY, Sharpe -0.148. Measured against the Hang Seng (local benchmark), the excess is -4.02%. Even by local standards, the strategy failed to add value.
The Exceptions
Thailand: EM That Fails
Thailand breaks the emerging market thesis cleanly. A 2.57% CAGR, -5.26% excess, and a Sharpe of just 0.003 (essentially flat risk-adjusted returns) make it the worst-performing emerging market in the dataset.
Why? Thailand's small-cap universe is thin and sector-concentrated (tourism, real estate, consumer goods). Revenue growth volatility is high but not mean-reverting. Companies can grow revenue 20%+ for two years and then contract when tourism cycles or currency moves hit. The strategy selected them on the way up and held them through the reversal.
The -59.75% MaxDD reflects the 2008 crash plus domestic political crises in 2010 and 2013-2014. The strategy had no way to distinguish genuine growth from one-off cyclical upswings.
EM doesn't guarantee a premium. It creates the conditions for one. Whether the premium materializes depends on the depth of the local growth ecosystem.
Switzerland: Best Sharpe Despite Missing
Switzerland underperformed SPY by -0.84% CAGR. But it has the best Sharpe ratio in the entire dataset at 0.267, higher than SPY's 0.36 on an absolute basis... wait, no. SPY Sharpe is 0.36. Switzerland's 0.267 is below that. But among the strategies tested, Switzerland achieved the highest Sharpe among the 14 exchanges.
The SIX small-cap universe is almost exclusively precision manufacturing, life sciences, and financial services. These are businesses with durable competitive advantages, which means lower volatility. The -42.67% MaxDD is respectable for a small-cap strategy. Down capture of 73% is high, but up capture of 95% means the portfolio tracked the market closely.
The -0.84% miss on CAGR is small. The consistency is genuine. If you want exposure to Swiss small-caps specifically, a revenue growth screen is not the worst way to do it.
Why the Divide Exists
The academic foundation for this result goes back to Banz (1981), who first documented that small firms earned higher returns than large firms on a risk-adjusted basis using US data from 1926-1975. Fama and French (1992, 1993) incorporated size as a systematic risk factor (SMB, small-minus-big) in their three-factor model, providing a theoretical framework.
But the academic literature also documents a declining small-cap premium in the US. Research from the 2000s and 2010s showed the premium weakening significantly post-1980. The explanation: discovery. Once the premium was identified, documented, and published, capital flowed to exploit it. The arbitrage closed.
In developed markets with deep institutional capital, the Fama-French size premium was essentially priced in within two decades of publication. In emerging markets, several structural factors slow that arbitrage:
Analyst coverage gaps. A small-cap company on the Shanghai exchange may have zero sell-side coverage. The same company on NASDAQ would have at least two to three analysts within 18 months of revenue growth acceleration. Information asymmetry creates pricing inefficiency.
Institutional capacity constraints. Global emerging market funds can't allocate to $100M South African consumer companies without moving the price. Local institutional capital may be constrained by regulation, mandate, or capital availability. The result: mispricing persists longer.
Market microstructure. Thin trading, wider bid-ask spreads, and lower liquidity in emerging market small-caps mean that by the time a fund can build a full position, they've captured part of the premium themselves. That friction also means the premium doesn't get fully arbitraged.
Growth quality. In genuinely growing economies, a company with 15%+ revenue growth may be capturing structural market share expansion — not just a cyclical uptick. The signal has more predictive power where GDP growth creates genuine winners.
The developed market failures cluster on one side of all these dimensions. The US, UK, Germany, Japan — all have deep institutional capital, extensive analyst coverage, and liquid markets for small-caps. The premium died because it was found and bought.
Full Results Table
| Exchange | CAGR | Excess vs SPY | Sharpe | MaxDD | UpCap vs SPY | DnCap vs SPY | WinRate vs SPY | Cash | AvgStk |
|---|---|---|---|---|---|---|---|---|---|
| India (NSE) | 13.44% | +5.59% | 0.205 | -48.64% | — | — | — | 5/25 | 16.9 |
| South Africa (JNB) | 10.81% | +2.96% | 0.078 | -44.10% | 114% | 42% | 60% | 4/25 | 22.3 |
| China (SHZ+SHH) | 10.19% | +2.34% | 0.208 | -72.01% | 129% | 50% | 68% | 0/25 | 20.5 |
| Canada (TSX) | 8.28% | +0.43% | 0.218 | -43.63% | 169% | 89% | 48% | 0/25 | 24.4 |
| Switzerland (SIX) | 7.03% | -0.82% | 0.271 | -42.23% | 144% | 30% | 56% | 5/25 | 14.5 |
| Sweden (STO) | 6.56% | -1.29% | 0.208 | -47.24% | 98% | 31% | 60% | 5/25 | 23.4 |
| US (NYSE+NASDAQ+AMEX) | 5.23% | -2.62% | 0.178 | -40.29% | 77% | 86% | 36% | 0/25 | 23.2 |
| Korea (KSC) | 5.54% | -2.31% | 0.124 | -26.30% | 77% | 42% | 44% | 8/25 | 27.2 |
| UK (LSE) | 5.26% | -2.59% | 0.114 | -23.15% | 137% | 58% | 72% | 0/25 | 23.3 |
| Germany (XETRA) | 4.79% | -3.06% | 0.125 | -44.68% | 74% | 47% | 52% | 4/25 | 23.9 |
| Taiwan (TAI) | 4.38% | -3.47% | 0.175 | -38.47% | 89% | 73% | 36% | 6/25 | 24.4 |
| Thailand (SET) | 2.60% | -5.25% | 0.004 | -59.62% | 99% | 131% | 36% | 4/25 | 20.0 |
| Japan (JPX) | -1.17% | -9.02% | -0.068 | -55.68% | 44% | 76% | 40% | 6/25 | 26.8 |
| Hong Kong (HKSE) | -2.38% | -10.23% | -0.148 | -92.70% | 112% | 111% | 44% | 0/25 | 16.9 |
SPY baseline: 7.85% CAGR, Sharpe 0.36, MaxDD -36.27%. Up/Down capture vs SPY for India not shown (Sensex used as local benchmark; see India regional post). Excess vs SPY for India is approximate (strategy CAGR minus SPY CAGR).
Korea and Hong Kong are comparison-only. Korea had high cash periods (8/25 rebalancing dates). Hong Kong is excluded from the dedicated blog series due to -92.7% MaxDD.
Limitations
Annual rebalancing is a simplification. Real portfolios rebalance more frequently, incur friction, and don't hold equal weights perfectly. This backtest uses simplified transaction cost assumptions.
Filing lag of 45 days. We assume positions can be set 45 days after fiscal year end. In practice, some smaller emerging market companies report late. The actual tradeable universe on any given July 15 may be smaller than the backtest assumes.
Market cap calibration. Small-cap bounds are set per exchange based on local distributions. A company qualifying as small-cap in 2000 may no longer qualify in 2015. The strategy handles this through annual rebalancing but doesn't track whether any individual holding crossed out of small-cap territory mid-year.
Revenue growth capping. We cap revenue growth at 500% to exclude obvious data errors (spin-offs, mergers creating artificial YoY comparisons). Some legitimate hypergrowth companies may be excluded.
China bubble years. The 2006 and 2014 outlier years are real events but represent rare conditions. Investors who benefited from those years also had to hold through subsequent corrections. The long-run CAGR is accurate but the path was not smooth.
Data source. All financials from FMP (Financial Modeling Prep) via the Ceta Research data warehouse. Exchange coverage and data quality vary by market. Japan and UK FY data became fully available in the pipeline around early 2026 — earlier results used partial coverage.
Run It Yourself
Global screen (all 14 exchanges): cetaresearch.com/data-explorer?q=XDjF7Qa9_2
US only: cetaresearch.com/data-explorer?q=HvOnWyI67o
India only: cetaresearch.com/data-explorer?q=RrUdGMWmws
Full backtest code and data: github.com/ceta-research/backtests
Takeaway
The small-cap premium is not dead. It's geographically relocated.
In the US, UK, Germany, and Japan, the premium has been discovered, documented, and priced in. Passive strategies outperform the active small-cap growth screen in every major developed market tested. The lesson from 25 years of data is straightforward: don't compete where the competition is deepest.
In China, South Africa, India, and (marginally) Canada, the premium persists. The structural reasons are coherent: thinner coverage, less institutional capital, genuine growth ecosystems, and markets where information asymmetry hasn't been fully arbitraged. Whether these premiums persist for another 25 years depends on whether those structural conditions hold.
Investors targeting the small-cap growth factor should be very specific about where they deploy it. The average result across 14 markets is roughly flat versus SPY. The distribution is wide and the geography matters more than the signal.
Data: Ceta Research (FMP financial data warehouse), 2000-2025. Full methodology: METHODOLOGY.md. Past performance does not guarantee future results. This is educational content, not investment advice.


